

The Art of the Brushback
This article was written by Theo Tobel
This article was published in Fall 2020 Baseball Research Journal
“Pitching is the art of instilling fear.”1 — Sandy Koufax
In Major League Baseball, the difference between a winning team and a losing one can be mental preparation and psychological advantage. It is a game of streaks, slumps, and momentum. A team that can get inside its opponent’s head will find it much easier to win games. There are many ways that mental strategy has been used in the game. After a questionable call, managers may purposely get ejected to fuel their team. Hitters may use certain routines to get into the pitcher’s head, such as the well-known “Soto Shuffle.”2 And for pitchers, the brushback pitch is a tool that is commonly used to intimidate batters or to move them off of the plate. Even though a brushback pitch may lead to dangerous outcomes such as hit-by-pitches, when executed correctly, it is believed to negatively affect the hitter’s performance.3
A “brushback pitch” is defined as a pitch that, when it crosses home plate from the catcher’s perspective, falls within the batter’s specified box, but does not hit the batter. In this paper, I analyze the use of the brushback pitch by count and pitch type to determine which one has the greatest effect on hits (by use of the chi-square test) and walks.
Data Collection
The width of the plate is almost 17 inches, the width from the edge of the plate to each of the batter’s boxes is 6 inches, and the width of each batter’s box is 4 feet (or 48 inches).
In order to determine which pitches qualify as brushbacks, I used 2018 regular season data from Daren Willman’s Baseballsavant.com.4 As defined by Baseball Savant’s documentation glossary, “plate_x” is the horizontal position of the ball when it crosses home plate from the catcher’s perspective.5 Also, on Baseball Savant, the strike zone spans from -0.8 to 0.8 “plate_x” units.6
To convert “plate_x” to inches, I used the plate dimensions to make a ratio. By setting 1.6 “plate_x” units (absolute value of -0.8 – 0.8) to 17 inches, I found that 1 “plate_x” unit equals 10.625 inches, or 1 inch equals 1 ÷ 10.625, or about 0.09 units.
Next, “Flag 1” was classified as the right-handed batter’s box, and “Flag 2” was designated as the left-handed batter’s box. Since the distance from the edge of the plate to each batter’s box is 6 inches, I used the conversion calculated above to find that 6 inches equals 6 ÷ 10.625, or about 0.56 units. Since the width of the batter’s box is 48 inches, I also used the conversion to find that 48 inches equals 48 ÷ 10.625, or about 4.52 units. Therefore, Flag 1 ranges from (-0.8 – 0.6) to (-0.8 – (0.6 + 4.5)) “plate_x” units, or about -1.4 to -5.9 units (0.6 is an estimate of 0.56 and 4.5 is an estimate of 4.52). On the other side of the plate, Flag 2 ranges from (0.8 + 0.6) to (0.8 + (0.6 + 4.5)) “plate_x” units, or about 1.4 to 5.9 units. This makes sense, because the middle of home plate has a “plate_x” value of 0, so the values of the batter’s boxes are absolutes of each other, as the plate and boxes are symmetric across the “plate_x” = 0.
Three columns were added to the CSV file from Baseball Savant, “Result” (Column A), “Flag 1” (Column B), and “Flag 2” (Column C). The “Result” column states whether a pitch is a brushback. The code below states that any pitch in the “plate_x” range -1.4 to -5.9 units returns a 1 in the “Flag 1” column. Similarly, any pitch in the “plate_x” range 1.4 to 5.9 units returns a 1 in the “Flag 2” column. If a pitch isn’t in the specified ranges, a 0 is returned. Basically, any pitch that falls within a batter’s box is labeled a 1, and otherwise a 0. To determine whether a pitch was a brushback from the data, if the equation of “Flag 1” + “Flag 2” resulted in a 1, the “Result” was “YES.” A pitch can’t be in both batters’ boxes, so if either of the Flags equaled 1, it appeared as a brushback pitch since 0 + 1 or 1 + 0 = 1.
The Excel code is shown below:
In “Flag 1”: =(K2="R")*(N2<=-1.36470588235)*(N2>=-5.88235294118)*(I2<>"hit_by_pitch")
In “Flag 2”: =(K2="L")*(N2>=1.36470588235)*(N2<=5.88235294118)*(I2<>"hit_by_pitch")
In “Result”: =IF((B2+C2)=1,"YES","NO")

where Column K is “stand” = Side of the plate batter is standing,
where Column I is “description” = Description of the resulting pitch, and
where Column N is “plate_x,”
and “R” is right and “L” is left.
After brushbacks were classified in the “Result” column as a “YES,” I wrote a code that looked through the data and classified pitches in a brushback at-bat. I added a fourth column, “Is BBAB?” to classify brushback at-bats. Pitches in brushback at-bats were classified with a “Y.”
The code is shown below:
=IF((SUMPRODUCT(($A$2:$A$35000="YES")*($O$2:$O$35000=O2)*($E$2:$E$35000=E2)*($G$2:$G$35000=G2),$E$2:$E$35000))>0,"Y","")

where Column A is “Result” (see above),
where Column O is “at_bat_number” = Plate appearance number of the game,
where Column E is “game_date” = Date of the Game, and
where Column G is “batter” = MLB Player ID tied to the play event.
The code marks a “Y” in Column D (“Is BBAB?”) on every pitch with the same at-bat number, game date, and batter if there is a brushback pitch.
Figure 1. An example of Athletics 2018 data
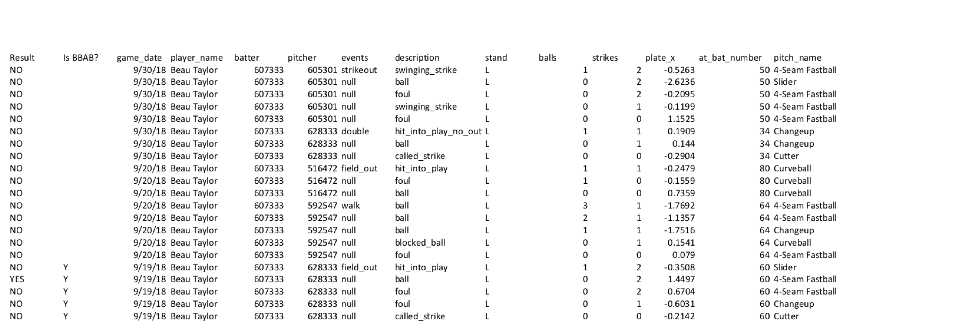
(Click image to enlarge)
Now that the data are processed and sorted, statistical significance must be determined to see if there is a correlation between batting statistics and brushback pitch usage. In order for the results to be significant following a chi-square test for independence, the p value must be less than the significance level, 0.05 or 5 percent. Also, three conditions must be met: a random sample, ideal values more than 5, and a sample size of less than 10% of the population.
The Effect of the Brushback Pitch on Batting Average
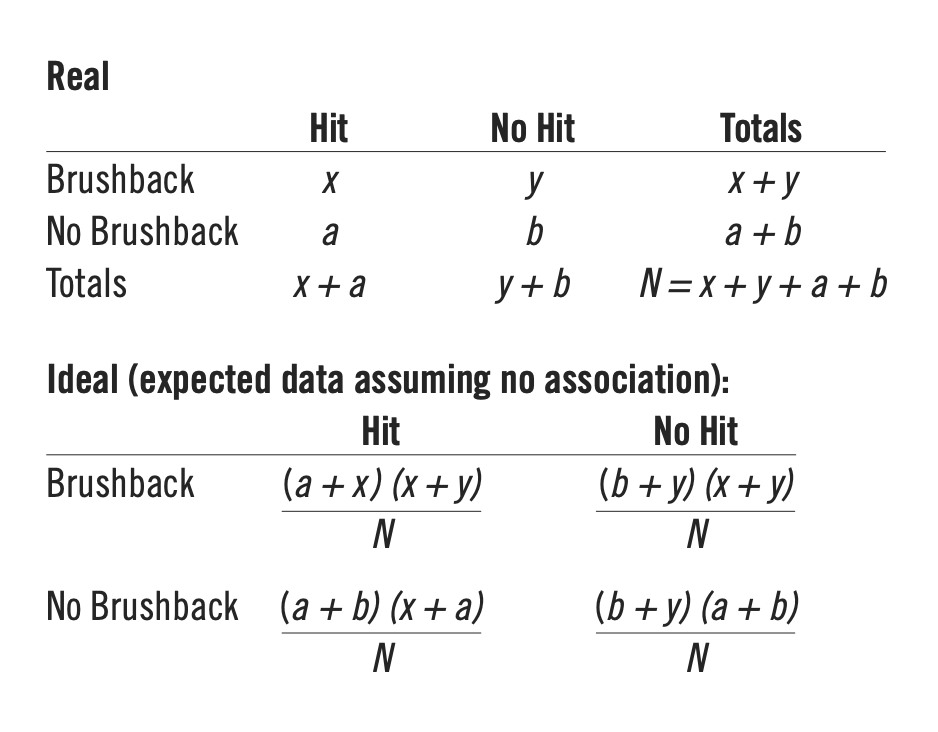
For this test of statistical significance, I am going to use the chi-square test for independence because it is appropriate for the data being analyzed. The chi-square test will give two tables, one real and one ideal, and will also give a p-value. My null hypothesis (H0) is that a brushback pitch does not affect batting average, while my alternative hypothesis (Ha) states that brushback pitches affect batting average.
First, events with “null,” “other_out,” “pickoff_1b,” “pickoff_2b,” “pickoff_3b,” “pickoff_caught_stealing_2b,” “pickoff_caught_stealing_3b,” “pickoff_caught_stealing_home,” “caught_stealing_2b,” “caught_stealing_3b,” “caught_stealing_home,” “walk,” “field_error,” “sac_bunt,” “sac_fly,” “sac_bunt_double_play,” “sac_fly_double_play,” “catcher_interf,” and “hit_by_pitch” were removed from the data because each of these outcomes is not counted as an at-bat, so they do not affect batting average.
Second, I randomly picked 15,000 at-bats as a sample size since there were around 165,000 at-bats in the 2018 regular season.7 The amount 15,000 is less than 10% of 165,000, but not so small that the results would be skewed. This group of 15,000 at-bats was labeled “Sample 1.”
I filtered the data by classifying at-bats as brushback or no-brushback at-bats, and then as a hit or no hit. Any event with “single,” “double,” “triple,” or “home_run” was classified as a hit. These values were placed in the real table. Then, an ideal table was used to find the difference between the real and ideal values. If there was statistical significance, the difference was deemed noteworthy, and if the values were alike then I determined there was little to no statistical significance.
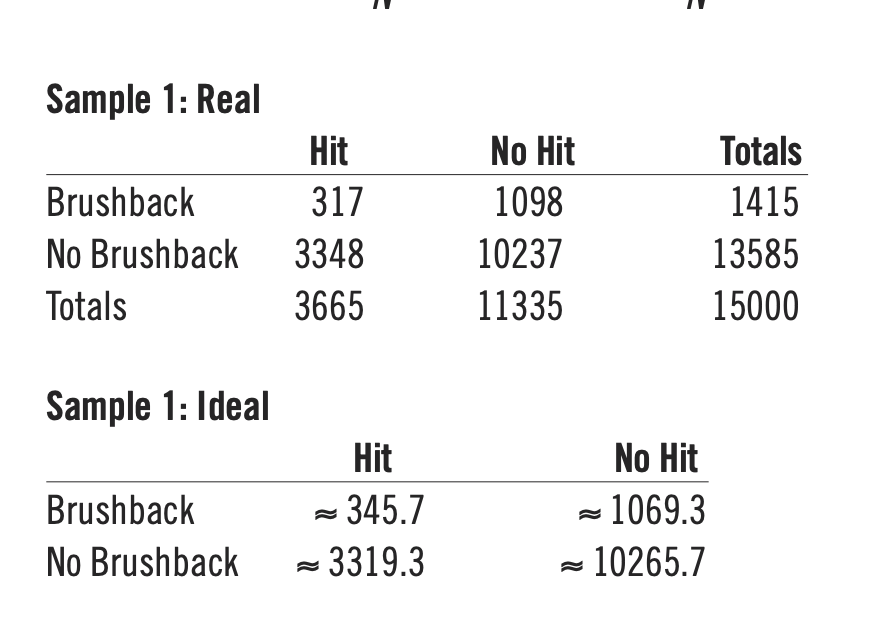
Since all of the values in the ideal table are above 5, the third condition of statistical significance for a chi-square test for independence is met.
Degrees of Freedom (DF) = (r-1)(c-1), where r is the number of rows and c is the number of columns
Degrees of Freedom (DF) = (2-1)(2-1) = 1
Chi-Squared = Σ (R – I ) ^ 2 / I, where R is the real value for a given data cell and I is the ideal for that cell.
Chi-Squared ≈ 3.49
Using an online calculator,8
P-value ≈ 0.062, and 0.062 > 0.05, so the result is not significant and fails to reject null hypothesis.
Based on the Sample 1 test results, brushback pitches do not significantly affect batting average and are thus not a good strategy for pitchers if their goal is to reduce batting average. However, this sample could be an outlier, so a chi-square test for Sample 2, chosen the same way as Sample 1 with replacement from previous samples, is shown below:
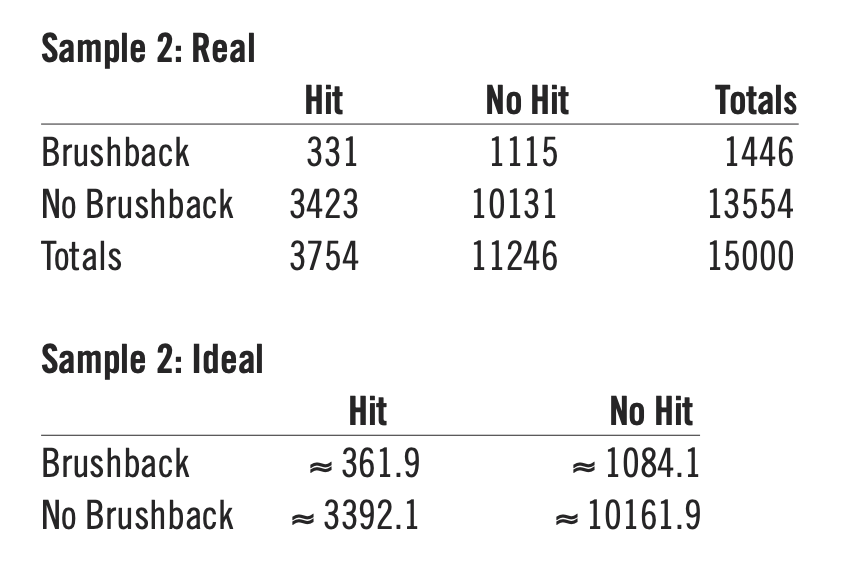
Chi-squared ≈ 3.89.
P-value ≈ 0.049, and 0.049 < 0.05, which is slightly significant and rejects null hypothesis.
Since Sample 1 was slightly insignificant and Sample 2 was slightly significant, a third test was run, called Sample 3.
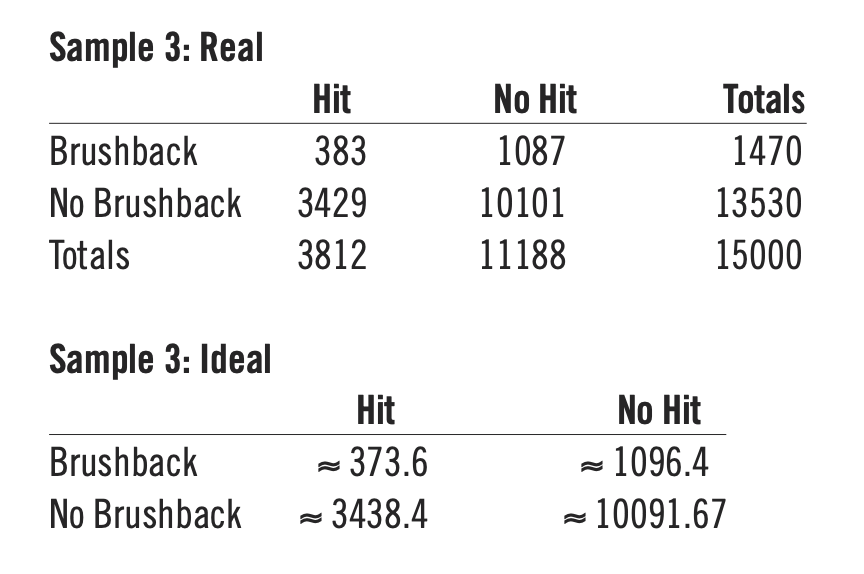
Degrees of Freedom = 1.
Chi-squared ≈ 0.353365.
P-value ≈ 0.55, and 0.55 > 0.05, which is not significant and fails to reject null hypothesis.
The results of these three samples suggest that there is little to no significance between brushback pitches and batting average. The first sample shows significance at the 0.10 level but not at 0.05; the p-values vary greatly and thus the null hypothesis cannot be entirely rejected.
All in all, this shows that brushback pitches do not have a significant effect on batting average, and so the common misconception that hitters are “intimidated” after a brushback pitch cannot be proven by the data.
The Effect of the Brushback Pitch on Walk Percentage
Brushback pitches do not affect batting average, so they do not significantly help a pitcher reduce the “hit” portion of Walks and Hits per Innings Pitched, or WHIP. The other factor of WHIP is walks, or base on balls. Since brushbacks are not strikes (they are in the batter’s boxes far away from the plate), my null hypothesis (H0) is that brushback pitches do not affect walk percentage (BB%), while my alternative hypothesis (Ha) states that brushback pitches have an effect on walk percentage.
Two samples, labeled Sample 4 and 5 are shown below. Like Sample 1, 2 and 3, these are randomly chosen and are less than 10% of the data. The only difference is that walks are included in the “events” column and all other at-bat outcomes, including hits, are under no walk.
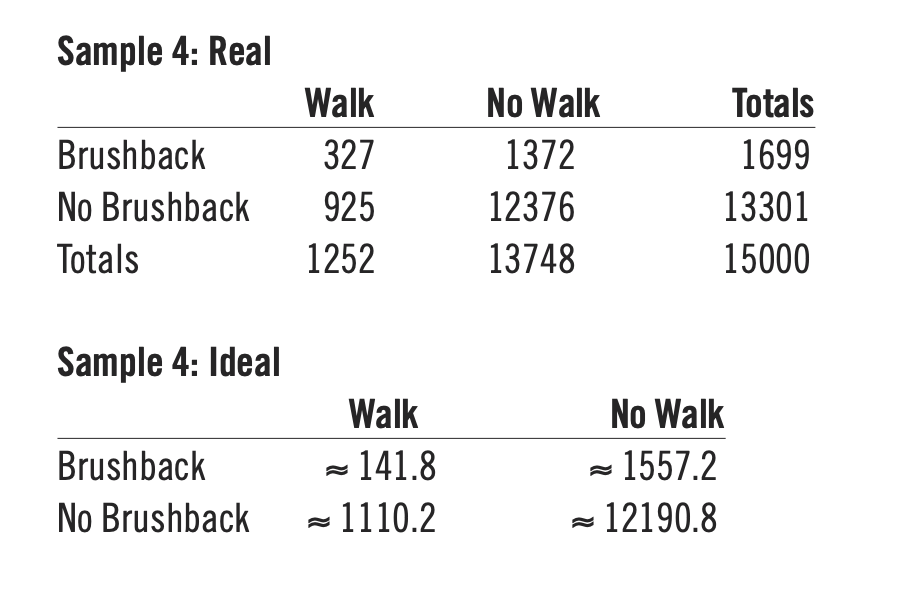
Degrees of Freedom = 1.
Chi-squared ≈ 297.6.
P-value < 0.00001 and < 0.05, which is significant and rejects null hypothesis.
This shows that there is a strong significance between walk percentage and brushback pitches. However, this sample may be an outlier (even though that would be very unlikely because of Sample 4’s remarkably low p-value), so Sample 5 is shown below chosen the same way.

Degrees of Freedom = 1.
Chi-squared ≈ 293.3.
P-value < 0.00001 and < 0.05, which is significant and rejects null hypothesis.
Based on these two very low p-values, the relationship between walk percentage and brushback pitches is significant.
Analyzing The Effect of the Brushback Pitch on Walk Percentage
Since brushback pitches affect walk probability, the only question is whether brushbacks raise or lower the BB% (walk percentage). The alternative hypothesis (brushback pitches affect walk percentage) is supported because brushbacks add 1 additional ball to a walk (4 balls).
For Sample 4:
- BB% of at-bats with brushbacks: 19.25%
- BB% of at-bats without brushbacks: 6.95%
For Sample 5:
- BB% of at-bats with brushbacks: 18.48%
- BB% of at-bats without brushbacks: 6.45%
As shown, BB% is nearly three-fold in at-bats with brushbacks. In conclusion, brushback pitches do not affect batting average but they increase the likelihood of a walk, which is not beneficial for pitchers.
Brushback Usage by Pitch Type
A common use of brushbacks is as an intimidation tool, as pitchers can use extremely fast pitches to scare batters and keep them off the plate. Some believe that brushbacks are thrown “accidentally” by a pitcher – that they are pitches where the ball slipped, and were not intended to scare the batter. The data below prove this belief wrong.
Figure 2. Dark (Brushback Pitches) vs. Light (Non-Brushback Pitches)
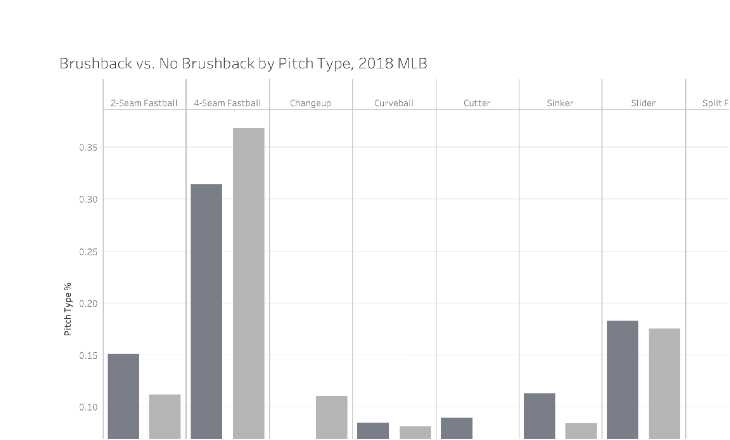
(Click image to enlarge)
In the 2018 MLB season, 80.2% of pitchers were right-handed, and 65.2% of batters were right-handed.9 The majority of brushbacks were thrown to right-handed batters by right-handed pitchers. The three pitches that are most commonly thrown inside to a right-handed batter by a right-handed pitcher are the 2-seam fastball, the changeup, and the sinker. The 4-seam fastball could be used as an intimidation pitch, but since it is the natural tendency of this pitch to tail away from the right-handed batter, the effectiveness and usage of the pitch as a brushback is diminished, as reflected in the data. The graph shows that on non-brushback pitches, the 2-seam fastball and changeup are thrown at the same rate while the sinker is thrown slightly less often. However, on brushback pitches, both the 2-seam fastball and the sinker are thrown significantly more often than the changeup. The fact that the more intimidating “fastball” pitches (2-seam and sinker) are thrown as brushbacks significantly more often than the non-intimidating “off-speed” pitch (changeup) demonstrates intent by the pitchers to throw hard inside. If brushbacks were thrown accidentally, the incidence of brushbacks would be consistent across all three pitch types.
Brushback Usage by Pitch Count
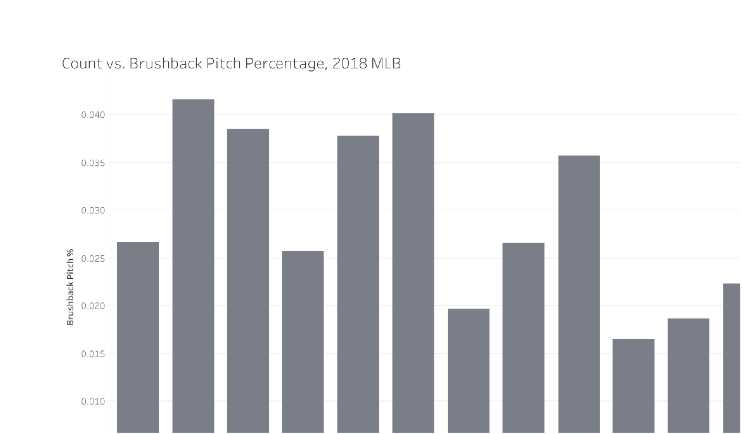
The count when a brushback is thrown can also suggest intent and determine effectiveness. Pitchers tend to throw brushbacks once they have thrown a strike. The highest percentage of brushbacks thrown is on 0-1 (4.15%), 0-2 (3.85%), and 1-2 (4.01%) counts. A possible reason for this is that pitchers feel more comfortable “messing” with batters once they are ahead in the count, in order to intimidate them and more firmly establish control of the strike zone.
The lowest percentage of brushbacks thrown is on 3-ball counts: 1.64% of the time on 3-0 counts, 1.86% on 3-1 counts, and 2.23% on 3-2 counts. On 3-0 counts, the pitcher is so behind that they have no benefit of throwing at a batter, especially considering that a brushback is a ball the majority of the time. On 3-1 and 3-2, a pitcher’s priority is to prevent a walk, so a brushback pitch wouldn’t be useful.
Figure 3 shows brushbacks thrown by count divided by total pitches thrown by count. It shows that a pitcher is most likely to throw a brushback on an 0-1 count.
Figure 3. Count vs. Brushback Pitch Percentage, 2018 MLB
(Click image to enlarge)
Conclusion
In conclusion, the brushback pitch has no significance in regard to batting average, but it increases walk percentage by a substantial amount. The 2-seam fastball and sinker are the inside fastball pitches most commonly used to throw the brushback, which suggests intent to intimidate (as opposed to being thrown accidentally). Brushbacks are also thrown most often in pitcher-friendly counts, furthering the evidence of strategic intent.
There are many additional studies that can be performed with these data. For example, do brushback pitches affect other hitting statistics, such as strikeout or slugging percentage? The door is open to further data-driven exploration of this under-studied aspect of baseball performance and psychology.
THEO TOBEL is a sophomore at Santa Monica High School, where he pitches and plays middle infield on the baseball team. In his spare time, Theo enjoys watching Dodger baseball and collecting baseball cards. He combines his love for baseball and mathematics by studying baseball analytics. Theo can be reached at theotobel@yahoo.com.
Notes
1 Robert E. Hood, The Gashouse Gang (New York: Morrow, 1976).
2 Alden Gonzalez, “’It’s a Fight, Just the Pitcher and Me’: What’s behind the Juan Soto Shuffle.” ESPN. ESPN Internet Ventures, October 21, 2019. Accessed May 8, 2020. https://www.espn.com/mlb/story/_/id/27868944/fight-just-pitcher-the-juan-soto-shuffle
3 “Brushback Pitch.” Baseball Reference Bullpen. Accessed May 8, 2020. https://www.baseball-reference.com/bullpen/Brushback_pitch
4 “Baseball Savant: Trending MLB Players, Statcast and Visualizations.” baseballsavant.com. Accessed May 8, 2020. https://baseballsavant.mlb.com/
5 Daren Willman, “Statcast Search CSV Documentation.” baseballsavant.com. Accessed May 8, 2020. https://baseballsavant.mlb.com/csv-docs
6 “Statcast Search.” baseballsavant.com. Accessed May 8, 2020. https://baseballsavant.mlb.com/statcast_search
7 “2018 Major League Baseball Season Summary.” Baseball Reference. Accessed May 8, 2020. https://www.baseball-reference.com/leagues/MLB/2018.shtml
8 “Chi-Square Calculator.” Chi Square Calculator 2×2 (includes Yates correction). Accessed April 10, 2020. https://www.socscistatistics.com/tests/chisquare/default2.aspx
9 “Handedness Report.” Baseball Reference. Accessed September 21, 2020. https://www.baseball-reference.com/friv/handedness.cgi