The Best Fielders of the Century
This article was written by Bill Deane
This article was published in The National Pastime (Volume 2, 1983)
Who are the best fielders of all time, at each position? How can we compare a Bill Dickey with a Bill Freehan, a Bobby Doerr with a Bobby Grich, an Amos Strunk with an Amos Otis?
With these age-old riddles in mind, I closeted myself in a room with The Baseball Encyclopedia, a pocket calculator, and a pad of notebook paper to find a solution. The result is a statistic I call Relative Fielding Average (RFA), which places an individual’s fielding percentage in the context of his particular era, thus permitting meaningful cross-era comparison.
Currently, there are two principal ratings of defensive performance: fielding average and total chances per game. Each has strengths and weaknesses.
Total chances per game (TC/G) is particularly effective in stating the total defensive contribution of shortstops, second basemen, and third basemen. It tells us, for example, that throughout his career the Cardinals’ million-dollar shortstop, Ozzie Smith, has consistently averaged about one more chance per game than Larry Bowa of the Cubs. Although Bowa posts outstanding fielding averages, he may not be as valuable as “The Wizard of Oz.”
The TC/G method is not as useful in rating outfielders, since the stats of left, center, and right fielders are ordinarily lumped together. Furthermore, TC/G has virtually no use in appraising first basemen or catchers.
A look at the record books shows us that almost all of the lifetime leaders in TC/G, at each infield and outfield position, are old-timers, with names like Tom Jones, Fred Pfeffer, and Jerry Denny. For catchers, however, just the reverse is true: almost all of the leaders are modern players. The obvious reason for this state of affairs is that in a power-pitcher, home run swing era there are far more strikeouts-thus more putouts for catchers and fewer chances per game for other fielders.
Besides being of limited use in cross-position and cross-era comparisons, TC/G is still a foreign statistic to the average baseball fan. Fielding average (FA) is the most comprehensive and widely used defensive statistic. It measures, roughly, a player’s success ratio in negotiating plays he should make with ordinary effort. As we know, because “ordinary effort” varies from player to player, FA can be a deceptive statistic: an agile, aggressive player may make an error on a ball a less mobile player would not reach or even try for. This may help explain, for example, why such outfielders as Willie Mays and Roberto Clemente never won a fielding average title but Greg Luzinski did.
Over a period of time, however, we will usually find that the players considered the most dominant at their positions consistently emerge among the fielding average leaders. It is not coincidence when a Brooks Robinson wins eleven FA titles, or Luis Aparicio eight. So, despite its flaws, FA is still the most useful statistic we have for measuring defensive performance at all positions, and the most practical one to apply toward a project of this kind.
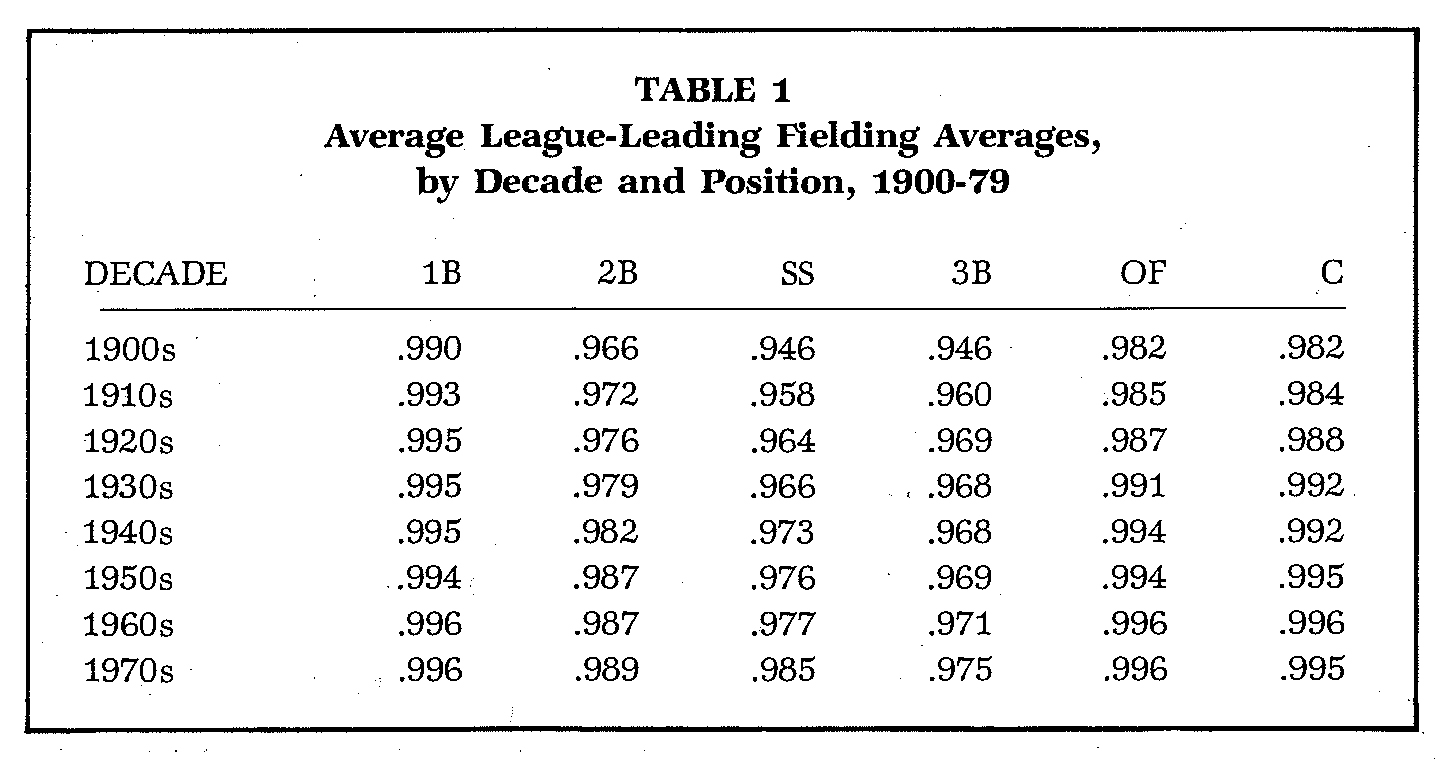
Cross-era comparison would appear to be a stumbling block with FA as well. In the first decade of this century, the average league leaders in FA at second base, shortstop, and third base had marks of .966, .946, and .946, respectively. By the 1970s, those figures were up to .989, .985, and .975. While overall batting and pitching performances have fluctuated with the times, only fielding average can claim a constant statistical improvement (although FA has been at a virtual plateau for 40 years). There are three basic reasons for this phenomenon: better athletes, better field conditions, and, especially, better equipment. The microscopic fielder’s mitts in use at the turn of the century were barely apt for keeping a hand warm, let alone snaring a vicious line drive.
How, then, to equate the FA of yesteryear with that of the present time? First, we have to determine how well a player stacks up against players of his own era. To compare against the average performances of an era tends to favor stars of lower levels of competition. In 1910, for example, Terry Turner’s .973 FA was over 4 percent higher than the .935 average of American League regular shortstops; to exceed 1982’s .969 league average by 4 percent, an A.L. shortstop would have needed an impossible 1.007 FA. A better method is to compare against the best performances of an era.
Borrowing a concept from Merritt Clifton’s Relative Baseball, a cross-era batting and pitching study, we’ll assume that “the player who tops all others in any given department for all practical purposes does the very best anyone possibly could under that year’s conditions, and his performance thus can be considered ‘perfect,’ the top end of the scale.”
Applying this to fielding averages, the player with the highest FA in a season, at a position, has achieved “statistical perfection,” or an effective Relative Fielding Average (RFA) of 1.000. We can calculate how close the other league players approach “perfection” by dividing their respective FA’s by the league leader’s. Over a player’s career, RFA works in the same way: his career FA divided by the average league-leading FA at his position during his career. Theoretically, the all-time best fielders at each position, regardless of era, will be those with RFA’s closest to 1.000.
Only seasons in which a player had a significant number of games (50 or more at a position) are considered in computing the RFA. Players must have at least 1,000 total games at a position during the computed seasons to qualify for the lifetime RFA leaders’ list. The generally accepted date of the beginning of the “modern era,” 1900, was chosen as the cutoff point for candidates.
In the course of the mammoth project, several trends developed. Although there is a pretty fair sampling of players from each era among the BFA leaders, the majority are “recent” players—i.e., of the last forty years or so. The probable reason for this is that there is a higher level of competition today-and this was especially true in the postwar, pre-expansion era (1946-60)-than in the earlier part of the century; thus, there’ are annually more players very close to the league leaders, our “statistical perfection” representatives.
If we define professional baseball candidates as “U.S. males age 20-39” and the number of major league players at a given time as 25 times the number of teams, we can plot the level of competition trends throughout baseball history. In 1901, about 3.2 men out of every 100,000 candidates were in the majors;by1983, that figure was only 1.7 out of 100,000, having reached a low of 1.4 in 1960. In effect, then, it is nearly twice as difficult to make the big leagues today as in 1901—contrary to the popu1ar impression—indicating there is a much higher level of competition. This doesn’t even take into account that in the old days many qualified players were not allowed or could not afford to play ball.
The leaders in RFA at the various positions did not have comparable marks as I had hoped; first basemen had, overall, the highest RFA’s, while outfielders had the lowest.
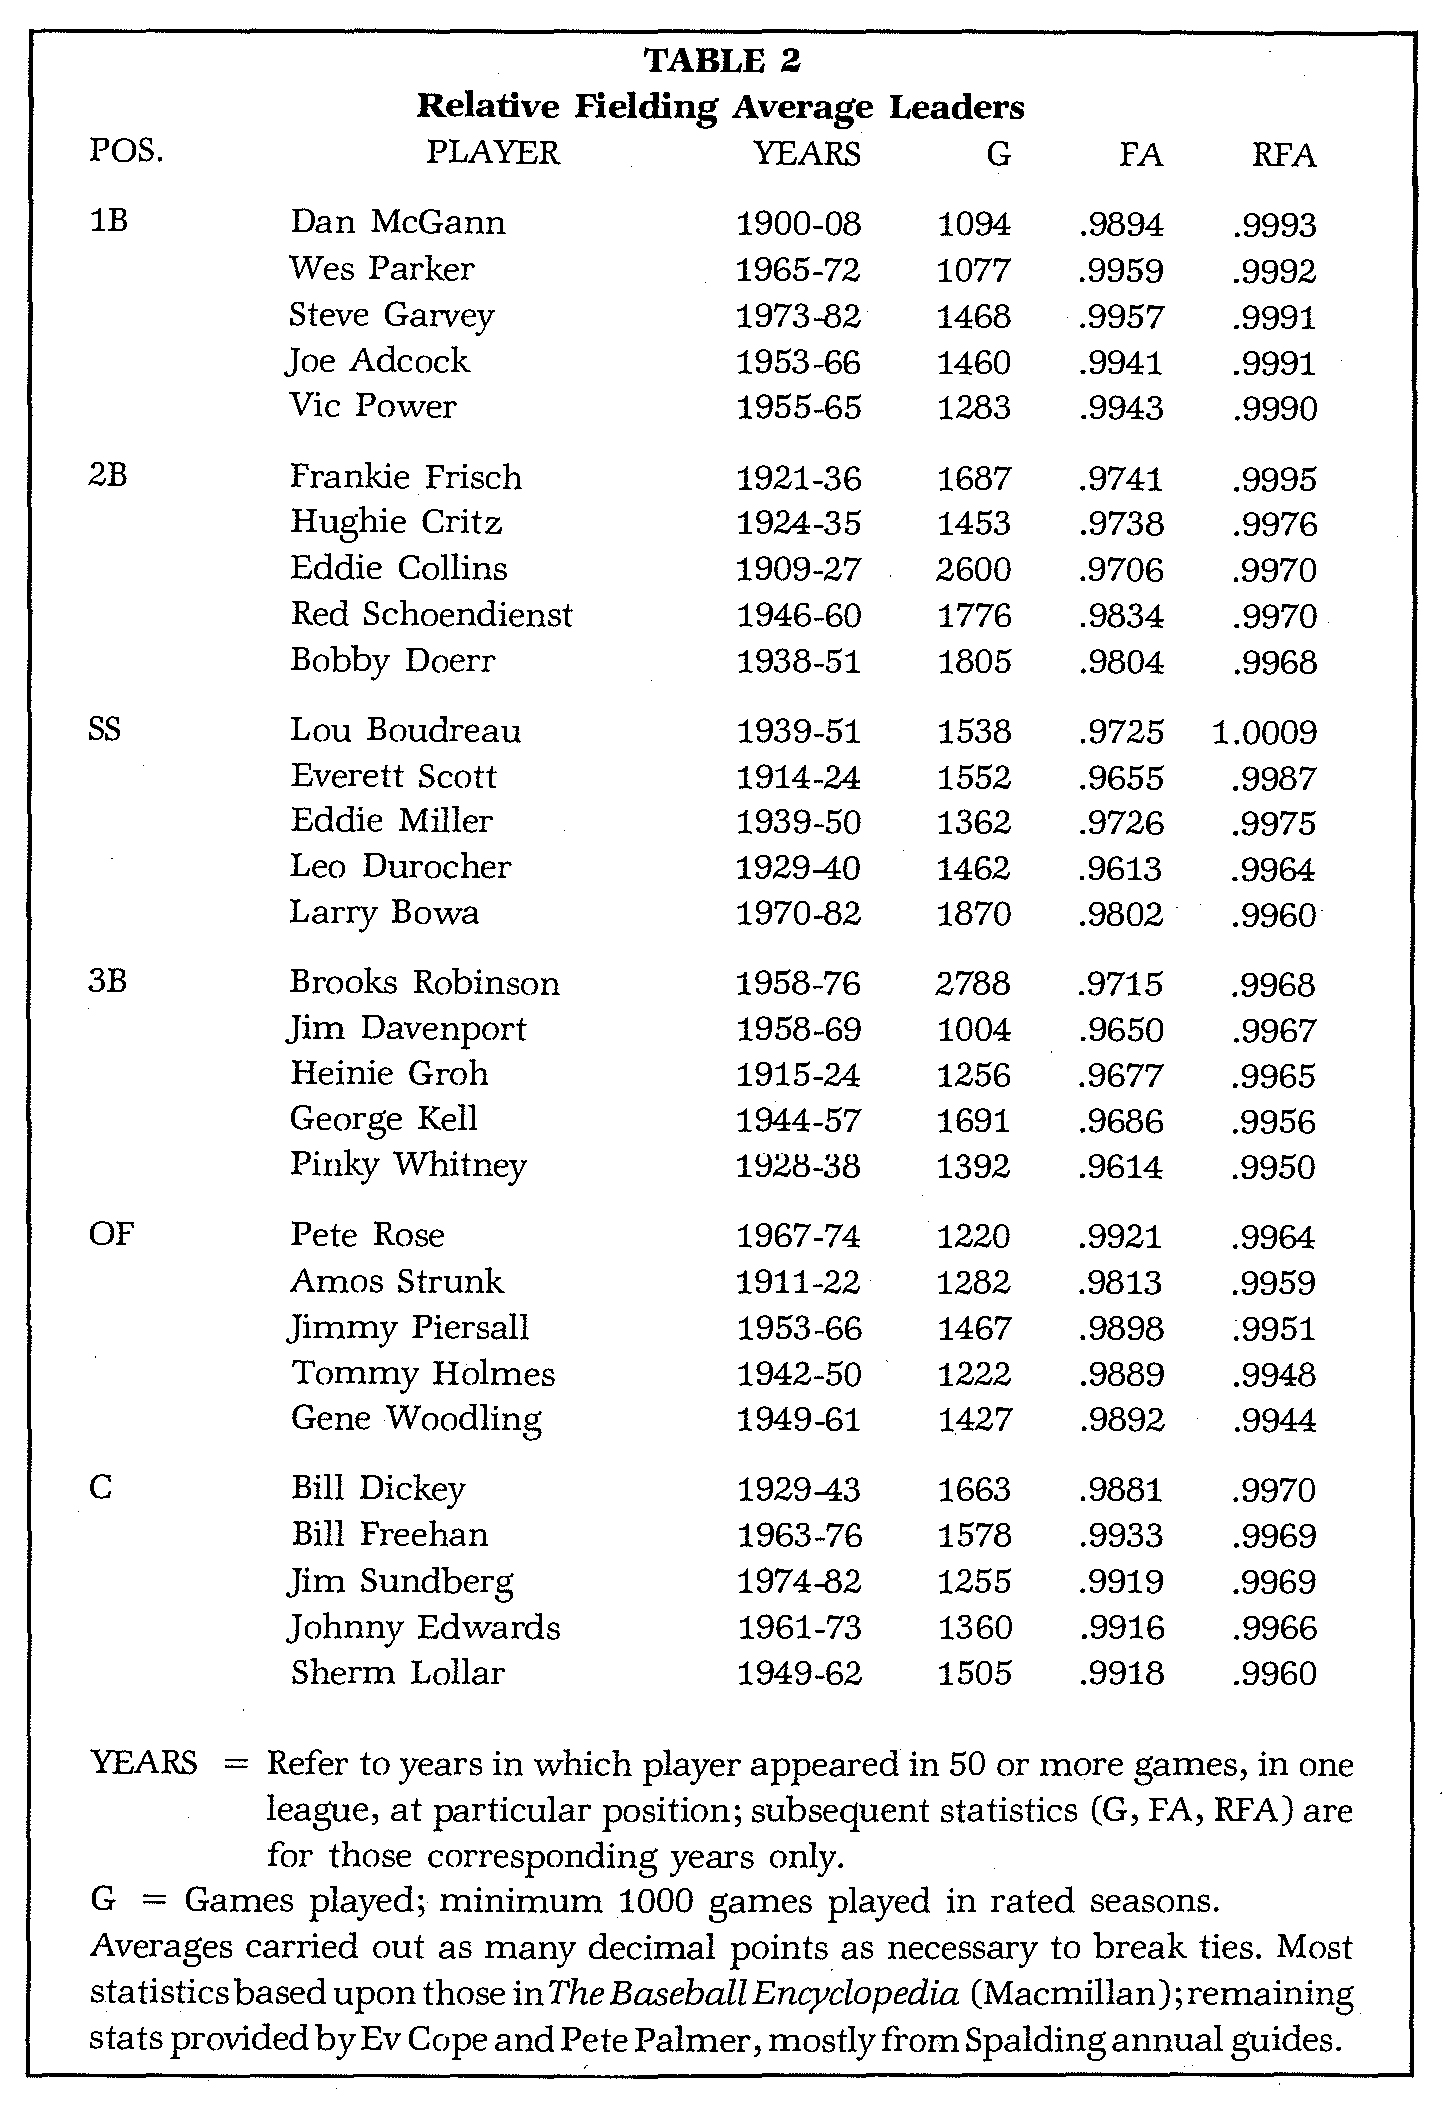
Table 2, at the end of this essay, shows the all-time top five players in RFA at each position.
First Base: Little-known Dan McGann, a turn-of-the-century glove wizard, leads all first-sackers with a near-perfect .9993 RFA. He is followed by Wes Parker (.9992) and Steve Garvey (.9991) who, along with Gil Hodges, give the Dodgers the distinction of having had three of the greatest defensive first basemen in baseball history. Joe Adcock (.9991) and Vic Power (.9990) round out the top five.
Second Base: Frankie Frisch comes nearest perfection at the keystone base with a brilliant .9995 mark. He’s followed by Hughie Critz (.9976), Eddie Collins (.9970), Red Schoendienst (.9970), and Bobby Doerr (.9968), who barely edged out Nellie Fox. Collins won nine fielding titles over three decades. Current star Bobby Grich ranks tenth.
Shortstop: Lou Boudreau attained the seemingly impossible with an RFA of higher than 1.000-to be exact, 1.0009. Boudreau led American League shortstops in FA in each of the eight seasons he played in the required 100 games. Additionally, Lou had five seasons in which he played between 50 and 99 games at short, in three of which his FA exceeded that of the league leader. This explains the over-1.000 anomaly which, while it points out a. basic weakness of the RFA method, also illustrates Boudreau’s superiority at shortstop during his era. Not gifted with exceptional range, Lou more than compensated with his instinct, smartness, and dexterity. Other high finishers at this position include Everett Scott (.9987), Eddie Miller (.9975), Leo Durocher (.9964), and Larry Bowa (.9960). Boudreau and Scott, like Luis Aparicio, each won eight fielding titles.
Third Base: Brooks Robinson reaffirmed his position as the best third baseman the game has ever seen, racking up a pace-setting .9968. Robby’s eleven fielding titles and sixteen Gold Glove Awards are unsurpassed by any player at any position. Backing up the “Human Vaccuum Cleaner” (if he needs it) areJim Davenport (.9967), who once played 97 consecutive errorless games at the hot corner; Heinie Groh (.9965), whose .983 FA in 1924 is, incredibly, still a National League record; George Kell (.9956), whose combined defensive and offensive excellence (seven fielding titles, nine .300 seasons) at last brought him into the Hall of Fame; and Pinky Whitney (.9950), who battled out Ken Reitz, Willie Kamm, and Willie Jones for the fifth spot.
Outfield: Pete Rose is not usually noted for his defensive play, but perhaps he should be. An All-Star at each of five positions left and right field, first, second, and third base), Rose has won fielding titles at four of these (nobody else has won at more than two). Cincinnati fans will remember his Gold Glove, nearly flawless play in the outfield between 1967 and 1974, where he made just 20 errors in 8 full seasons. Rose made up in surehandedness, aggressiveness, and defensive alertness what he may have lacked in speed or throwing strength. Among outfielders, he stands atop the all-time lists in both FA (.992) and RFA (.9964).
In second place is old-time fly-chaser Amos Strunk (.9959), whose five fielding titles are two more than any other outfielder in history. Defensive stars Jimmy Piersall (.9951), Tommy Holmes (.9948), and Gene Woodling (.9944) are next, with Jim Landis, Mickey Stanley, Amos Otis, Jim Busby, and Joe Rudi close behind. Holmes’ fourth place ranking is unusual in that he never won a title.
The outfielders popularly considered the best in history—Speaker, DiMaggio, Mays, et. al.—do not even approach the leaders list. Does their absence make a mockery of the RFA method? Or is it possible that the offensive prowess, natural grace, and dramatic flair of these players overshadowed the performances of the other defensive stars of their times?
Catcher: All-time great Bill Dickey leads the field in the closest race of any position. Dickey’s .9970 tops the RFA’s of modern maskmen Bill Freehan (.99691) and Jim Sundberg (.99687). Johnny Edwards (.9966) and Sherm Lollar (.9960) complete the list. Sundberg joins first baseman Garvey, shortstop Bowa, and former outfielder Rose as the only active players on the RFA leaders’ list.
Of the thirty players on this list, seven are Hall of Famers (counting Rose as a certain future member). Interestingly, five of these seven are the all-time RFA leaders at their respective positions: Frisch (2B), Boudreau (SS), Robinson (3B), Rose (OF), and Dickey (C). Eddie Collins and George Kell are the other Cooperstown occupants on the chart.
As I presumed all along, the RFA method is not foolproof; it is merely a first step toward effective cross-era comparison of fielders.
(Click image to enlarge)


