

The Bible and the Apocrypha
This article was written by Jon Bruschke
This article was published in Spring 2012 Baseball Research Journal
There can be little doubt that compared to pitching and hitting, fielding is the most vastly under-analyzed part of the game. There is very good reason to hope that the greatest advances in our understanding of the game through statistics will come in the area of fielding measures.
Take a moment and think about basic baseball statistics before the SABR era. The core batting and pitching measures invited improvement, but things like batting averages, earned run averages, home runs, RBIs, and win totals did give a meaningful overall picture of performance. Even without our many recent refinements, everyone could tell Bob Gibson was having a great season in 1968 and Roger Maris did something spectacular in 1961. It was not so with fielding; there was no number that could capture a great fielding season. Fielding percentage was certainly not up to the task. Recent developments have done much to undo this shortcoming, and this paper hopes to make an additional contribution toward this end.
There are two items on the agenda. The first section will be an assessment of extant fielding statistics. Special attention will be given to Dewan’s Saved Runs, Bill James’s Good Play/Misplay measures (both published in the Fielding Bible II), and my own system (published in Baseball Research Journal, volume 36). Second, a (somewhat) new approach will be offered, adding a few new measures to the lexicon. A close comparison of the new system with Dewan’s Saved Runs will reveal some interesting points about baseball fielding and its measurement.
CURRENT MEASURES OF FIELDING
Initial attempts to measure fielding (putouts and assists) evolved into more advanced metrics such as range factor. An inherent limitation of newer approaches was the absence of any information about where balls in play were actually going, and hence what true “chance” a fielder had to get to a batted ball. Thus zone ratings evolved, where the location of a batted ball is recorded (along with other information such as the speed of the hit and whether it was airborne). The Fielding Bible’s plus/minus system extends zone ratings, assigning values to the plays a defender does or doesn’t make in a certain zone. The “state” of the game (runners on and outs) is compared before and after the play; if the state after the play lowers the chances of a run being scored, credit is given. If the state after the play increases the likelihood of runs, demerits are handed out. Dewan offers this especially lucid explanation:
Let’s say there’s a man on first with one out. The expected runs at that point are .528. The next play is a groundball to the shortstop. He boots it for an error and we now have men on first and second with one out. The expected runs went from .528 to .919. That’s an increase of .391 (.919 minus .528) runs. The play itself, the error, cost the team .391 runs.[fn]John Dewan, The Fielding Bible, Volume II. Skokie, IL: ACTA Sports, 2009, 11.[/fn]
This explanation is not a full description of the system, but does usefully capture its basic nuts and bolts.
But the zone approach is also limited. Where the ball is “hit” to depends for some plays on the fielder. If a third baseman catches a line drive, the ball stays in the infield; otherwise, the ball lands in the outfield. Original positioning also matters; a third baseman fielding a ball on the right-field side of second base is doing nothing special if David Ortiz is at bat, since he begins the play ten feet from the bag. Zone ratings are, thus, increasingly accurate estimates of the number of good or bad plays made, but they remain estimates.
The only way to make an estimate entirely accurate is to replace it with a measured observation. Several “advanced” statistics, such as those on the Baseball-Reference.com website, take observable events and codify them. The number of times a runner advances on an outfielder, for example, can be recorded, as can participation in double plays. These measures provide rich new data and can often, by themselves, yield new insights.
But these more fine-grained observations do not exhaust what might be known about fielding. James and Dewan have two additional categories of observations. The first is to replace the concept of an error with a “defensive misplay” (or DME). A misplay is a “narrowly defined event” which recognizes an on-field event (such as a second baseman bobbling a ball that causes him to miss a double play opportunity) that puts the defense at a disadvantage. There are 58 of them, and they are carefully defined to minimize subjective scorer judgment.
My own counterpart to the misplay was the “Difficult Play Not Made,” or DNM. I do believe that these concepts actually measure two distinct and important parts of fielding. The Bible’s DME is a significant event not captured in the existing category of “error” but which represents a play that should have been made. Good defenders do not simply avoid bad plays, they make good ones.
But while James correctly notes that counting good plays is a matter of common decency, it is not enough to count the number of good plays by a defender. What about counting the number of playable balls that are not converted to outs? To do otherwise would be like counting the number of key hits without also counting the number of at-bats in pressure situations. Without knowing the number of difficult plays not made, it is impossible to calculate a percentage of difficult plays converted into outs.[fn]Although my point is not to be evaluative, the differences between the measures are worth noting. First, the DME is more objective, although in my prior article I took pains to address the subjectivity issue. In a nutshell, subjective judgments can be made with a good deal of reliability. There are well-known methods to determine whether a subjective judgment can be made accurately. The DNM passes those tests. Second, James’ DME covers a much wider range of activity on the field, whereas the DNM only covers the initial play.[/fn]
My current state of thinking, then, identifies three new directly observable categories of defensive failure: (a) the error (a botched routine play), (b) the DME (additional plays that disadvantage the defense without being errors), and (c) the DNM (un-converted opportunities to make an outstanding play).
On the other side of the ledger are the positive things a fielder can do. James calls such an instance a “good play,” defined as “a play made when it appears most likely that it cannot be made” (a “GFP” in James’ parlance). James notes that it is not “almost entirely objective,” as the DME is. There are 27 defined Good Plays. My counterpart was the “hit saving play” (HSP).
The GFP and HSP concepts are largely similar, though they differ in meaningful ways. First, the HSP relies on an established definition of a hit, and although it is undoubtedly more subjective than the GFP, it requires the scorer to ask only this question: “Had that play not been converted into an out, would I have ruled it a hit?” The GFP includes a wider range of field activity, while the HSP is only concerned with the initial stop of the ball.[fn]The reliability of the HSP measure, like that of the DNM, has been demonstrated (and is included in my prior article).[/fn]
My reading of James’s description of the GFP makes it seem like the HSP might usefully serve as an umbrella for several GFP categories concerning the initial stop of the ball, while the GFP categories that involve other plays might remain distinct.
It all adds up to this picture of the state of fielding statistics: Zone approaches are giving increasingly accurate estimates of good and bad plays. New schemes are being created to make direct observations about whether a play is good or bad and its net effect on scoring outcomes. What prevents the widespread inclusion of these new measures in an impressive new host of statistics?
In a word, labor. To code 54 “bad” and 27 “good” types of plays requires that every game be re-watched and re-scored. People have to be trained to use the system correctly. At present, the amount of labor makes James’s scheme valuable enough to be proprietary, and all the categories—much less the raw data—have not been published. My HSP/DNM scheme is somewhat easier to incorporate and disseminate; the categories could even be easily added to the official scoring of the game, though they still require observations of every batted ball in play. The zone scoring schemes are similarly work-intensive (although they are relatively easy to find in published, aggregate form).
The measurement of all these elements will make possible the Holy Grail of fielding statistics: a unified measure (by position) cataloging all that a player has done, good or bad, and matching those actions against theoretical or actual game outcomes. But the day when all such data are available for a central analysis is not especially close, and in the meantime we have a number of pretty good measures which evaluate different performances for different positions in better and worse ways. Studenmund’s advice that it is best to avoid a “one stat fits all mentality” is sage. Viewing players through a series of different measures can yield a decent overall picture.[fn]The Fielding Bible, Volume II. Ibid, 351.[/fn]
In the meantime, might it be possible to obtain meaningful measures of fielding without the labor intensity of direct observation or advanced zone schemes? Can we add to the mix another fairly meaningful measure of fielding prowess which uses some more readily accessible data? The answer to that question occupies the rest of this paper.
FIELDING SHARES: REASONING BACKWARDS
I began my thinking with two premises. The first, an empirical point proven by Voros McCracken, is that once a ball is in play the pitcher has very little influence on the outcome of the at-bat.[fn]McCracken, Voros, “Pitching and defense: How much control do hurlers have?” www.baseballprospectus.com/article.php?articleid=878, January 23, 2001.[/fn] It was not a finding McCracken expected and he made painstaking efforts to disprove the conclusion. At the end of his analysis McCracken believed the pitcher’s influence dropped to almost nothing after the ball made it to the field of play. Others might find a link between a batting average on balls in play (BABIP) and fielding-independent hitting statistics (FIPS, usually BB, HR, and K). Regardless of the exact relationship between FIPS and BABIP, however, McCracken’s work demonstrates that fielding matters quite a bit.
The second premise, which builds on the first, is that while no airtight measures of individual fielding exist, there are excellent measures of team fielding. The first “team” measure is simply the batting average of balls in play (BABIP). A team with a lower BABIP does a better job of converting batted balls into outs than a team with a higher BABIP.
A second measure is runs allowed after accounting for Fielding-Independent Pitching statistics. It is possible to run regression equations to produce a predicted number of runs one would expect to be allowed given a particular pitching performance. A higher number than predicted means bad fielding, and a lower number than predicted means good fielding. This total—the actual minus predicted runs per game—is called a residual, labeled here “RPG-residual.”
My new thought was this: zones, HSP/DNM, and DME/GFP schemes all take individual events on the field and attempt to link them to valuable outcomes such as runs allowed or wins. What would happen if we worked backwards, taking our very good outcomes measures of team fielding (BABIP and RPG-residuals) and linking them back to individual activity? The rest of this paper explores this idea.
First, a couple of explanatory notes. This system uses the same logic that Bill James used for fielding Win Shares: Each individual player gets a portion of that team’s overall performance based on the number of outs they account for. Worded slightly differently, one starts by counting the number of a team’s runs or hits over (or below) average, and then tries to figure out which players are most responsible for the better (or worse) team fielding performance. If, for example, you have 100 points to give out and player A has accounted for 20 outs on defense but player B has accounted for only 10, player A gets twice the number of points. This system has many differences from Win Shares, but the core logic is the same, and the guts of the system involve tallying how many outs a player accounts for (roughly, putouts plus assists; more detail to follow) and dividing that figure by a number that meaningfully reflects a team’s fielding performance.[fn]Unlike Win Shares, this system does not attempt to balance the different contributions of pitching and fielding to runs allowed or limit how much (or little) pitching can account for. Instead, it tries to remove the effect of pitching—focusing solely on fielding—then empirically link the result to team win percentage. A further difference is how outs are credited; the system here is much simpler and mostly counts only assists and unassisted putouts.[/fn] The only other conceptual building block to be aware of is that while a bad team might have only 100 points to dish out, an average team might have 150–180 and a good team more than 250.
Compared to the more common fielding measures out there (mostly zone systems), this approach isn’t so much an advance as a different approach to the same thing that makes different choices about what to estimate. UZR starts by counting how many outs a player produces in their zone, then tries to figure out how many hits or runs those outs are worth. The system proposed here starts with how many hits or runs a team allowed and then tries to figure out who was most responsible for them. Both zone systems and this one estimate fielding performance but come from very different starting points. In a nutshell, zone approaches carefully measure individual performance, but estimate productivity. My approach measures productivity directly but estimates individual performance.
On to the details. Three tasks are at hand. First, to build a unified measure of team fielding. Second, to apportion credit to individual fielders. Third, to compare the results to existing measures.
BUILDING A MEASURE OF TEAM FIELDING
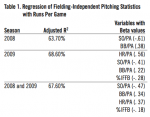 Taking team pitching statistics from Baseball-Reference.com for 2008 and 2009, I ran a regression with runs per game as the criterion variable and HR/PA, BB/PA, SO/PA, and percentage of batted balls that were infield fly balls as the predictor variables.[fn]Although the denominators are different the regression method used here can readily accommodate the difference of scales. For example, it is possible to regress OPS (where at-bats is the denominator) onto runs per game (where runs are the denominator).[/fn] (Infield fly balls are included as fielding-independent because the out recorded usually requires minimal fielding effort.) The results, reported in Table 1, show that pitching accounts for 64–69% of runs scored (the remaining 30% or so is most likely due to the quality of fielding play).[fn]Another possibility is that “clutch” pitching might explain the remaining variance. Since the existence of clutch hitting is such an open question, and Dewan shies away from naming such a thing as clutch fielding, the issue is probably one for future research. Fielding certainly explains a large part of the remaining variance in Table 1.[/fn]
The RPG-residuals for the combined data correlated highly with both the residuals for 2008 alone (r=.87) and 2009 alone (r=.96). Because more data are generally better, the equations built on the combined 2008 and 2009 data were used for the rest of the analysis. The RPG-residual correlated with BABIP (r=.64); this high but not singular correlation indicates that these metrics both measure the same basic phenomena but contribute independent information.
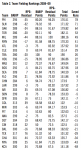 The two measures were combined into a single index by taking each team’s percentile score and then multiplying by 50 and adding a base of 50. Thus, for BABIP and RPG-residual, each team could earn a minimum of 50 points and a maximum of 100. By summing the scores for each measure, teams could have a minimum of 100 and a maximum of 200 points. The results are included in Table 2; the Saved Runs from the Fielding Bible II are included for comparison. The bottom-line column is titled “Total Points,” and it is the combined score based on the two different measures of team fielding.
ASSIGNING FIELDING SHARES
Taking the logic of BABIP, if a team does a better job of converting balls in play to outs, the simplest way to assess fielding quality is to determine who is responsible for those outs. I divided each out according to a single formula. Only outs recorded on balls in play were included (i.e., strikeouts were excluded). If an out was unassisted, the fielder recording the putout was credited with the out. If an out was assisted, the number of players involved in the assist were each given an equal out share; two assisters received .5 each, three assisters received .3 each, etc. (the putout is not credited if an assist occurs on the play). The data were obtained from the 2008 Retrosheet.org data files and each play was parsed with the BEvent program.[fn]The retrosheet.org resource can’t receive enough thanks; I add mine now, and especially to Tom Tippett, David Nichols, and David W. Smith, the authors of BEvent.[/fn] The data were then summed with software of my own creation and validated by comparing out share totals for each team to its innings times three, minus strikeout totals (roughly the number of outs on balls in play, with slight variation due to the fact that not all strikeouts produce outs).
This approach assumes all fielders have the same number of fielding opportunities, an assumption that might not hold and one that future refinements might address. Even in its current form, however, this metric does assess total productivity. An analogy to RBI is apt. If one simply compares RBI totals, or even RBI per AB, the comparison assumes that all players have an equal number of RBI opportunities. They do not, and adjustments could be made for the number of runners on base, in scoring position, on third with fewer than two outs, and so on. But raw RBI totals do capture the total amount of productivity irrespective of opportunity, and having an equivalent for fielding measures would be quite an advance.
Each player’s out share total was then converted to a percentage of all outs recorded in the field by their team. For example, if a team records 3,204 outs in the field and a given player has 398 shares, the individual’s percentage of outs in play is 398 divided by 3,204, or 12.4%. That percentage is then multiplied by the team fielding share points (see Table 2); a player responsible for 12.4% of the outs on a team with 153 fielding share points receives a final score of 19.01.
Final Fielding Share scores are obviously biased toward those with more playing time. This is not unwarranted; a player logging more time and recording more outs on a good fielding team should be rewarded. But counting total fielding shares without adjusting for playing time is like counting hits without calculating batting average. Playing-time adjustments may be even more important on fielding than offense; a good hitter will generally get his at-bats, but a good fielder who can’t hit will have a much harder time cracking the lineup. Finding measures to uncover the performance for players with limited time is well worth the while. To adjust for playing time, Fielding Shares were divided by the number of plate appearances for which a defender was in the field while a ball was put in play (PABIP).
ANALYSIS AND RESULTS: SYSTEM COMPARISONS
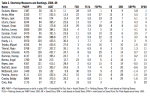 Because James’s Good Play/Misplay system is proprietary and therefore not fully published, comparisons to it are not possible, though some tidbits based on the partial figures that are published in the Fielding Bible II can allow comparisons that illuminate some other mysteries. Comparing Fielding Shares to Dewan’s Saved Runs, however, yields important points. A good starting place is a detailed analysis of shortstops; Table 3 displays the data. Included are Saved Run and Fielding Share totals, as well as each measure divided by plate appearances with balls in play (SRPPA and FSPPA). All shortstops with 1,000 or more PABIPs in 2008 who were ranked in the top ten in Saved Runs (taken from Fielding Bible II), Fielding Shares, or FSPAA are included. SRPPA were calculated for all players in the Table; SRPPA ranks, therefore, did not include players who might have had better scores but were not published in the Fielding Bible analysis. All other rankings are compared against the 40 shortstops with 1,000+ PABIP.
Comparing the systems leads to interesting observations. Six players (Rollins, Escobar, Hardy, Theriot, Tejada, and Berroa) ranked very similarly among the different systems, while five rate quite differently (Crosby, Aviles, Vizquel, Wilson, and Cora). Most interesting is a group of four players with different Saved Run and Fielding Share totals but nearly identical SRPPA and FSPPA ranks (Izturis, Scutaro, Reyes, and Peralta; only Guzman and Cabrera had raw total ranks closer than their PABIP-adjusted ranks). The fact that playing-time adjusted measures reveal more similarity between the systems suggests that each measure may be assessing the same core performance, and that each system is capable of evaluating fielding productivity in relation to playing time.
Additional evidence for the validity of the Fielding Shares scheme is that the total fielding point totals presented in Table 2 have a significant correlation with team wins (r=.44, p=.013) while saved runs do not (r=.185, p=.33). Thus 19.4% of a team’s wins can be explained by their fielding shares scores (r2; recall that this is a composite measure of BABIP and RPG-residual).
This is an important point that bears repeating: Fielding point totals do correlate with team win percentage while team Saved Run totals do not. This point alone suggests that the team-to-individual-performance estimation approach proffered here deserves serious consideration.
Where the rankings do differ, it is probably the case that the “better” ranking is the most accurate. Consider Aviles, ranked 22nd in fielding shares and 27th in FSPPA. He produced a mid-range number of UPO and assists on a bad fielding team. But he was third in Saved Runs, and bumped up to second in SRPPA. What gives?
The Saved Run rankings are only possible if Aviles converted more balls to outs than average and/or created those outs in situations which tended to save more runs. In addition, Aviles ranks in four of James’s categories: Net Good Plays minus Misplays per touch (sixth), net grounders (third), net flies and liners (fourth), and net double plays (fourth). On the negative side of the ledger, he was also fifth in Misplays on throws, suggesting that his true ranking might not be as high as second. Still, the Fielding Share rankings probably underestimate his performance, and the higher Saved Run rankings better reflect his true fielding productivity.
The same might be said for Jack Wilson, loved by Saved Runs and hated by Fielding Shares. Wilson was the third most productive out producer on a mediocre fielding team; second baseman Freddy Sanchez and center fielder Nate McLouth both out-performed him. In this case, a decent defender might simply have been crowded out of Fielding Shares by outstanding teammates. According to James, Wilson was third in net good minus bad plays, fourth in net per touch, and sixth in double plays. In sum, Wilson’s actual ranking is undoubtedly higher than 33rd.
It cuts the other way with good Fielding Share rankings. Jason Bartlett is ranked 20th in Saved Runs and 16th in SRPPA. James gave him the fourth most Misplays per touch. But his Fielding Share total ranks him ninth and fourth. Why the high Fielding Share ranking? Bartlett accounted for the second most outs on a team whose fielding ranked first overall and first in BABIP, with a RPG-residual of 20 runs (saved .2 runs per game beyond what pitching could explain), and even in the Saved Run team totals saving 20 runs in 2008 (ranking ninth overall). Is it really possible for his team to perform that well with its second most active out producer costing his team two runs a year? Were his teammates really covering that much for the subpar play of the starting shortstop? Probably not.
A more plausible explanation is that the Fielding Share rankings are capturing something about Bartlett’s play that Saved Runs are not, or at the very least that the Saved Run rankings underestimate Bartlett’s contribution.
A final observation about the systems can be made without resorting to the data. Fielding Shares probably under-reward good defenders on bad fielding teams. No matter how good you are, it is difficult to gain a large enough proportion of a team’s outs to offset the lower overall Fielding Share total to go around. Conversely, Saved Runs may over-reward mediocre players on bad teams. Because bad teams typically have more run-laden situations (or “states”)—they more frequently have the bases loaded with no outs, for example—the same fielding plays “save” more runs and earn more credit.
I take home two points from this case study of shortstops. (1) The overall rankings, especially those adjusted for playing time, are close enough to suggest that each system has validity but is different enough to remind us that both are estimates, not precise counts of good and bad plays. (2) Where discrepancies exist, the better ranking is probably more accurate, or at least suggests that an upward correction is in order. To restate the point made earlier, Saved Runs and Fielding Shares both seek to estimate good plays and bad plays and their contributions to runs saved or lost; neither is as accurate as counting good and bad plays directly, as James does. But each is less labor intensive. Until exact counts are published in a full form, comparing different systems that estimate performance (including these and, at least, Ultimate Zone Ratings and the Total Run counts on the Baseball-Reference.com website) is highly productive and certainly far more revealing than Gold Glove vote totals.
ANALYSIS AND RESULTS: PLAYER PERFORMANCE
Table 3 also reveals interesting things about individual performance, particularly for Scutaro, Rollins, and Crosby. Perhaps the most revealing point is that Marco Scutaro is a consensus pick for the best fielder per-PABIP. Although ranked ninth in Saved Runs and a very low 28th in Fielding Shares, his per-PABIP numbers rank him first in both categories. By all accounts, his time on defense was strikingly productive.
Jimmy Rollins is definitively in the upper echelon at his position, but he may not be the best. His Saved Runs per PABIP drops him from first to sixth, while his Fielding Shares rank fourth and fifth. On par with that performance is J.J. Hardy, tied with Rollins in cumulative ranks across the four categories. Sometimes a best player emerges at a position; sometime it’s a toss-up between multiple contenders. In 2008, Hardy and Rollins ran a two-horse race for best defensive shortstop.
 Bobby Crosby is better than expected. He ranks low in Saved Runs, but his PABIP-adjusted totals shoot him up ten ranks, and his Fielding Share totals put him around the bottom of the top ten. As argued above, the better ranking is probably more accurate; he was contributing a large share of the outs on a team that both the Fielding Bible II and this paper have identified as the third-best fielding team. The reasoning is somewhat backward, but it is hard to imagine a team producing the third best overall fielding with the 29th best shortstop. It is worth noting that his Total Runs reported by the Baseball-Reference.com website are .6 (modest but respectable) and better than the -6 Saved Runs assigned by Dewan. Crosby emerges as a player of midrange major-league productivity, and not the liability his Saved Run figure suggests.
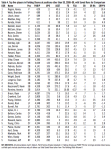
Table 4 lists the top five players at the other positions. It is hoped that readers will find a rich set of comparisons in that data.[fn]A full set of searchable results is at http://commfaculty.fullerton.edu/jbruschke/baseball.htm.[/fn]
CONCLUSIONS
The best way to assess fielding is to count the good and bad outcomes of a touch of the ball. This is, at present, too labor-intensive. The alternative is to estimate fielding productivity. One way to make these estimations is with advanced zone schemes. Another way, suggested here, is to apportion known and meaningful team fielding performances to each fielder.
Looking forward, there are three general directions for research on fielding.
The first is to decide what to count. Everyone agrees that counting errors, assists, and putouts is wholly insufficient. Extensive efforts are underway to code the zones where balls land and how balls get there. This paper suggests four useful new categories of information to track. First, those plays on the initial stop of a ball that prevent what would otherwise be scored as a hit. Second, those plays after the initial stop of the ball that advantage the defense. Third, those misplays that James has identified, which include a much more appropriate range of bad play than the current category of errors. Fourth, those difficult plays that are not made which arguably separate the good from the bad fielders as much as the misplays. At present no scheme, James’s included, captures all this information.
A second direction is to identify how to assess the different demands of different positions. The catcher, in particular, has a number of measures unique to that spot on the field, including wild pitches allowed, passed balls, runners held, runners thrown out, potential wild pitches blocked (stops on balls in the dirt), unforced putouts at the plate (in chances to do so), etc. The first baseman is usually the least “important” fielder on the team, but still must dig balls out of the dirt, tag runners when throws pull him off the bag, and convert difficult-to-field balls into outs. The pitcher is the fielder closest to the batter; the demands on that position are generally not captured in measures appropriate for other positions.
Third, this approach could be refined and integrated with other systems. As noted earlier, the Fielding Shares utilized here are raw productivity totals, much like a seasonal RBI sum. They could be adjusted in a number of ways to better account for the true number of chances a fielder had. Adding elements like the number of ground balls to fly balls, the number of right- or left-handed pitchers, etc., would certainly refine the PABIP adjustments used here. Further, the analysis here is based on only two years’ worth of data; the sample size is adequate for the conclusions offered above but is only a sliver of the information available. Team performances could be based on more than RPG-residual and BABIP, but could also integrate team Saved Runs, team UZR, the Total Zone ratings from Baseball-Reference, or the summed player totals from Michael Humphreys’ Wizardry. Comparison and contrasts of the different systems, and perhaps even a super-measure of team fielding, would add to what is offered here.
I am repeatedly struck by how much of the information with which to assess fielding is already codified in places like Baseball-Reference’s advanced fielding statistics. If we wished to take the catching position, for example, and toss aside the current and wholly inadequate measures of defense (fielding percentage) and replace them with richer information such as runner kills, percentage of bunts fielded converted to outs, runner bases added, and the like, this could be accomplished right now with no additional collection of information.
The purpose of SABR is “to encourage the study of baseball.” There can be little doubt that compared to pitching and hitting, fielding is the most vastly under-analyzed part of the game. Despite this, it is vitally important to do so. My own estimates lead me to conclude that somewhere between 20 and 33 percent of variance in team win percentage is due to fielding. There is very good reason to hope that the greatest advances in our understanding of the game through statistics will come in the area of fielding measures.
JON BRUSCHKE is a professor at baseball powerhouse CSU Fullerton and is the webmaster for the DebateResults.com and asfbl.com websites. He appeared in the Emmy-nominated documentary Resolved. His first contribution to the “Baseball Research Journal” came in 2007, and he has an ongoing interest in measuring the impact of fielding on game results.