
The Deadball Era’s Worst Pitching Staff
This article was written by Tom Ruane
This article was published in Fall 2009 Baseball Research Journal
At first I thought it was a misprint. Right in the middle of the Deadball Era — the years of the Hitless Wonders, small ball and Bill Bergen — the 1911 Boston Nationals’ pitchers allowed 1,021 runs scored.1 Even for 1911, the high-water mark for offense in that era, it was a phenomenal number of runs. Look at it this way: No other team from 1901 to 1919 scored or allowed even 900 runs, and this would remain the twentieth-century record for most runs allowed in a season until 1929. In other words, this record would stand until the very end of a decade famous for its offense.
So how did this happen? How did a team in the middle of an era known for its dearth of hitting give up so many runs? Usually, they result from a combination of three factors: bad pitchers, a hitter-friendly park, and some changes to the game or equipment favorable to offense. Let’s take the last one first. The first edition of the Macmillan Baseball Encyclopedia contained a wonderful series of charts right at the beginning, in a chapter entitled “Baseball: The Changing Game.”2 One of the charts showed the runs per game through the years and had a small spike centered around 1911. It would have been an offensive drought during the 1920s, but for the times it caused quite a bit of comment. A lively ball introduced that season was blamed on the increase in scoring. The following excerpt from a postseason article in the Chicago Tribune was typical:
The lively ball introduced into baseball this year revealed itself more forcibly than in any other way in the quantity of so-called slugging matches which occurred during the championship season. Taking fifteen hits by one team in a single game as a basis for comparison, there were almost twice as many swatfests in the National League in 1911 as there were the year before.
Fifteen or more hits were piled up in the present year in seventy-four National league games, while the record for 1910 showed only thirtynine games in which one team made that many swats.3
One weird thing about this offensive increase in the National League: It was entirely accounted for by Boston pitchers and hitters. Here are the runs scored in the National League in the two years:
Table 1
|
Year |
G |
R |
R/G |
|
1910 |
621 |
5,004 |
8.06 |
|
1911 |
623 |
5,506 |
8.84 |
That’s a 10 percent increase in scoring from one year to the next. Here is the same chart with Boston’s games removed:
Table 2
|
Year |
G |
R |
R/G |
|
1910 |
464 |
3,808 |
8.21 |
|
1911 |
467 |
3,786 |
8.11 |
Oh, and of those 74 15-hit games the Chicago Tribune writer noted, 40 involved Boston, including the largest offensive explosion of the year, a 26–3 rout of Boston at the hands of the Cincinnati Reds on June 4.
In the American League, it was a different story, with a scoring increase of more than 20 percent spread across the league. The reason for the increase in the junior circuit is less clear.
So what about the ballpark? Boston in 1911 played in South End Grounds. Actually, they played in the third incarnation of the South End Grounds. The previous version, nicknamed the “Grand Pavilion,” had burned down on May 15, 1894, and a somewhat less grand replacement was built in only ten weeks. By 1911, it had short fences down both lines (250 feet in left field and 255 in right) but was relatively deep in center.
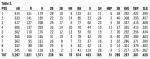
The short fences were probably why there were almost twice as many homers hit in Boston’s home games that year. The park also had an effect on doubles and triples but almost no effect on anything else. Here are the combined records of Boston and their opponents at South End Park and elsewhere that year:
Table 3.
AB R H 2B 3B HR BB AVG SLG Home 5,305 925 1,495 272 51 75 613 .282 .395
Away 5,312 793 1,492 218 97 38 619 .281 .380
So they did score and allow more runs at South End Park, which is what we expected, but their games were high-scoring in the other parks as well. The 485 runs they allowed on the road were more than any twentieth-century team would allow until 1930.
Which brings us to their pitchers. Despite the turmoil (featuring a drawn-out sale of the club and the installation of a new manager) surrounding the franchise just prior to the 1911 season, the core of Boston’s pitching staff was intact from the year before, when four of their starting pitchers had each thrown more than 250 innings.
Al Mattern was the staff ace, having led the team in both wins and innings pitched the previous two seasons. There were off-season rumors that had him going to either the Cubs or the Reds in a trade, but they came to nothing.4 Buster Brown, their numbertwo starter despite 23 losses the year before, was the Boston pitcher to allow the fewest runs per nine innings. Sam Frock had been picked up in a trade with the Pirates the previous April and ended up winning 12 games and finishing third in the league with 171 strikeouts. Rounding out the quartet was Cliff Curtis, the weakest link in the group. Curtis led the team in runs allowed, walks, and losses, finishing with a 6–24 record and a 3.55 ERA. He dropped his twenty-third consecutive decision on May 22 and was 1–8 (on a pace to lose 26 games) when he was sent to the Cubs.
None of the four was either particularly young or old, ranging in age from 27 (Mattern) to 29 (Brown and Curtis), and there was little reason to suspect that none of the four would come close to repeating his previous season’s performance.
A lot had been expected of Cecil Ferguson, the only other Boston pitcher to see significant action in 1910. He had managed a 7–7 record, including five wins in September and October, and during the offseason had successfully petitioned the National Commission to receive a $500 bonus promised to him if he succeeded in winning most of his games.5 The appeal hinged on whether two of his victories in exhibition games should count. He argued that they should and the Commission agreed, no doubt causing owners everywhere to be more careful with the language of bonus agreements in the future. Cecil then decided to hold out and had yet to sign a contract by the start of the season.6 This is pure speculation, but it wouldn’t be too surprising if the owners had simply subtracted the $500 bonus from his 1911 salary.
The main newcomers were 21-year-old Lefty Tyler, who had pitched decently in two late-season relief appearances the year before, and Big Jeff Pfeffer, a veteran obtained from the Cubs in a February trade. This was Pfeffer’s second stint with the team; back in 1906, he had been one of four Boston pitchers to lose 20 or more games, duplicating the feat of the previous year’s staff and marking the only two times in major-league history that a team has had a quartet of 20-game losers. The team that came closest since then? You guessed it — the 1910 Nationals, with Mattern, Brown, Frock, and Curtis all losing at least 19 games.
The season started deceptively well, with Buster Brown beating Brooklyn 2–1 on opening day. Unfortunately, his second victory would not come until August. Mattern and Tyler were knocked out early in the next two games, the latter featuring 15 Brooklyn runs and 6 stolen bases, before Curtis, because of a sore shoulder, was forced to leave his first start of the year after only one inning.7 The Phillies scored 10 runs in each of the next two games, knocking out Frock and Mattern, and the swatfest was on. Before the season was over, Boston pitchers would give up 10 or more runs in a game 32 times.
One early-season surprise was the pitching of Pfeffer, whose repertoire included what one Boston Globe writer called “annoying slow balls.”8 He replaced Curtis in the rotation for a while. Pfeffer pitched Boston’s first shutout of the year on April 24 and ran his record to 5–0 with a complete-game victory on May 8. After that, the league appears to have figured him out. Two bad starts in a row got him dropped from the rotation, and over the rest of the season he would allow more than a run an inning.
Brown began a 14-game losing streak after his opening-day victory, and Mattern ended up getting dropped from the rotation in early July with a 4–10 record. He pitched ineffectively out of the bullpen the rest of the year, making only an occasional start, and would not win another game in his major-league career.
Frock lost his job as a starter after allowing 10 runs in a complete-game loss to the Phillies and was sold to the Atlanta Crackers in early May. He would pitch in the minor leagues until 1918 and would not appear again in the majors. Curtis recovered from his sore shoulder and was back in the starting rotation within a month but was also ineffective. He was 1–8 and on a pace to lose 26 games when he was sent to the Cubs in an eight-player trade in June.9 And finally, Cecil Ferguson didn’t sign a contract until late May.10 Once he reported, he pitched briefly and badly and was traded to Memphis of the Southern Association at the end of July.
In short, the five pitchers who had combined for 146 starts in 1910 all pitched much worse the next year. Table 4 shows their combined lines.
Their collapse opened the door for a host of new faces, and before the end of the season 16 different pitchers would start at least one game for the team. Lefty Tyler was the first to get a shot, but he didn’t pitch well early and was used sparingly until July. Between May 27 and July 5, he pitched in only one game, in a mop-up role in a 20–2 loss to the Cubs on June 11. By early August, he sported a 1–8 record and had allowed 79 runs in 74 innings.
Other newcomers included Orlie Weaver and Hub Perdue. Weaver, who came over from Chicago in the Curtis trade, had shown some promise in Chicago but didn’t do well after the trade and was 2–12 by the time he was dropped from the rotation at the end of August. On October 9, he was given one last start and pitched a complete-game victory. It would be his last majorleague appearance.
Perdue was a 28-year-old rookie who was added to the roster after going 12–17 with Nashville of the Southern Association the year before. He pitched well in his first start with Boston before being forced to leave with arm problems.11 He underwent electric treatments for a month before having a bone splinter removed in late May. Despite being a little overmatched in the majors, Perdue managed to stay in the rotation after recovering from his arm troubles and even had a winning record for a while before fading over the last six weeks of the season.
The team reached its low point on August 1, when Boston lost to the Pirates 10–2. At the time, they were on a pace to lose 119 games and give up more than 1,100 runs. After that game, they would go 24–33 and allow 5.7 runs a game. That might not sound great, but, compared to a 20–74 record and 7.1 runs allowed per game, it was quite an improvement. So what happened?
Big improvements came from Brown and Tyler, who had each won only once by the beginning of August. They both had winning records after that, Brown going 7–4 and Tyler 6–4. And two late-season additions also helped. Ed Donnelly was selected from Troy in the September draft of minor-league players. He made four starts over the last three weeks of the season, winning three, including a shutout in his last start of the season.
The other late-season addition was Cy Young, who was signed after being released by Cleveland. He pitched well down the stretch, throwing two shutouts. The story I had always heard was that Young decided to retire after losing a 1–0 game to Pete Alexander, but I suspect the real reason had more to do with the last inning he pitched that year. It was in a game at Brooklyn on October 6. The score was knotted at 3 heading into the bottom of the seventh inning. With one out and no one on, Otto Miller tripled. That was followed by four straight singles and then three straight doubles. After the eighth hit in a row, Fred Tenney finally removed Cy Young from what would turn out to be his last major-league game.
So much for the pitchers. What about the hitters they faced? In a sense, the hitters faced by the Boston pitchers that year made up one of the greatest-hitting teams of all time. Of course, they were helped by both the South End Grounds and the pitchers they faced, but I thought it might be fun to take a quick look at their collective statistics. Table 5 shows a breakdown by each lineup position.
This is certainly a great offense, with good production out of every lineup spot except the last. It has the leadoff hitter getting on base more than 300 times (and stealing 59 bases); the secondand third-spot and cleanup hitters averaging more than 200 hits; an eighth-spot hitter batting over .300, and so on.
Table 6 shows how they hit by defensive position. To focus on just one stat of particular interest at the time: This team had six regulars hitting .300 or better (and another hitting .296 with 108 walks).
One surprising finding here is that the second basemen are only a shade behind the right-fielders in the battle for best hitter on this team. Much of this is due to Heinie Zimmerman, who went 40–80 with three triples and six home runs against Boston that season.
Table 4
|
Year |
G GS |
CG SHO IP H R ER BB SO |
W L ERA |
|
1910 |
211 146 |
68 12 1197 1145 601 421 488 467 |
50 92 3.17 |
|
1911 |
97 59 |
30 0 544 634 387 292 230 162 |
14 45 4.83 |
Table 5
|
POS |
AB |
R |
H |
2B |
3B |
HR |
BB |
K |
SH |
HBP |
SB |
AVG |
OBP |
SLG |
|
1 |
614 |
151 |
179 |
28 |
10 |
6 |
133 |
51 |
11 |
6 |
59 |
.292 |
.422 |
.399 |
|
2 |
633 |
141 |
195 |
22 |
15 |
14 |
85 |
53 |
24 |
3 |
40 |
.308 |
.393 |
.457 |
|
3 |
617 |
127 |
208 |
29 |
17 |
6 |
77 |
60 |
23 |
5 |
36 |
.337 |
.415 |
.468 |
|
4 |
606 |
137 |
203 |
33 |
14 |
20 |
70 |
44 |
10 |
11 |
37 |
.335 |
.413 |
.535 |
|
5 |
602 |
110 |
176 |
22 |
12 |
13 |
53 |
50 |
19 |
7 |
26 |
.292 |
.356 |
.434 |
|
6 |
566 |
106 |
165 |
31 |
10 |
4 |
78 |
42 |
20 |
6 |
40 |
.292 |
.383 |
.403 |
|
7 |
562 |
95 |
161 |
26 |
8 |
7 |
73 |
37 |
16 |
3 |
32 |
.286 |
.371 |
.399 |
|
8 |
552 |
88 |
166 |
29 |
6 |
5 |
64 |
42 |
14 |
6 |
14 |
.301 |
.379 |
.402 |
|
9 |
545 |
66 |
118 |
18 |
2 |
1 |
41 |
114 |
28 |
4 |
5 |
.217 |
.276 |
.262 |
|
TOT |
5,297 |
1,021 |
1,571 |
238 |
94 |
76 |
674 |
493 |
165 |
51 |
289 |
.297 |
.381 |
.420 |
Table 6
|
POS |
AB |
R |
H |
2B |
3B |
HR |
BB |
K |
SH |
HBP |
SB |
AVG |
OBP |
SLG |
|
P |
500 |
52 |
107 |
15 |
2 |
1 |
34 |
106 |
28 |
2 |
4 |
.214 |
.267 |
.258 |
|
C |
547 |
85 |
165 |
29 |
6 |
5 |
66 |
43 |
14 |
5 |
13 |
.302 |
.382 |
.404 |
|
1B |
595 |
120 |
183 |
23 |
16 |
15 |
74 |
54 |
19 |
9 |
37 |
.308 |
.392 |
.476 |
|
2B |
615 |
139 |
199 |
23 |
12 |
15 |
74 |
49 |
26 |
4 |
37 |
.324 |
.400 |
.473 |
|
3B |
572 |
103 |
161 |
23 |
10 |
5 |
82 |
35 |
23 |
3 |
33 |
.281 |
.374 |
.383 |
|
SS |
593 |
116 |
184 |
29 |
9 |
5 |
70 |
38 |
11 |
6 |
33 |
.310 |
.389 |
.415 |
|
LF |
598 |
141 |
177 |
39 |
14 |
7 |
108 |
50 |
19 |
7 |
53 |
.296 |
.410 |
.443 |
|
CF |
605 |
121 |
184 |
20 |
11 |
6 |
90 |
51 |
18 |
4 |
42 |
.304 |
.398 |
.403 |
|
RF |
616 |
129 |
198 |
34 |
14 |
17 |
67 |
58 |
6 |
9 |
35 |
.321 |
.396 |
.505 |
|
PH/PR |
56 |
15 |
13 |
3 |
0 |
0 |
9 |
9 |
1 |
2 |
2 |
.232 |
.358 |
.286 |
Also helping were Larry Doyle and John Hummel, who contributed 24 extra-base hits and a .634 slugging percentage to the second-base effort.
Still, I must admit that I expected this team to look even greater. Their .381 on-base percentage and .420 slugging percentage exceeded any team mark from the Deadball Era, but the 1923 Cleveland Indians, to pick just one example, had almost exactly the same percentages (.381 and .421) and scored “only” 886 runs. According to Runs Created (a formula, devised by Bill James, that can be used to predict from a team’s offensive statistics the number of runs they will score),12 Boston’s opponents should have been expected to score 927 runs that season. So how did they manage to squeeze an extra 100 to 135 runs out of their offense? I suppose their 289 stolen bases may have added a few runs but, from what we know of their success rate, it’s hard to assume this was responsible for many of them.13
The answer lies in the Boston defense. In 1911, Boston committed an NL-worst 350 errors, which led to 245 unearned runs. By comparison, the average team in the AL in 1923 committed 200 errors leading to 126 unearned runs. So these hitters not only faced a pitching staff in disarray but also had the good fortune to hit into a very error-prone defense.14
The next year Boston would cut their errors down to 296, but that total would still be the most in the NL. Similarly, their pitchers would allow 871 runs, or 150 fewer than the year before, but that total would be not only still the worst in the league but also the secondworst of the Deadball Era.
As you can imagine from their performance in 1911, few of the pitchers discussed in this article had much of a future in the majors. Only two would make a significant contribution past that year. Lefty Tyler would have the longest career, pitching in the league until 1921, winning 127 games and making four World Series starts. And no Boston pitcher would match the combined 29 wins that Hub Purdue collected in 1912 and 1913. He would have the misfortune to get off to a slow start in 1914 and would be traded to the Cardinals on June 28. At the time of the trade, the Braves would be in last place. They would not be there for long.
TOM RUANE, a frequent contributor to “The Baseball Research Journal”, is director of Retrosheet.
Author’s Note
A version of this article is posted at www.retrosheet.com.
Retrosheet has box scores for every game played in the National League in 1911 and play-by-play accounts for more than four hundred of them. This information was used extensively in this article and would not exist without Ted Turocy’s help in digitizing the data and in the design of Retrosheet’s box-score event-file format. And the transaction information used in this article is just a small sample of Cliff Blau’s extensive research in this area.
Notes
1. The Nationals were a generic nickname for just about any NL team that shared a city with an American League The less generic nicknames for Boston’s NL entry were a little fluid during this period. They had been the Beaneaters until around 1907, when they became the Doves. In 1911, they were commonly referred to as the Rustlers, and the next year were known as the Braves. In the article, I will be referring to them as the Nationals, since few people would know who the Rustlers were and I’m sure I would get complaints from readers (and you know who you are) if I referred to them as the Braves.
2. The Baseball Encyclopedia (New York: Macmillan, Information Concepts, 1969), 22–29.
3. “Slugging Feature of Year,” Chicago Daily Tribune, 29 October 1911, C4.
4. “Emslie to Quit with Pay,” Chicago Daily Tribune, 18 December 1910, C1; “Mattern and Sweeney,” Boston Daily Globe, 20 December 1910, 7.
5. “National League Men in Session,” New York Times, 14 December 1910, 14.
6. “Cecil Ferguson Here,” Boston Daily Globe, 18 April 1911, 5.
7. “Tenney Lads Get Back in Stride,” Boston Daily Globe, 16 April 1911, 17.
8. Ibid.
9. The key to the trade for Boston was veteran catcher Johnny Kling, who caught one game for his new team and then threatened to He was coaxed back after a few days, but getting used to catching his new pitching staff seems to have taken a toll on his hitting. He started his stay in Boston by collecting only 3 singles in 45 at-bats, for a .067 batting average (and slugging percentage).
10. “Baseball Notes,” Boston Daily Globe, 23 May 1911, 6.
11. “Must Go to Surgeon,” Boston Daily Globe, 20 May 1911, 6.
12. The Runs Created formula used here is a variant on Bill James’s “technical” version — it is minus SB (since we don’t have CS) and GIDP and intentional walks (which we don’t have for 1911). Like other versions of his formula, it can be expressed as (A times B) divided by C. In this version:
A = Hits + walks + hit batsmen
B = Total bases + (.26 [walks + hit batsmen]) + ( .52 x sacrifice hits)
C = At-bats + walks + hit batsmen + sacrifices In the NL in 1911, this formula resulted in a total Runs Created of 5,398, or 2 percent less than the actual number of runs scored that year (5,506).
13. In 1911, Boston’s opponents stole 289 bases; we have play-by-play data for 85 of their In those games, enemy baserunners stole 151 bases and were caught 91 times, for a success rate of 62 percent. Which means that all that running probably didn’t account for a whole lot of extra runs.
14. I did consider that this might be a park effect, caused by either a poor playing field or an idiosyncratic official scorer, but Boston in 1911 committed a lot of errors both at home and on the road.