

The Effect of Stride Length on Pitched Ball Velocity
This article was written by Stephen Smith
This article was published in Spring 2017 Baseball Research Journal
One philosophy of pitching holds that pushing off the rubber as hard as possible and landing as far from it as possible generates the most velocity, while another holds that shortening stride length and “pulling off” the rubber will generate the most. In both theories, stride length is a critical component, both for establishing the timing of the kinetic chain of events and for distributing mechanical energy from the lower body to the throwing hand.1 Velocity is an asset pitchers have always wanted; so what is the best way to achieve an increase in velocity? The purpose of this study is to examine the effect on pitched ball velocity with variations from a pitcher’s normal stride length — 10 percent greater than normal and 10 percent less than normal.
To throw the ball hard, a pitcher needs to maintain excellent and consistent mechanics. These mechanics should be taught early in a child’s baseball career. Fleisig, et al. examined differences between youth, high school, college, and professional baseball pitchers.2 Their study showed that all kinematic parameters improved as the player progressed to higher levels. They also found that there were greater risk factors associated with higher level pitchers due to greater joint force and torque associated with increased strength and muscle mass. Fleisig presumes that if young baseball players can be taught efficient mechanics at an early age, then the risk factor for specific arm and shoulder surgeries can be decreased. Those mechanics demonstrate that pitchers can throw harder with greater, rather than worsened, recovery rates.
According to Fleisig et al. joint force and torque have been highly scrutinized due to the increase in ulnar collateral ligament (UCL) surgeries (“Tommy John” surgery). 3 Perhaps another area of pitching mechanics that needs to be scrutinized is the impact of lower body mechanics. The kinetic chain starts from the ground up, so it makes sense to examine that chain from its origin even if at first glance it is unclear how stride length impacts ground reaction forces, joint biomechanics, momentum transfer, and pitched ball velocity.
Previous research has provided a glimpse of what overstriding can do with regard to exertion, but not much exists on the effect stride length has on pitched ball velocity.4 What little research has been done indicates that stride length has little to do with resulting velocity.5 Beyond actual velocity generated by a pitcher in a single pitch, one must also account for the exertion required to pitch repeatedly throughout the course of a game. If a change in stride length resulted in reduced exertion over the course of the game, then in addition to faster recovery times perhaps there is a reduced loss of velocity over the course of pitches thrown.
Matsuo et al. investigated the differences between 29 collegiate and professional pitchers who threw with ball velocities above 85 miles per hour (MPH) and 23 college pitchers whose velocities were below 77 MPH.6 They concluded that height, humeral length, radial length, peak knee flexion angular velocity, maximum shoulder external rotation (MER), lead knee extension angular velocity at the instant of ball release (REL), forward trunk tilt at REL, time to peak maximum elbow extension angular velocity, and time to peak shoulder internal rotation angular velocity all differed significantly between the low- and high-velocity groups.
Crotin, et al. demonstrated that a shorter stride length can decrease exertion faced by a pitcher.7 Exertion was measured through a nine-minute resting baseline heart rate (HR), salivary cortisol, salivary alpha amylase, self-reported exertion scores, baseline blood glucose, and baseline lactate scores. They concluded that a longer stride length is physiologically more demanding. Another finding in this study showed that mean velocity was unaffected by stride length. Stride length in Crotin’s study was determined by desired stride length equal to 67% of the pitcher’s height. Over stride length was 76% of body height and under stride length was 52% of body height.
These previous studies did not study stride length as a relative influence on pitched ball velocity. The current study examines the effect of stride length on pitched ball velocity. It was hypothesized that by reducing a pitcher’s average stride length by 10 percent, there should be a slight increase in pitched ball velocity. Additionally, it was hypothesized that increasing stride length by 10 percent beyond each pitcher’s stride length should reduce pitched ball velocity.
METHODOLOGY
Participants
Participants were 30 males 18 to 22 years of age who were members of a Division 3 college baseball team. Approval from the college’s Institutional Review Board was obtained prior to administering the testing protocol and informed consents were signed by each participant. Each participant was required to have been a member in good standing with the baseball program and free from any pre-existing arm or shoulder injury.
A total population sample was employed to determine if the measurable factors would influence pitched ball velocity. Each participant warmed up using a modified version of the Velocity 18 throwing program.8 The Velocity 18 program is a warm-up consisting of throwing varying distances (45’, 60’, 90’, 120’, 90’, and 60’) for two minutes each using a four-seam fastball grip.
The purpose was to be consistent with getting each participant thoroughly warmed up in the exact same fashion, and to do so in a way that would minimize the risk of injury.
PROCEDURE, INSTRUMENTATION, AND INDEPENDENT MEASURES
Data collection occurred through participant observations. Objective tests aimed at determining if stride length had an impact on pitched ball velocity were administered as follows:
Once participants were warmed up they were placed on an indoor portable mound with a 10-inch rise—standard for a college baseball mound. They were asked to go through their normal pitching routine simulating a normal pitch. The researcher then marked the landing spot with standard silver duct tape. The researcher then calculated a landing spot that was 10 percent longer than normal and also a landing spot that was 10 percent shorter than normal. Each spot was marked with silver duct tape. Each piece of tape was marked with a “1” (10 percent shorter), “2” (normal), or “3” (10 percent longer). Participants were allowed to familiarize themselves with each landing area prior to delivering a pitch. The researcher then sat behind a protective net 60 feet 6 inches away with a Jugs II radar gun (Tualatin, OR, USA) and recorded pitched ball velocity for each pitch.
Pitching Sequence
In order to equalize fatigue, the pitches were thrown from random stride locations. The researcher would call out the number corresponding to the landing spot for the pitcher and the pitcher would land on the corresponding numbered piece of duct tape. Upon completion of each pitch the researcher would record the speed of the pitch using a calibrated Jugs II radar gun.
Results
Statistical Analysis
Comparisons between velocity and stride length (normal stride, 10 percent shorter than normal, and 10 percent longer than normal) were made using a repeated measure ANOVA with MPH as the dependent variable. Means and standard deviations were calculated and a 95 percent confidence interval was obtained. All calculations were completed in Statistical Package for the Social Sciences (version 23). The a priori alpha level was set to P≤.05.
Data Collection
Scores were obtained for each participant in one testing session. Thirty pitches with maximum effort were delivered in a randomized order and velocity was recorded in MPH for later analysis. All participants fully completed the testing session.
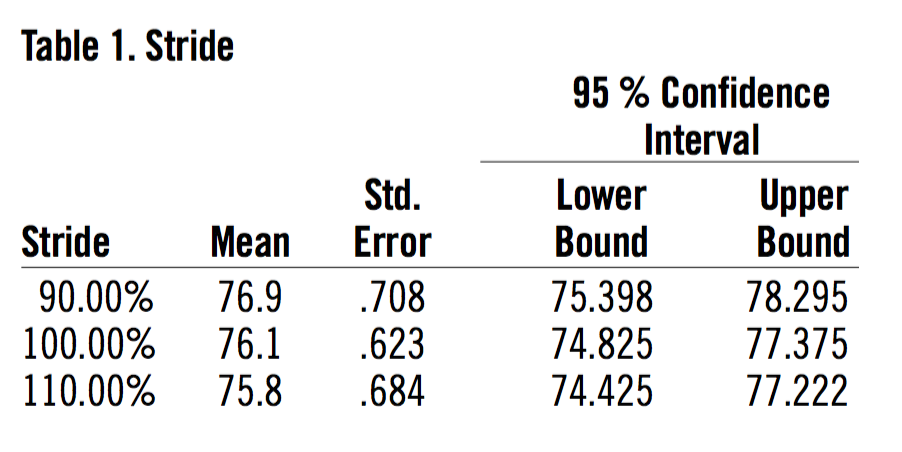
Table 1: Stride
(Click image to enlarge)
Table 1 illustrates the mean velocities for each treatment. Table 1 also illustrates that a stride length that was 10 percent shorter than normal resulted in an average velocity increase of .8 MPH versus a normal stride length and a stride length 10 percent greater than normal was over a full 1 MPH slower on average than 10 percent shorter than normal.
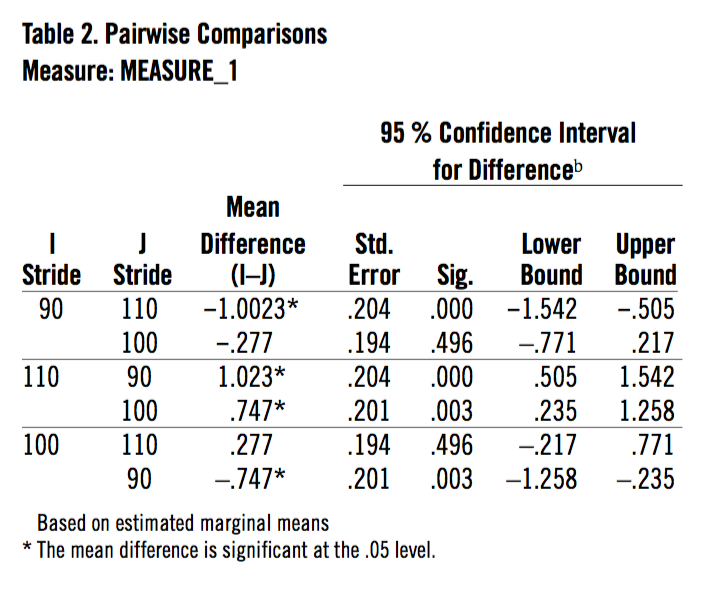
In addition to the mean differences, a 95 percent confidence interval was obtained to show that the data demonstrate there was a 95 percent chance the upper and lower velocities would fall between the listed data in table 2. This is an important statistic because it demonstrates on average the upper and lower velocities were at their best at the 10 percent shorter treatment.
The basis for the current research study was to see if reducing a pitcher’s stride length by as little as 10 percent could increase velocity. According to a repeated measure ANOVA, the stride length significantly altered pitch velocity (F2,522=14.01, P<.001). 90% (mean=76.9 MPH) produced significantly faster pitch velocities than 110% (mean=75.8 MPH) 100% (mean=76.1 MPH). Finally, there were no significant differences in velocity across pitch number (F9,522=1.81, P=.07). In order for a repeated measure ANOVA to be valid some assumptions need to be made. The first assumption is that trials are equal and all possible combination of trials are equal. This study followed both assumptions. Because of this, it is unlikely that the statistical analysis resulted in a Type 1 error (rejecting the null hypothesis).
Table 2: Pairwise comparisons
(Click image to enlarge)
DISCUSSION
The present study was designed to examine the effect stride length has on pitched ball velocity in 30 college baseball players comparing their normal stride length, a stride length 10 percent less than normal, and 10 percent greater than normal. The rationale for the basis of the study was the ongoing debate of the push versus pull philosophies when teaching individuals to pitch. Previous studies demonstrated that certain physiological variables contribute to velocity and to exertion, but none examined the relative effect of velocity.9 Results of the present study demonstrated that there were statistical differences between stride lengths and pitched ball velocity.
This study should be interpreted with reservation due to the following limitations: 1) This study was conducted with 30 college baseball players who were not assessed on mechanical efficiency but have been trained at a level where they were qualified enough to play baseball at the Intercollegiate level and 2) 30 subjects do not generalize itself to the entire population. This study should be replicated and scrutinized in the research community; however, it does give some substance to the market of baseball coaches that subscribe to the philosophy that pulling off the rubber will create a mechanical advantage to be able to throw at a slightly higher velocity. A secondary benefit to slightly higher velocities should also include less exertion and greater recovery rates.10
Despite the limitations of the study, it may benefit coaches to investigate the stride length of their current pitchers and assess the distance that the stride foot travels.
CONCLUSIONS
There are many factors that determine velocity when pitching (mechanics, strength, etc.) but one must also consider the relative impact that stride length has on pitched ball velocity. Coaches should consider an examination of lower body mechanics when teaching the skill of pitching in addition to their usual focus on upper-body mechanics. The next step should include researching the ideal stride length for the optimization of velocity, mechanical efficiency, and recovery. Some research has suggested the ideal stride length for professional pitchers is between 80% and 85% of body height.11 However, it has been researched that collegiate pitchers on average have even shorter stride lengths.12 There is still much research to be done to help advance the game in a safe and scientifically supported fashion.
STEPHEN SMITH joined SABR in 2011 and published the article “Talent Selection in Youth Baseball: Factors That Determine End of Season Success” in the Fall 2011 “Baseball Research Journal.” Smith serves as an associate professor of health and physical education at Lynchburg College in Virginia where he played and coached baseball for the Hornets. The current article was a collaboration with his son EASTON SMITH, who is currently working toward making the baseball team at Jefferson Forest High School in Forest, Virginia, and THOMAS BOWMAN, who is an associate professor of athletic training at Lynchburg College.
Sources
Crotin, R.L., Kozlowski, K., Horvath, P., and Ramsey, D.K. “Altered stride length in response to increasing exertion among baseball pitchers.” Medicine & Science in Sport & Exercise 46 (2014): 565-571.
Dun, S., Loftice, J., and Fleisig, G.S. “A biomechanical comparison of youth baseball pitches: Is the curveball potentially harmful?” American Journal of Sports Medicine 36 (2008): 686-692.
Elliott, B., Grove, J.R., and Thurston, B. “A three-dimensional cinematographic analysis of the fastball and curveball pitches in baseball.” Journal of Sports Biomechanics 2 (1986): 20-28.
Escamilla, R.F., Barrentine, S.W., and Fleisig, G.S. “Pitching biomechanics as a pitcher approaches muscular fatigue during a simulated baseball game.” American Journal of Sports Medicine 35 (2007): 23.
Escamilla, R.F., Fleisig, G.S., Zheng, N., Barrentine, S.W., Wilk, K.E., and Andrews, J.R. “Biomechanics of the knee during closed kinetic chain and open kinetic chain exercises.” Medicine & Science in Sport and Exercise 4 (1998): 556-569.
Fleisig, G.S., Berrentine, S.W., Zheng, N., Escamilla, R.F., Andrews, J.R. “Kinematic and kinetic comparison of baseball pitching among various levels of development.” Journal of Biomechanics 32 (1999): 1371-1375.
Fleisig, G.S., Kingsley, D.S., and Loftis, J.W. “Kinetic comparison among the fastball, curveball, change-up, and slider in collegiate baseball pitchers.” American Journal of Sports Medicine 34 (2006): 423-430.
Lin, H.T., Su, F.C., Nakamura, M., and Chao, E.Y.S. “Complex chain of momentum transfer of body segments in a baseball pitching motion.” Journal of Chinese Institute of Engineers 26 (2003): 861-868.
Matsuo, T., Escamilla, R.F., Fleisig, G.S., Barrentine, S.W., and Andrews, J.R. “Comparison of kinematic and temporal parameters between different pitch velocity groups.” Journal of Applied Biomechanics 17 (2001): 1-13.
Seroyer, S.T., Nho, S.J., and Bach. “The kinetic chain in overhand pitching: Its potential role for performance enhancement and injury prevention.” Sports Health 2 (2010): 135-136.
Stoddin, D.F., Fleisig, G.S., McLean, S.P., and Andrews, J.R. “Relationship between biomechanical factors to baseball pitching velocity: Within pitcher variation.” Journal of Applied Biomechanics 21 (2005): 44-56.
Notes
1 H.T. Lin, F.C. Su, M. Nakamura, and E.Y.S. Chao, “Complex Chain of Momentum Transfer of Body Segments in a Baseball Pitching Motion,” Journal of Chinese Institute of Engineers 26 (2003): 861-868; S.T. Seroyer, S.J. Nho, and Bach, “The Kinetic Chain in Overhand Pitching: Its Potential Role for Performance Enhancement and Injury Prevention,” Sports Health 2 (2010): 135-136.
2 G.S. Fleisig, S.W. Berrentine, N. Zheng, R.F. Escamilla, J.R. Andrews, “Kinematic and Kinetic Comparison of Baseball Pitching Among Various Levels of Development,” Journal of Biomechanics 32 (1999): 1371-1375.
3 G.S. Fleisig, S.W. Berrentine, N. Zheng, R.F. Escamilla, J.R. Andrews, “Kinematic and Kinetic Comparison of Baseball Pitching Among Various Levels of Development,” Journal of Biomechanics 32 (1999): 1371-1375.
4 R.L. Crotin, K. Kozlowski, P. Horvath, and D.K. Ramsey, “Altered Stride Length in Response to Increasing Exertion Among Baseball Pitchers,” Medicine & Science in Sport & Exercise 46 (2014): 565-571.
5 Stoddin, D.F., Fleisig, G.S., McLean, S.P., and Andrews, J.R. “Relationship between biomechanical factors to baseball pitching velocity: Within pitcher variation.” Journal of Applied Biomechanics 21 (2005): 44-56.
6 T. Matsuo, R.F. Escamilla, G.S. Fleisig, S.W. Barrentine, and J.R. Andrews, “Comparison of Kinematic and Temporal Parameters Between Different Pitch Velocity Groups.” Journal of Applied Biomechanics 17 (2001): 1-13.
7 R.L. Crotin, K. Kozlowski, P. Horvath, and D.K. Ramsey, “Altered Stride Length in Response to Increasing Exertion Among Baseball Pitchers,” Medicine & Science in Sport & Exercise 46 (2014): 565-571.
8 Tom House, “The Program,” Velocity Plus Armcare, accessed October 31, 2016, www.velocityplusarmcare.com
9 R.L. Crotin, K. Kozlowski, P. Horvath, and D.K. Ramsey, “Altered Stride Length in Response to Increasing Exertion Among Baseball Pitchers,” Medicine & Science in Sport & Exercise 46 (2014): 565-571; T. Matsuo, R.F. Escamilla, G.S. Fleisig, S.W. Barrentine, and J.R. Andrews, “Comparison of Kinematic and Temporal Parameters Between Different Pitch Velocity Groups.” Journal of Applied Biomechanics 17 (2001): 1-13.
10 R.L. Crotin, K. Kozlowski, P. Horvath, and D.K. Ramsey, “Altered Stride Length in Response to Increasing Exertion Among Baseball Pitchers,” Medicine & Science in Sport & Exercise 46 (2014): 565-571
11 R.F. Escamilla, S.W. Barrentine, and G.S. Fleisig,”Pitching Biomechanics as a Pitcher Approaches Muscular Fatigue During a Simulated Baseball Game,” American Journal of Sports Medicine 35 (2007): 23; B. Elliott, J.R. Grove, J.R.and B, Thurston, “A Three-Dimensional Cinematographic Analysis of the Fastball and Curveball Pitches in Baseball,” Journal of Sports Biomechanics 2 (1986): 20-28.
12 S. Dun, J. Loftice, and G.S. Fleisig, “A Biomechanical Comparison of Youth Baseball Pitches: Is the Curveball Potentially Harmful?” American Journal of Sports Medicine 36 (2008): 686-692; G.S. Fleisig, D.S. Kingsley, and J.W. Loftis, “Kinetic Comparison Among the Fastball, Curveball, Change-up, and Slider in Collegiate Baseball Pitchers,” American Journal of Sports Medicine 34 (2006): 423-430.