
The Houston Asterisks: Analyzing the Effects of Sign-Stealing on the Astros’ World Series Season
This article was written by Brinley Zabriskie - Will Melville
This article was published in Fall 2020 Baseball Research Journal
In November 2019, The Athletic published an article that credibly accused the Houston Astros of electronically stealing catcher signs in 2017.1 Stealing catcher signs can potentially provide an advantage to batters since they know in advance the type of pitch the pitcher will throw. Late in the 2017 season, Major League Baseball (MLB) forbade the use of electronics to steal catcher signs and relay those signs to hitters, with Commissioner Rob Manfred issuing a memo to that effect in September 2017.2 The Athletic article sparked outrage in the baseball world, with many fans demanding the Astros be stripped of their 2017 World Series title.
As a result of the article and ensuing outrage, MLB began investigating the Houston Astros. The results of that investigation were published in January 2020, and it was determined that the Astros did break the rules by electronically stealing signs.3 Reportedly, the Astros had two distinct methods of sign-stealing.
For the first method, Astros employees in the video replay review room used the live game feed from the center-field camera to attempt to decode the opposing catcher’s signs using a program called “Codebreaker.”4 If the employees were able to decode the sign sequence, they would relay that information to the players. Then, if an Astros player reached second base, the player could then decode the catcher’s signs and signal the next pitch to the current batter, thereby giving their team an advantage against the opposing team’s pitcher. It is believed that the Astros used this method to steal signs throughout the 2017 season and partway into the 2018 season during both their home and away games.
The Astros began a second method of sign-stealing apparently on May 28, roughly two months into the 2017 season.5 A group of players, as well as bench coach Alex Cora, set up a monitor outside the team’s dugout that displayed the center-field camera feed. They then used that feed to steal the opposing catcher’s signs and signal the next pitch to the batter by banging on a trash can. One or two bangs typically corresponded to off-speed or breaking pitches, whereas no bangs corresponded to a fastball. The Astros used this method to steal signs throughout the 2017 season (after May 28) during their home games.
In his official report on the Astros investigation, Rob Manfred stated that he was unable to determine if the sign-stealing actually helped the Astros win games. Many Astros players stated that they felt the banging was more distracting than helpful. Not only that, but many baseball fans, as well as high-ranking baseball officials, believe that the sign-stealing issue is widespread and not confined to the Astros alone. Thus, it is possible that the Astros’ sign-stealing, while illegal, did not actually provide them a significant advantage during the 2017 season. However, it is also possible that their sign-stealing did provide an unethical advantage.
The aim of this article is to identify and describe evidence that cheating by electronic sign-stealing provided or did not provide the Astros with an advantage over the other MLB teams. To that end, we analyze a variety of offensive statistics to determine if the Astros appear to have had a significant advantage offensively compared to other MLB teams. Specifically, we analyze swing rates, walk and strikeout rates, overall hitting as measured by weighted runs created plus (wRC+), rare run-scoring events, and comeback rates. We compare the Astros’ performance during their home games (where trash-can-banging and “Codebreaker” were used) versus their away games (where only “Codebreaker” was used) to determine if the trash-can-banging scheme significantly aided the Astros. (The home-field advantage effect is not substantial in baseball.6) Additionally, we compare the Astros’ home games before and after May 28, since that is when they started using the trash-can-banging scheme. We did not include the three “home” games that the Astros played in Tampa Bay as a result of Hurricane Harvey. As a baseline for comparison, we also look at the rest of the league’s performance.
We present the swing rates, walk and strikeout rates, overall hitting, rare run scoring events, and comeback rates data analyses in Section 1. In Section 2, we summarize our findings in terms of the evidence that sign-stealing provided or did not provide the Astros a significant advantage during the 2017 season. Finally, we end with our conclusions. Overall, we do not believe the evidence we present offers definitive proof that the Astros significantly benefitted, or did not benefit, from their cheating during the 2017 season.
Section 1: Data Analysis
In this section, we analyze several metrics to try to measure if the Astros’ sign-stealing provided them an unfair advantage during the 2017 season. We analyze metrics that would likely have been directly impacted by sign-stealing, like swing rates, walk rates, and strikeout rates. We also look at metrics that may have been indirectly affected by sign-stealing, like wRC+, rare run-scoring events, and comebacks. Swing rate data were obtained from Baseball Savant’s Statcast.7 The walk rates, strikeout rates, and wRC+ data were taken from FanGraphs.8 Finally, Retrosheet provides the data used in the rare run-scoring event and comeback analyses through their game logs and play-by-play files.9 We compare the Astros’ performance during their home games (where they supposedly used trash-can-banging and “Codebreaker”) against their away games (where they just used “Codebreaker”) in an attempt to quantify the effects of their sign-stealing schemes. We also compare the Astros’ home games before May 28 (29 games) and after May 28 (49 games) to determine if the trash-can-banging scheme alone helped the Astros. Additionally, we compare the Astros’ performance with the rest of the league’s performance to see if they had a significant advantage over other MLB teams.
Throughout these analyses, we will often report p-values. A p-value is the probability, under a certain statistical model, that a summary of the data (e.g., the average difference between two groups) would be equal to or more extreme than its observed value.10 For the swing rate analyses, a p-value would represent the probability of seeing the given difference, or larger difference, in home and away swing rates if we assume that the true swing rates are equal. A small p-value indicates statistical incompatibility of the observed data with what we assumed to be true, which, for the swing rate analysis would indicate evidence of a significant difference in the home and away swing rates. It should be noted that we do not support using arbitrary cut-offs to determine if a p-value is significant. For more information about p-values and their correct interpretations, see reference 9.
Swing Rate Comparisons
One potential advantage of sign-stealing is foreknowledge of a pitch, which could affect a hitter’s choice to swing, which would affect their overall swing rate. When comparing the Astros’ swing rates, we consider three different pitch types: fastballs, breaking balls, and off-speed pitches. We also consider pitches outside the strike zone. We compare the Astros’ home swing rates with their away swing rates, and we compare their home swing rates before May 28 against their home swing rates after May 28. To make these comparisons, we apply a two-sample t-test, a basic statistical hypothesis test to compare the swing rate of one set of games to the swing rate of another set of games, to each type of pitch. We use a two-sided test to determine if there is a significant difference in swing rates at home versus away, as well as at home before and after May 28. A significant difference in swing rates in any of these tests would provide evidence that the trash-can-banging scheme had an effect on swing rates, and, consequently, an effect on the game.
Note that “Codebreaker” may also have had a small effect on swing rates. However, stealing signs via “Codebreaker” required having a runner on second base, which is relatively uncommon, so most pitches and swings would have occurred with no runner on second. Additionally, the Astros used “Codebreaker” at home and on the road, so by comparing home and away swing rates, we are essentially treating “Codebreaker” as a baseline for assessing the effectiveness of the trash-can-banging scheme.
In addition to testing for a difference in swing rates between home and away games, we also test for a difference in swing rates for the rest of the league’s home and away games. This will act as a baseline for comparison for the Astros’ swing rates. For instance, if the rest of the league and the Astros have similar differences in their home and away swing rates, then this would suggest the sign-stealing did not significantly aid the Astros.
Figure 1. 2017 home and away game swing rates for the Astros and the rest of the MLB teams
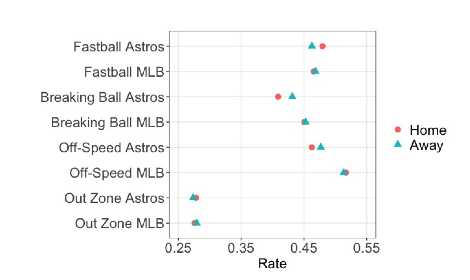
Figure 1 shows the 2017 home and away swing rates for the Astros and the rest of the league. There is weak evidence that the Astros were more likely to swing at fastballs at home than they were on the road (p-value of 0.04). Conversely, there is weak evidence that the rest of the league was less likely to swing at fastballs at home (p-value of 0.05). Since the Astros were more likely to swing at fastballs at home, but the rest of the league was less likely to, this could indicate that sign-stealing influenced the Astros’ fastball swing rates.
For breaking balls, there is weak evidence that the Astros were less likely to swing at these pitches at home than they were on the road (p-value of 0.05). On the other hand, there is no significant difference in the rest of the league’s swing rates at breaking balls at home or away (p-value of 0.37). These results suggest that the trash-can-banging may have helped the Astros avoid swinging at breaking balls during their home games.
Neither the Astros nor the rest of the league saw significant differences in their home and away swing rates at off-speed pitches (p-values of 0.43 and 0.32, respectively). Likewise, the Astros saw no significant difference in their swing rates at pitches outside the strike zone during their home or away games (p-value of 0.55). However, there is evidence that the rest of the league was more likely to swing at pitches outside the strike zone on the road than they were at home (p-value of 0.02). These results suggest that trash-can-banging had no effect on the Astros’ swing rates at off-speed pitches or pitches outside the strike zone.
Figure 2: 2017 home game swing rates for the Astros before and after May 28
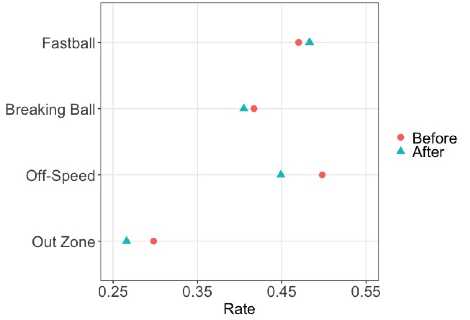
Figure 2 shows the Astros’ home swing rates before and after May 28, the day they started trash-can-banging to steal signs. There are no significant differences in the Astros’ swing rates at fastballs (p-value of 0.28) or at breaking balls (p-value of 0.51) before and after May 28. There is weak evidence (p-value of 0.06) that the Astros were less likely to swing at off-speed pitches after May 28. There is fairly strong evidence (p-value of 0.01) that the Astros were less likely to swing at pitches outside the strike zone after May 28. Overall, the results in Figure 2 suggest that sign-stealing may have affected the Astros’ swing rates at off-speed pitches and pitches outside the strike zone, but it did not seem to affect their swing rates at fastballs or breaking balls.
Walk Rates, Strikeout Rates, and wRC+
Next, we consider walk rates, strikeout rates, and wRC+. A team’s walk rate is the total number of times they walked divided by their total number of plate appearances. Similarly, their strikeout rate is the total number of strikeouts divided by plate appearances. Weighted runs created (wRC) quantifies a player’s offense in terms of runs, and wRC+ simply compares a player’s wRC to the league average wRC after adjusting for ballpark effects.11 Swing rates naturally have an effect on strikeout and walk rates, and walk rates and strikeout rates have an effect on overall offense, which can be measured with wRC+. To determine if the sign-stealing schemes had a significant effect on the Astros’ walk rates, strikeout rates, and wRC+, we employ t-tests, as outlined earlier.
We start by comparing walk and strikeout rates for the Astros’ home and away games. The Astros had no significant difference in walk rates at home (rate of 0.078) versus away (rate of 0.085) (p-value of 0.33). Similarly, their strikeout rates were not significantly different at home (rate of 0.167) than they were on the road (rate of 0.179) (p-value of 0.21). The Astros wRC+ was the same value, 121, at home and away. It appears that sign-stealing via trash-can-banging did not significantly impact the Astros’ walk rates, strikeout rates, or wRC+ when comparing their home and away games.
Next, we compare walk and strikeout rates from the Astros’ home games before and after May 28. There was no significant difference in the Astros’ walk rates before May 28 (rate of 0.077) and after May 28 (rate of 0.079) (p-value of 0.89). Strikeout rates were also not significantly different for the Astros’ home games before May 28 (rate of 0.178) and after May 28 (rate of 0.160) (p-value of 0.21). Sign-stealing via trash-can-banging appears not to have helped the Astros’ walk more or strike out less when comparing their home games before and after May 28.
The change in the Astros wRC+, on the other hand, is rather interesting when comparing this value before and after May 28. The Astros wRC+ at home before May 28 was 112, and their wRC+ at home after May 28 jumped up to 126. To determine how common it is to see an increase as large as the Astros’, we compare every MLB team’s 2017 home wRC+ before May 28 and after May 28.
Figure 3: 2017 MLB teams’ home wRC+ scores
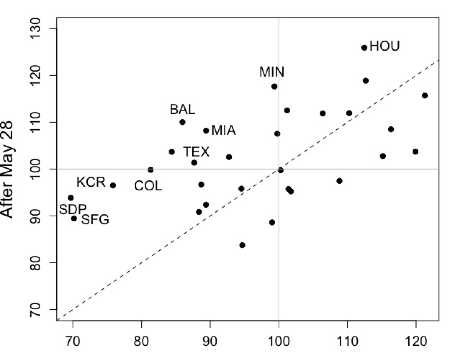
Figure 3 shows a scatterplot with the home wRC+ values before and after May 28 for every MLB team in 2017. The plot shows that it was not uncommon to see an increase in wRC+ of fourteen. In fact, the Giants (SFG), Padres (SDP), Royals (KCR), Rockies (COL), Orioles (BAL), Rangers (TEX), Marlins (MIA), and Twins (MIN) all saw similar, or even larger, increases (marked on the plot). However, these teams all started out with a below average wRC+ before May 28, whereas the Astros (HOU) started out with an above average wRC+ before May 28 (note that 100 is considered average for wRC+). It could be argued that the increase in wRC+ for the other teams is expected due to a regression-to-the-mean effect. However, that same argument cannot be made for the Astros since their wRC+ before May 28 was already above average. One could perhaps argue that the Astros wRC+ increased after May 28 because they were stealing signs with the trash-can-banging scheme, but then we would also expect their home wRC+ (121) to be larger than their away wRC+ (121), which is not the case. These inconsistencies make it difficult to say with confidence that the Astros’ sign-stealing led to their increase in wRC+ after May 28.
The dashed diagonal line in Figure 3 marks the points where teams would have the same wRC+ before and after May 28. Teams above the dashed line improved their wRC+ after May 28, while teams below the dashed line saw a decrease in their wRC+ after May 28. Teams with an increase in wRC+ of more than 14 are labelled. The grey horizontal and vertical lines mark the average, as defined, for wRC+.
Rare Run Scoring Events
We now consider two rare offensive events: big run innings and big run games. Though the sign-stealing would not have had a direct impact on rare offensive events, it is possible that consistent sign-stealing would have helped the Astros have significantly more big run events than their opponents. We define big run innings as an inning where a team scores four or more runs, and we define big run games as a game where a team scores eleven or more runs. Innings of four or more runs occurred 2.7% of the time in 2017, and games with eleven or more runs occurred about 5.6% of the time in 2017. We compare the Astros’ home and away games to see if they were more likely to have these rare offensive events at home (where they were stealing signs with the trash can method and “Codebreaker”) than on the road (where they were just using “Codebreaker”) compared to the likelihood of the rest of the league.
Traditional statistical methods are insufficient to analyze rare event data such as these. Accordingly, we employ the methods of Zabriskie and Fisher’s exact test, which are designed to handle rare events. We use the method of Zabriskie for the big run innings analyses.12 This method was designed originally for rare event meta-analyses and is a way to pool information from multiple sources to produce one overall conclusion. This method will pool the evidence across the Astros’ 81 away games and 78 home games during the 2017 season, while accounting for the natural clustering of each game. We apply Fisher’s exact test to the big run games analyses to determine if the Astros were more likely to have more big run games than their opponents.13
For both rare events, we perform two separate analyses: one for the Astros’ home games, the other for the Astros’ away games. For the Astros’ ith home game (i = 1,2,…,78), we compare the Astros’ (the home team) performance with their competitor’s (the away team) performance. We do the same for the Astros’ ith away game (i = 1,2,…,81), where we compare the Astros’ (the away team) performance with their competitor’s (the home team) performance. For big run innings, we count the number of times four or more runs were scored during the ni innings in the ith game (ni ranged from 8 to 13 in the Astros’ 2017 season). For big run games, we count the number of games with eleven or more runs (ni = n = 1 for all games).
In summary, for the Astros’ home and away game comparisons, we perform four statistical tests, one for each combination of rare events (big run innings and big run games) and game location (home and away). Additionally, we conduct similar tests to compare the Astros’ home games before and after May 28, when the trash-can-banging scheme began.
Table 1 shows the results of the rare big run innings tests on the Astros’ home and away games. There is no significant difference in big run innings between the Astros and their competitors. This suggests that sign-stealing at home did not aid the Astros in having more big run innings than their opponents, nor did “Codebreaker” help the Astros have more big run innings on the road than their competitors.
|
Big Run Innings for the |
Big Run Innings for the |
|
|
Astros’ Average Event Rate |
3.92% |
4.63% |
|
Competitors’ Average Event Rate |
2.14% |
3.50% |
|
p-value |
0.92 |
0.91 |
Also reported are the one-sided p-values for testing if the Astros had significantly more big run innings than their competitors.
Table 2 displays the results of the rare big run games tests on the Astros’ home and away games. For the home games, there is no evidence to suggest that sign-stealing at home helped the Astros have big games more frequently. For the away games, there is some evidence that the Astros had significantly more big run games than their opponents. Perhaps “Codebreaker” aided the Astros offensively by helping them achieve big run games more often on the road.
Table 2
|
Big Run Games for the |
Big Run Games for the |
|
|
Astros’ Average Event Rate |
6.41% |
14.81% |
|
Competitors’ Average Event Rate |
2.56% |
6.17% |
|
p-value |
0.22 |
0.06 |
Also reported are the one-sided p-values for testing if the Astros had significantly more big run games than their competitors.
We also compare the Astros’ and their competitors’ performance during the Astros’ home games before and after May 28. The results for big run innings and big run games are identical to what was found for all of the Astros’ home games because all big run innings and big run games occurred after May 28. Namely, there is no evidence that sign-stealing aided the Astros’ in achieving more big run innings or big run games than their competitors when comparing the Astros’ home games before and after May 28 (p-values greater than 0.21).
Comebacks
Finally, we consider comebacks. Stealing signs could potentially help a team stay competitive in games that they are expected to lose. For example, knowing the opposing team’s signs might help a batter hit a home run or an extra-base hit late in a one-run game. Additionally, the Astros would have been more motivated to steal signs in games where they needed to make a comeback than in games where they already had a lead. We are interested in determining if the Astros had an unusually good ability to come back in games where they were down, so we analyze their comeback rates by inning. We define comeback rate by inning as the total number of times a team won a game when they were down in the given inning divided by the total number of times they were down in that inning. We compare the Astros’ comeback rates to the rest of the league’s comeback rates to see if they came back more frequently than expected. We compare home and away comeback rates separately since the cheating tactics were different at home than they were on the road. We also compare the home comeback rates before and after May 28.
Figure 4: Comeback rates for the 2017 home games
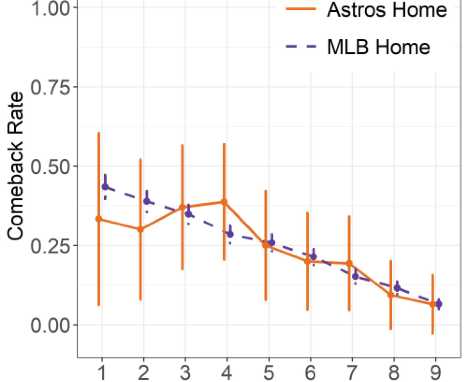
Data are split for the Astros and the rest of the MLB teams with 95% confidence intervals plotted for each inning.
Figure 4 shows the Astros’ home comeback rates and the rest of the league’s home comeback rates. The vertical lines represent 95% confidence intervals for the true comeback rate. These confidence intervals represent a range of values that we can say with a high level of confidence include the true comeback rate. If the Astros’ vertical lines overlap MLB’s vertical lines at an inning, then we conclude that there is no significant difference in home comeback rates between the Astros and MLB teams. From Figure 4, we see that the confidence intervals for the Astros and the rest of the league overlap in each inning. Thus, there is no evidence to suggest that banging on trash cans or “Codebreaker” helped the Astros come back when they were down in their home games.
Figure 5: Comeback rates for the 2017 away games
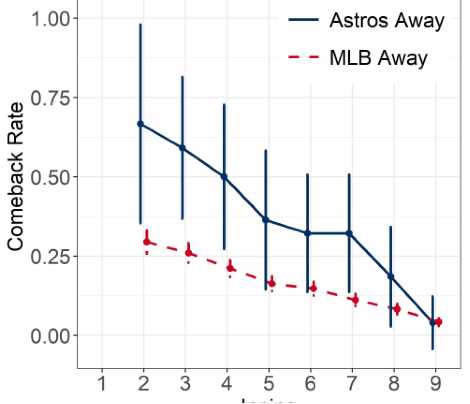
Data are split for the Astros and the rest of the MLB teams with 95% confidence intervals plotted for each inning.
Figure 5 displays the Astros’ away game comeback rates and the rest of the league’s away game comeback rates. The confidence intervals for the Astros and the other MLB teams overlap in the fifth, sixth, eighth, and ninth innings, but they do not overlap in the second, third, fourth, or seventh innings. This suggests that the Astros were significantly more likely to come back when they were losing on the road in those innings (second, third, fourth, and seventh) than the rest of the league. This provides evidence that “Codebreaker” may have helped the Astros come back on the road. However, the Astros used “Codebreaker” at home, along with the trashcan-banging scheme, but they were not significantly more likely to come back at home than the rest of the league for any inning. This inconsistency makes it hard to attribute the Astros’ unusual ability to come back on the road in some innings to sign-stealing.
We also compared comeback rates for the Astros and the rest of the league before and after May 28 and found no significant differences in comeback rates for any inning. This is to be expected due to the small sample size for the Astros’ games. The Astros were not down at home in any inning more than twelve times before May 28.
*****
Section 2: Summary of the Evidence
We will now summarize our findings in terms of which results provide evidence that (i) the Astros’ performance was improved by sign-stealing and (ii) sign-stealing did not have a significant effect on the Astros’ performance.
Evidence Sign-Stealing Provided a Significant Advantage
In this section we list the evidence we found that indicates the Astros’ sign-stealing schemes aided their offense. We consider the possible effects of “Codebreaker” (used during both home and away games) and trash-can-banging (used only at home games).
- There is weak evidence that the trash-can-banging scheme helped the Astros swing at fastballs more frequently during their home games and at breaking balls less frequently during their home games.
- There is some evidence that the trash-can-banging scheme aided the Astros in swinging less often at off-speed pitches and pitches outside the strike zone during the Astros’ home games after May 28.
- The trash-can-banging scheme may have contributed to a large increase in the Astros’ home wRC+ after May 28. Although it was not uncommon for a team’s home wRC+ to increase by as much as the Astros’ after May 28, the Astros were the only team whose wRC+ increased by that much and who also had an above average wRC+ before May 28.
- The Astros had significantly more big run games than their opponents during the Astros’ away games. This suggests that “Codebreaker” may have helped the Astros have more big run games on the road. However, the Astros did not have significantly more big games at home, so it is difficult to conclude if this result is because of “Codebreaker” (which was used both at home and away).
- The Astros were significantly more likely than an average MLB team to come back in away games in the second, third, fourth, and seventh innings, which suggests that “Codebreaker” may have helped them comeback more than expected. But, since “Codebreaker” was also used during home games, and this trend was not apparent for home games, we cannot be certain that the Astros’ comebacks in away games are due to “Codebreaker.”
Evidence Sign-Stealing Did Not Provide a Significant Advantage
In this section we summarize the evidence we found that the Astros’ sign-stealing schemes did not affect their offense. We consider the possible effects of “Codebreaker” (used during both home and away games) and trash-can-banging (used only at home games).
- There were no significant differences in the Astros’ home and away swing rates at off-speed pitches and pitches outside of the zone, which suggests that trash-can-banging did not have an effect on those swing rates.
- Trash-can-banging may not have had an effect on fastball and breaking ball swing rates, as there were no significant differences in the Astros’ home swing rates at fastballs or breaking balls before and after May 28.
- There were no significant differences in the Astros’ home and away walk and strikeout rates, and there were no significant differences in the Astros’ home walk rates and strikeout rates before and after May 28. Together, these results suggest that trash-can-banging did not affect walks and strikeouts.
- The Astros’ year-long wRC+ was identical at home and on the road, which is unusual because most teams have a higher wRC+ at home than they do on the road. Overall, this suggests that trash-can-banging did not improve the Astros’ overall offense.
- The Astros did not have significantly more home or away big run innings than their opponents. This suggests that neither the trash-can-banging scheme nor “Codebreaker” helped the Astros increase their big run innings.
- The Astros did not have significantly more home big run games, which suggests that neither “Codebreaker” nor the trash-can-banging helped the Astros increase their home big run game rate.
- The Astros were not more likely than an average MLB team to come back at home in any inning, so trash-can-banging did not seem to help them come back. Likewise, they were not more likely to come back on the road in the fifth, sixth, eighth, or ninth innings, which suggests that “Codebreaker” may not have helped them come back, either.
Conclusion
The goal of this article was to compile and present evidence that the Astros’ sign-stealing tactics did or did not give them an unfair advantage on offense in 2017. We considered metrics that would have been directly affected by sign-stealing, like swing rates, and metrics that would have been indirectly affected by sign stealing, like comeback rates. As we have shown, there is compelling evidence in both directions, and we leave it to the reader to draw their own conclusions about the effects of the Astros’ sign-stealing schemes. When readers think critically of the evidence presented, they will realize there are likely other factors involved that we did not consider and that are not related to cheating. For example, we found that the Astros were more likely to come back during certain innings of away games than the rest of the league. This could be because of “Codebreaker,” but it is also possible that the Astros were just really good at hitting.
Likewise, we found that the Astros were more likely to swing at fastballs at home than they were on the road. This could be because of sign-stealing, but maybe there’s something about the batter’s eye in the Astros’ home stadium that helps them see fastballs better. Additionally, some of the metrics we used to measure the effects of cheating provided contradictory evidence, like wRC+, which was the same for the Astros at home and on the road, but it also increased dramatically after May 28. Overall, the evidence we present does not offer definitive proof and should not be interpreted as such. There are potentially other explanations for the phenomena we discovered, and cheating just happens to be one of them.
Despite the evidence shown in both directions, one thing is crystal clear: the Astros’ sign-stealing scandal has shaken the baseball world and tainted the integrity of America’s pastime. Whether sign-stealing unethically aided them or not, their actions are inexcusable, and their 2017 World Series title will always be associated with an asterisk of illegitimacy.
WILL MELVILLE joined SABR in March of 2020. He was an applied and computational mathematics undergraduate student at Brigham Young University when this paper was being written. He graduated in April 2020 and is now pursuing a career in baseball R&D as an intern with the Tampa Bay Rays.
BRINLEY ZABRISKIE, Ph.D., is an assistant professor in the Department of Statistics at Brigham Young University. She received a doctorate in statistics from Utah State University. She specializes in developing statistical methods to better analyze data with small sample sizes or rare events, with her current focus on meta-analysis data.
Notes
1 Ken Rosenthal and Evan Drellich, “The Astros stole signs electronically in 2017 — part of a much broader issue for Major League Baseball,” The Athletic, accessed March 30, 2020, https://theathletic.com/1363451/2019/11/12/the-astros-stole-signs-electronicallyin-2017-part-of-a-much-broader-issue-for-major-league-baseball/.
2 Billy Witz, “Red Sox Are Fined Over Theft Of Signals,” The New York Times, September 16, 2017, Sec D, 1. Accessed October 27, 2020, https://www.nytimes.com/2017/09/15/sports/baseball/red-sox-fined-stealing-signs-yankees.html.
3 Robert D. Manfred, Jr., Commissioner of Baseball, “Statement of the Commissioner,” accessed March 30, 2020, https://img.mlbstatic.com/mlb-images/image/upload/mlb/cglrhmlrwwbkacty27l7.pdf.
4 Jared Diamond, “‘Dark Arts’ and ‘Codebreaker’: The Origins of the Houston Astros Cheating Scheme,” Wall Street Journal, accessed March 30, 2020, https://www.wsj.com/articles/houston-astros-cheating-scheme-dark-arts-codebreaker-11581112994.
5 Tony Adams, “Sign Stealing Scandal,” accessed March 30, 2020, http://signstealingscandal.com/.
6 Michael J. Lopez, Gregory J. Matthews, and Benjamin S. Baumer, “How often does the best team win? A unified approach to understanding randomness in North American sport,” The Annals of Applied Statistics 12, no. 4 (2018): 2483–2516, https://projecteuclid.org/euclid.aoas/1542078053.
7 Bill Petti, “Data Aquisition Functions,” accessed March 30, 2020, http://billpetti.github.io/baseballr/data-acquisition-functions/.
8 “Splits Leaderboards,” FanGraphs, accessed March 30, 2020, https://www.fangraphs.com/leaders/splits-leaderboards?splitArr=.
9 Retrosheet, accessed March 30, 2020, https://www.retrosheet.org/.
10 Ronald L. Wasserstein and Nicole A. Lazar, “The ASA’s statement on p-values: context, process, and purpose,” The American Statistician 70, no. 2 (2016): 129–133, http://dx.doi.org/10.1080/00031305.2016.1154108.
11 Steve Slowinski, “wRC and wRC+,” FanGraphs, accessed March 19, 2020, https://library.fangraphs.com/offense/wrc/.
12 Brinley Zabriskie, “Methods for Meta-Analyses of Rare Events, Sparse Data, and Heterogeneity” (PhD diss., Utah State University, 2019), 18–75.
13 Ronald A. Fisher, Statistical methods for research workers (Edinburgh: Oliver & Boyd, 5th Edition, 1934).