

The Impact of the Blue Ribbon Panel on Collective Bargaining Agreements
This article was written by Kenneth Winter - Michael Haupert
This article was published in Spring 2018 Baseball Research Journal
“In baseball no team can be successful unless its competitors also survive and prosper sufficiently so that the differences in the quality of play among teams is not too great.”1
Introduction
 In July 2000 the Report of the Independent Members of the Commissioner’s Blue Ribbon Panel on Baseball Economics (BRP) was released. The members concluded that large and growing revenue disparities existed, which in turn led to chronic competitive imbalance among teams, and that the problem worsened after the 1994 strike.
The independent members were a truly impressive group, including former Senate Majority Leader George J. Mitchell, former Federal Reserve Board Chairman Paul A. Volcker, Pulitzer Prize-winning columnist George F. Will, and economist Richard C. Levin, president of Yale University. At least two of them have a reputation for notable independence. Volcker was the chair of the Fed for two intense terms. Will was notable as a conservative commentator who supported Nixon’s impeachment.2 In addition, there were representatives of 11 clubs on the full committee.
Not since the Cellar report, generated during the anti-monopoly hearings of the 1950s, had baseball been under such intense scrutiny for its off-the-field practices.3 A decade earlier, another study by a group established by the Collective Bargaining Agreement between Major League Baseball and the players had been untroubled by competitive balance. In fact, part of the BRP’s mission was to “determine whether the level of competitive balance since the report of the Joint Economic Study Committee in 1992 is markedly different than that observed during earlier periods.”4
The BRP concluded that the level of competitive balance was markedly different from recent years. It determined that competitive balance was impaired by structural characteristics and made several specific recommendations for economic changes in MLB.5
Our intention is neither to debate nor validate the conclusions of the BRP, but rather to focus on the outcomes of the BRP’s recommendations. Although much of the commentary focused on peripheral parts of the report, the real test of the BRP report is its influence on actual events. With the recent retirement of Bud Selig, it is a good time to assess the outcome of one of his signature accomplishments as commissioner. There are two critical questions that need to be asked in order to fully analyze the BRP. First, did the BRP influence collective bargaining agreements? And second, did those collective bargaining agreements lead to changes in the competitive balance of MLB? In this essay, we seek to answer the first question. The second is more complicated and will be the subject of future research.
We present data that generally support an affirmative answer to the first question. We conclude that while the BRP was ineffective in limiting the growth of extraordinarily large payrolls, it was successful at supporting other teams. Therefore, the BRP is part of the reason that MLB appears to be more competitive now than during the era the BRP studied.
THE PURPOSE AND RECOMMENDATIONS OF THE BLUE RIBBON PANEL
The purpose of the BRP starts with the title of the report: “The Report of the Independent Members of the Commissioner’s Blue Ribbon Panel on Baseball Economics” [emphasis added]. Unlike the previous report that came out of the CBA, the BRP came from the commissioner. This report was tailored for the owners. Indeed, 12 team owners, representing 11 teams, were members of the panel, and the report, while made public, was intended for MLB management. Actually, the recommendations of the report were the only part that was made public. None of the data used in the analysis by the committee were publicized, making it impossible for scholars to fully analyze the findings made by the committee.
There are two levels of focus for the BRP. The first is a decision on whether there is a problem with competitive balance. The second is the set of recommendations to correct the problem, if found. The BRP provided an answer to the competitive balance question on the first page of its report (emphasis in the original):
- Large and growing revenue disparities exist and are causing problems of chronic competitive imbalance.
- These problems have become substantially worse during the five complete seasons since the strike-shortened season of 1994, and seem likely to remain severe unless Major League Baseball (“MLB”) undertakes remedial actions proportional to the problem.
- The limited revenue sharing and payroll tax that were approved as part of MLB’s 1996 Collective Bargaining Agreement with the Major League Baseball Players Association (“MLBPA”) have produced neither the intended moderating of payroll disparities nor improved competitive balance. Some low-revenue clubs, believing the amount of their proceeds from revenue sharing insufficient to enable them to become competitive, used those proceeds to become modestly profitable.6
In this essay, we are not addressing the issue of whether the BRP was correct in its analysis of competitive balance. We will take the report at its word, and instead focus on the recommendations made by the BRP, and to what extent they were enacted. Much of the commentary about the BRP centered on the issue of profits, which are discussed in the report but do not play a significant part in the recommendations issued. The profits reported by the BRP might be subject to disagreement, but they are not the cause of the recommendations. In addition, chasing after profit data is a fool’s errand because profits can vary tremendously from year to year and team to team, even with similar revenues. Profits can be affected by subsidiary businesses, owner salaries and perks, and a variety of perfectly legal accounting rules that can be used to shift profits among units of a business and across time. And as closely guarded as MLB revenue data are, reliable profit data are nearly impossible to come by. Revenues are much less susceptible to manipulation, and can at least be approximated.7
Although there are many revenue streams for an MLB team, estimating revenue is not particularly complicated. Ticket prices and quantities sold are readily available, concession revenue is usually easy to estimate, there are payments from MLB, broadcasting revenue is specified in the contract and paid to the team, and there is advertising revenue, also usually fairly straightforward.8 Some teams have complex agreements with irregular cash payments, but by and large, revenue is much easier to determine than expenses and profits.
DOMINANCE OF LARGE PAYROLL TEAMS IN 1995-99
The first set of conclusions reached by the BRP will be considered in order. Are there large and growing revenue disparities and are they causing chronic competitive imbalance? As noted, we accept the BRP findings on competitive balance. The BRP presents convincing evidence that there are large and growing revenue disparities. Local revenues are growing at a healthy rate for all clubs, but the low-revenue clubs started from a smaller base and, even though their revenues may be growing at the same rate as the high-revenue clubs, they fall further behind in total revenue earned. For example, between 1991 and 2001 local broadcast revenue for both the Kansas City Royals and the Los Angeles Dodgers increased by 50 percent. In 1991 the Royals earned $5 million from local broadcast revenue, while the Dodgers earned $15.7 million, a $10.7 million-dollar gap. In 2001 that gap had grown to $16 million. As long as local revenues continue to increase at similar rates, the high-revenue clubs will increase their advantage over the low-revenue clubs.
In 1990 the gap between the top and bottom clubs in total revenue was $64 million. By 2001 it had ballooned to $138.5 million. During the 1990s total revenue for the top-ranked club grew by 96.3 percent while total revenue for the bottom-ranked club grew by 58.5 percent. In that same time span, the gap between the top and bottom payrolls grew from $14.3 million to $77.3 million.
We assume that the BRP was correct in identifying a chronic competitive imbalance problem. Our interest is in investigating the recommendations it made to address the imbalance, and in determining whether they were carried out, and with what result. The BRP concluded that competitive imbalance was a function of revenue disparities among clubs, which led to payroll imbalances. Hence, its recommendations tended to address these issues.
BRP RECOMMENDATIONS
After determining that competitive balance was a problem, the BRP proposed a set of recommendations to address the competitive imbalance:
- MLB should share at least 40 percent and perhaps as much as 50 percent of all local revenues, after local ballpark expenses are deducted, under a straight pool plan;
- MLB should levy a 50 percent competitive balance tax on club payrolls that are above $84 million;
- MLB should use unequal distribution of new Central Fund revenue to improve competitive balance, creating a “Commissioner’s Pool” that is allocated to assist low-revenue clubs in meeting a minimum club payroll of $40 million;
- MLB should conduct an annual competitive balance draft of players;
- MLB should reform the Rule 4 draft process; and
- MLB should utilize strategic franchise relocations when necessary to address the competitive issues facing the game.
- MLB should expand its initiatives to develop and promote the game domestically and internationally.9
In addition, the BRP concluded that adopting its recommendations would eliminate the need for contraction. Interestingly, just one year later, Commissioner Selig proposed a plan that would contract MLB by eliminating the Minnesota Twins and Oakland A’s. Obviously, the plan was not carried out, but one of the two franchises proposed for elimination, the Minnesota Twins, did get a new stadium.
Items (d) and (e) have not been implemented. Therefore, our analysis will focus on the remaining five recommendations as well as the recommendation not to consider contraction. MLB adopted the last two recommendations on the list and ultimately abandoned its contraction plan. These are much less significant than the first three, so we will deal with them first.
On contraction and relocating franchises to address competitive balance issues: The Selig proposal to contract two teams was controversial and led to legal action on multiple fronts. Selig and Jeffrey Loria, then the Expos’ owner and soon to be the owner of the Marlins, were sued for racketeering (eventually settling out of court) and Minneapolis won a temporary restraining order that forced the Twins to honor their lease and play the 2002 season in the Metrodome.10 Before the year was out the players and owners reached a new labor agreement and an extension of the Metrodome lease.11 In 2010, the Twins moved to Target Field, their new stadium a short distance away.
Contraction did not occur. Instead, strategic relocation was MLB’s answer to contraction. Although it was only used once, the move of the sagging Montreal franchise to Washington, D.C., in 2005 has been a great success so far.
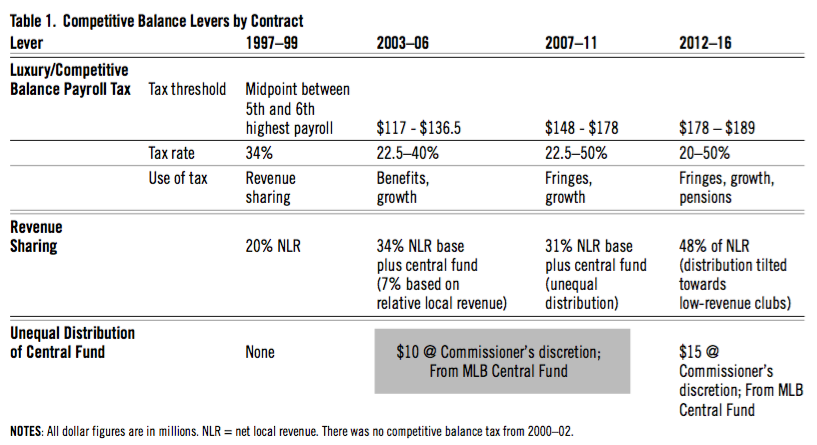
On expanding initiatives to develop and promote the game domestically and internationally: MLB has allocated resources to develop and promote the game domestically and internationally. This has been funded, at least in part, by the proceeds of the competitive balance tax. The tax, also known as the luxury tax, has developed over the years both in the way it has been implemented and used (Table 1).
(Click image to enlarge.)
The tax threshold, i.e. the minimum payroll at which teams must pay into the competitive balance tax fund, has grown from $51 million to $189 million and the rate at which offenders are taxed has waxed and waned between 20 and 50 percent, depending on how much and how often the threshold has been exceeded.12 Since 2003, one-quarter of the total amount collected has been directed toward the industry growth fund, dedicated toward promoting baseball in countries where organized baseball is not currently played.13
On sharing 40–50 percent of local revenues: We now turn to the first three recommendations, which are deserving of more attention because they are the big-money items. The biggest of these recommendations was for enhanced revenue sharing with an appropriate minimum club salary consistent with the proposal for the competitive balance tax.14
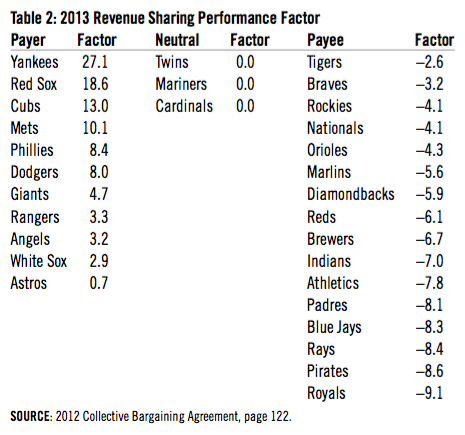
The CBA largely reflects the BRP proposal.15 The BRP recommended a straight pool revenue sharing plan instead of the split-pool plan because “some of the middle market clubs face a higher marginal tax rate than the highest revenue clubs.”16 The CBA provides for revenue sharing, though not a straight pool sharing plan, and not to the degree suggested by the BRP. The CBA has addressed the issue by creating revenue sharing performance factors (Table 2).
(Click image to enlarge.)
The performance factors are a function of market size, where market size is defined not by population, but total revenues. The calculation is more complex than we need to go into, but it results in higher revenue teams paying more into the pool than they receive, and lower revenue teams taking more out of the pool than they contribute. For example, in 2013, the Yankees, who led all MLB franchises with $461 million in total revenues, as well as payroll ($229 million), had a factor of 27.1 while the Twins, Cardinals, and Mariners had zero and the Royals, with total revenues of $178 million (lower than all but the Marlins—more on them later) had a factor of -9.1. This means the Yankees paid 27.1 percent of the fund, the Royals received 9.1 percent of the fund, and the Twins, Cardinals, and Mariners neither lost nor gained. Since the BRP supported unequal distribution of central fund revenues, this tweak to its proposal seems to satisfy that suggestion.
The issue to note concerning this plan is that it is based on revenues, not market size. Focusing on revenues tends to penalize successful teams and support unsuccessful teams. By “success,” we mean the ability to generate revenues, which is a primary goal of any business. The Yankees and the Mets, and the Cubs and the White Sox, share the same markets, but Table 2 shows that the National League team is more financially successful in Chicago while the American League team is more financially successful in New York.17 The result is that the Yankees contributed nearly three times as much to the revenue sharing pool as did the Mets, while the White Sox contributed less than a quarter as much as the Cubs, even though they share markets.
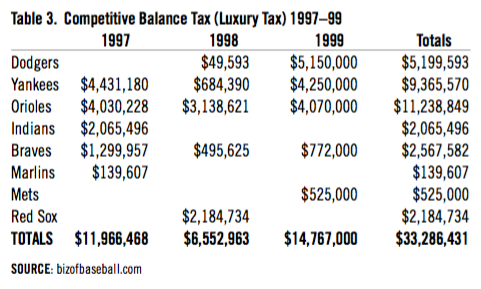
On levying a 50 percent competitive balance tax on payrolls above $84 million: MLB adopted a competitive balance tax, but not the one recommended by the BRP. As Table 3 indicates, the original luxury tax in 1997–99 raised an average of $11 million per year. The observation that the Orioles paid the most in taxes during that period while making the playoffs only once and winning only one playoff series reminds us that payroll without baseball acumen is not a recipe for success. These tax revenues were redistributed to teams like revenue sharing, with no restrictions on how they would be used by the teams that received them.
(Click image to enlarge.)
The BRP recommended an enhanced tax combined with a minimum payroll for teams sharing in the payout. They specifically rejected the floating threshold (the midpoint between the fifth and sixth highest payroll) used in the first version of the tax because higher spending led to a higher threshold and the threshold was determined by the spending behavior of the fifth highest-spending team, making it difficult for teams to control their tax obligations.18 Therefore, they recommended a 50 percent enhanced competitive balance tax on payrolls above $84 million, which was approximately the 1999 threshold that resulted from the 1996 Basic Agreement luxury tax.19 The proposal called for a constant $84 million threshold. Significantly, only teams with a minimum payroll of $40 million would be eligible to share the proceeds of the taxes collected. So while a minimum payroll was not implemented, incentives were put in place to encourage teams to observe the suggested minimum payroll.
The CBAs since then, beginning with the one that went into effect in 2003, have all had a competitive balance tax, but not the one the BRP envisioned (Table 1). Although the rates have grown to 50 percent in some cases, the threshold has floated up dramatically and the funds have not been distributed directly to the teams, though they do benefit them. About one-quarter of the proceeds go toward initiatives to develop baseball here and abroad (the aforementioned Industry Growth Fund), and the 2007 CBA mandated that the rest be used to fund benefits to players, as provided in the Major League Baseball Players Benefit Plan Agreements.20 Obviously, the tax revenues indirectly benefit teams because they are used to cover a cost that the teams would otherwise be required to pay out of their own revenues.
The competitive balance tax has essentially become a tax on the Yankees, though of late the Dodgers have become the largest contributors to the fund (Table 4). Since the fixed threshold debuted in 2003, the Yankees have paid 68 percent of the $477 million in taxes collected. The Dodgers have paid 24 percent, all within the last four years. The Red Sox run a distant third, accounting for 5.3 percent, and the Angels, Tigers, Giants, and Cubs have split the remaining 3 percent.

(Click image to enlarge.)
To summarize, the BRP recommendations for a competitive balance tax were generally ignored except for the name. The fixed threshold of $84 million was not adopted, the high tax rate was only adopted for teams exceeding the threshold repeatedly, the funds were not distributed like revenue sharing, and the minimum payroll was not adopted. Some of the funds were, however, used to popularize the game.
On using the new Central Fund revenue to improve competitive balance, creating a “Commissioner’s Pool” to assist low-revenue clubs in meeting a minimum payroll of $40 million: Giving authority to the commissioner to allow unequal distribution of the central pool seemed like a recommendation that was destined to be stillborn. Would the teams trust the commissioner? “Perhaps” would be an optimistic answer. Would the MLBPA trust the commissioner? The only two possible answers at the time seemed to be “no” and “absolutely not.” Yet the first new CBA (2003) after the BRP created a discretionary fund of $10 million.21 The Commissioner’s Discretionary Fund grew by 50 percent in 2012.22
The BRP had a big impact on this CBA outcome, despite the fact that Commissioner Selig was not a beloved figure at the time. Baseball analyst Jeff Sullivan spoke for many when he described this part of the 2012 CBA as “the Commissioner’s discretionary (i.e., slush) fund.”23 The evidence we have suggests the commissioner has used his discretion reasonably, due in no small part to the negotiating success of the MLBPA in establishing the parameters within which he can operate. He was given discretionary responsibility, and, based in part on his decisions, the players agreed to the fund’s increase in the 2012 CBA. The language regarding minimum payroll of $40 million did not make it into the 2012 CBA. Presumably, the commissioner could use his discretionary funds to help low payroll teams boost their payroll, since the distribution process required teams to indicate their planned uses for the distributed funds, but the commissioner was not restricted in his use of the funds in this way, nor was he required to use them to boost payrolls.
THE PROBLEM OF INTENTIONALLY UNCOMPETITIVE TEAMS
As Simon Rottenberg noted more than 60 years ago, the health of MLB (and for that matter any other professional sports league) depends on competition, hence the focus on the competitive balance issue.24 A major league team that loses only 30 games a year hurts the league as much as a team that wins only 30 games a year. The problem is that the financial structure of MLB is such that it may be more profitable to be uncompetitive than to try to build a winning club. The BRP concluded that low revenue clubs have used revenue sharing funds to become modestly profitable rather than competitive.25 As Red Sox owner John Henry complained to the Boston Globe in 2010, “Over a billion dollars has been paid to seven chronically uncompetitive teams, five of whom have had baseball’s highest operating profits. Who, except these teams, can think this is a good idea?”26
The Marlins have become the poster child for this dispute. In the 2012 CBA they were the only team to be singled out by name: “For purposes of the Base Plan in the 2012 Revenue Sharing Year only, the Miami Marlins’ Net Local Revenue will be $100 million.”27 The Marlins responded in November 2012 by sending Jose Reyes, Josh Johnson, Mark Buehrle, John Buck, and Emilio Bonifacio, along with their $180 million in contracts, to the Blue Jays. The following July, they sent Ricky Nolasco (at $11 million their highest paid player by a factor of four) to the Dodgers. They shed nearly 80 percent of their payroll in eight months but won only seven fewer games in 2013 than they had with their substantially higher payroll (7th highest in MLB) in 2012.
This seems like an obvious abuse of the intent of the revenue sharing plan, but the problem with that analysis is in assessing intent. Almost any team with a poor record and a low payroll could be charged with putting profits before performance. Revenue sharing has made baseball susceptible to teams that want to create profits without creating a winning team. Previous research suggests that teams that perform poorly on the field often fare better financially than competitive teams.28 The problem is that poor current performance may belie better outcomes in the future. The Pirates, Cubs, and Astros are recent examples of teams becoming successful cheaply by developing their own players and largely staying out of the free agent market.
The timing issue is about the baseball acumen involved. Back when the Rays were the Devil Rays they were accused of Marlinesque manipulations. But from 2008–13, following an ownership change, the Rays were a competitive team after having been a bottom dweller for their first 10 years. During the six-year span beginning in 2008, they were in the playoffs four times, won two playoff series plus a wild-card game, appeared in the 2008 World Series, and had a winning record each year. These accomplishments came while the Rays were in the bottom payroll quartile five times and the third payroll quartile once.
In previous research focusing on the financial documents for 2007–09 disclosed by Deadspin, Winter and Haupert noted that the “win rank for the Pirates . . . was never higher than their salary rank, bringing their baseball acumen into question.”29 They noted that Pittsburgh earned a profit of nearly $30 million during that period, which was more than the highly competitive Angels earned. The Pirates seemed to be another case of milking profits from an intentionally uncompetitive team. Yet in 2013, not even five years removed from Deadspin infamy, the Pirates had the third best record in the NL and the 27th highest payroll. They then appeared in the playoffs for three consecutive years, although they did not win a series. So in 2009 were the Pirates lacking baseball acumen, intentionally uncompetitive, or strategically building for the future?
In 2012 the Astros’ payroll was $61 million and they won 55 games. In 2013 their payroll was slashed to $22 million, less than Alex Rodriguez’s salary for that year, and they won 51 games. It looked like a short-term profit-maximizing move, but in 2015 the Astros won the wild-card playoff with a payroll of $71 million, which exceeded only the Marlins’ payroll of $68 million. And in 2016 their payroll leaped to $102 million but was still in the bottom half of the league. While they missed the playoffs, they once again had a winning record.
Clearly, there is an opportunity for low cost baseball success. It is equally clear that there is an opportunity for low cost economic success without an interest in baseball success. It will take judgment to determine the difference. Rule-based systems would cause clubs to live by the letter of the rule, though MLB appears to have used good judgment in punishing the Marlins and ignoring the Astros. While the Marlins increased their payroll each year from 2013 ($36.3 million) to 2016 ($125.4 million), their rank was 29th, 29th, 30th, and 25th out of 30 teams in those four years, and they finished each season with a losing record. Meanwhile, the Astros rebuilt their club and increased their payroll and improved their on-field performance as well.
The 2007 CBA provided for a limited opportunity for actions against revenue sharing recipient scofflaws, and that opportunity was vague and uncertain: “Each Club shall use its revenue sharing receipts (from the Base Plan, the Central Fund Component and the Commissioner’s Discretionary Fund) in an effort to improve its performance on the field.”30 The actions that could be taken in response were equally unspecified: “[T]he Commissioner may impose penalties on any Club that violates this obligation.”31 Of interest is the verb may rather than will. It allows the commissioner a great deal of latitude. For example, should first-time offenders go unpunished? What about teams that increase their payroll but not their performance? And what about teams that do the opposite? Should they all be treated equally? The commissioner has discretion. The players have no direct say in the matter. We are fans of rule-based systems, but it appears that discretion is appropriate in this area and the commissioner has wielded his well.
Besides singling out the Marlins for specialized 2012 revenue sharing, the 2012 CBA beefed up the opportunity for either MLB or the Players Association to take action.32 Section 5 of the 2012 CBA is much more specific than its 2007 counterpart. Certain actions, such as payment of acquisition debt, are declared inconsistent with the obligation to field a competitive team. The commissioner has the opportunity to require a team to submit competitive effort plans and pro forma financial statements. Requiring clubs to submit a rationale rather than conform to rules makes sense. The Players Association is also given a voice. If a team’s actual payroll is less than or equal to 125 percent of its revenue sharing receipts in a given year then in a grievance procedure the team has the burden of establishing that its use of revenue sharing receipts was appropriate.
CONCLUSIONS
The BRP had a substantial impact on the financial structure of baseball. In a simple counting, five of the seven proposals were adopted in the CBA agreements. From a quantitative point of view, these were the big numbers in revenue sharing. It has shored up the payrolls for the smaller and medium market teams and improved their ability to compete more regularly.
The recommendations led to the commissioner getting discretion in dealing with clubs that are trying to profit by fielding a non-competitive team. An examination of the history of low payroll clubs shows that discretion is necessary, and it appears that the commissioner has wielded such discretion in an appropriate manner.
The one failure of MLB and the BRP has been their goal to constrain the spending of the large-revenue-market teams. The top three payrolls are a larger percentage of the total than they were when the BRP identified the dollar gap as a major problem, and the dollar gap at the top is larger than ever.
The recommendations of the BRP were generally reflected in the CBAs of 2003, 2007, and 2012. Did they improve competitive balance in MLB? While we will address this question in more detail in later research, it does appear that by some measures, competitive balance improved in the new century. The problem is that the trend starts in 2000, before any of the BRP recommendations were initiated. The BRP should get some of the credit for shoring up the smaller teams, but the management of those achieving success on the cheap and those creating very expensive failures are part of the story. As a result, while revenue sharing has certainly enhanced the economic performance of the small revenue teams, it is not clear that it has helped them become more competitive on the field.
MICHAEL HAUPERT is Professor of Economics at the University of Wisconsin-La Crosse and co-chair of the SABR Business of Baseball Committee.
KENNETH WINTER is Chair of the Accounting Department at University of Wisconsin-La Crosse.
Notes
1 Simon Rottenberg “The Baseball Players’ Labor Market,” Journal of Political Economy 64, no. 3 (June 1956), 242-258.
2 Will was a minority stockholder in the Baltimore Orioles at the time of the BRP.
3 House Committee on the Judiciary, Organized Baseball, 82nd Congress, 1st Session (1951).
4 Richard C. Levin, George J. Mitchell, Paul A. Volcker, and George F. Will, “The Report of the Independent Members of the Commissioner’s Blue Ribbon Panel on Baseball Economics,” July 2000. (Hereafter BRP). The joint study committee was established by the 1990 CBA.
5 BRP, 53.
6 BRP, 1.
7 Most of the complex transactions like stadiums, multiple year contracts with bonuses, and owner and executive compensation are on the expense side of the ledger, and they provide the opportunity for unusual results or manipulation of profits over time and across businesses.
8 Computation of the payments from MLB to an individual team is a complex transaction, but the amount of the payment is not complex.
9 BRP, 46.
10 Murray Chass, “A Group’s Racketeering Suit Brings Baseball to Full Bristle,” New York Times, July 17, 2002; Dave Joseph, “Keep an Eye on Selig, Loria,” Sun Sentinel, July 17, 2002; Francie Grace, “Racketeering Suit Names Baseball Execs,” Reuters, July 17, 2002; Sarah Talalay, “Suit Against Marlins’ Loria Put on Hold Pending Arbitration Ruling,” Sun Sentinel, November 16, 2002
11 Brian Murphy, “Contraction nearly stole Twins baseball from Minnesota,” St. Paul Pioneer Press, July 10, 2014
12 For example, in the 2012 CBA, a team that did not exceed the threshold in the previous year, but does in the current year, paid a tax rate of 17.5 percent on the amount of the payroll in excess of the current threshold (which increased from $178 million to $189 million over the life of the CBA). For each consecutive year that a team exceeds the threshold, the tax rate rises. It is 30 percent in the second year, then 40 percent for the third consecutive year exceeding the threshold, and finally 50 percent for four or more years of consecutive payrolls in excess of the threshold. If a team falls below the threshold, that accounting starts over if they once more exceed it.
13 Major League Baseball Collective Bargaining Agreement, 2002, 99-100 (Hereafter CBA).
14 BRP, 39.
15 CBA, 2012, 121.
16 BRP, 38.
17 A higher performance factor means a team generated higher total revenues,
18 The floating threshold was set at the midpoint between the fifth and sixth highest payroll teams. So if the top four teams each spent $200 million on payroll but the fifth and sixth highest spent $190 and $110 million, then the threshold would be set at $140. But if the fifth highest spending team cut its payroll to $110 million, then the threshold would fall to $110 million. Through no action of its own, a team would see its tax obligation increase.
19 BRP, 39.
20 CBA, 2007, 103.
21 CBA, 2002, 103, 107.
22 CBA, 2012, 123.
23 Jeff Sullivan, “Your Complete Summary Of MLB’s New CBA,” SBNation, November 23, 2011, https://www.sbnation.com/2011/11/23/2581637/major-league-baseball-cba-labor-agreement.
24 Rottenberg “The Baseball Players’ Labor Market.” See the quote at the beginning of the paper
25 BRP, 1.
26 Maury Brown, “Revenue Sharing Is Making an Impact,” Baseball America, March 2, 2010, http://www.baseballamerica.com/today/majors/season-preview/2010/269597.html.
27 CBA, 2012, 121.
28 Ken Winter and Michael J. Haupert, “MLB Leaks Financial Statements: A Factual Analysis,” in The Cooperstown Symposium on Baseball and American Culture 2011-12, William M. Simons, ed. (Jefferson, NC: McFarland & Co., 2013).
29 Winter and Haupert,106.
30 CBA, 2007, 112.
31 CBA, 2007, 112.