

The Mystery of the Disappearing Three-Bagger
This article was written by Theo Tobel
This article was published in Fall 2022 Baseball Research Journal
[I]n my book the most exciting play in baseball is a three-bagger. […] You used to see a fair number of them in the old days, but now they’re the rarest plays in baseball. For sheer excitement, I don’t think anything can beat when you see that guy go tearing around the bases and come sliding into third or into the plate, with the ball coming in on a line from the outfield at the same time.” — Tommy Leach, holder of the record for most triples (4) in a World Series1
Over the past 100 years, there has been a steady increase in home runs and a decline in triples in the American and National Leagues. As home runs have climbed, triples have nearly fallen off the scorecard. As shown in Figures 1 and 2, the rate of triples in 1900 was almost four times greater than the rate in 2020, and the rate of home runs in the early twentieth century was three-fourths less than the present-day rate.

The “long ball revolution” is generally attributed to the game’s evolving focus on developing hitters with greater power, capable of slugging home runs— the best possible outcome for an at bat. But is the concerted focus on hitting home runs the cause of the downward trend in triples, or are there other unquantified factors at play?
Another factor that has been widely supposed in the baseball community is the shrinking of MLB stadiums.2 Over time, new stadiums have been constructed (and reconstructed) with smaller and more uniform fields of play than the older ones, and in this paper I aim to confirm that this factor solves the mystery of the disappearing three-bagger.
I gathered stadium data from the Seamheads Ballparks Database.3 As a measure of the size of the ballpark, I used the distance, in feet, from home plate to center field (“center-field distance”). Although center-field distance is not a perfect indicator of a ballpark’s size, since there may be varying distances to left or right field, center-field distance sufficiently represents stadium size for purposes of this study. I only included ballparks from 1906 onwards, due to the lack of available dimensions from earlier fields. I then used R to analyze the dataset.
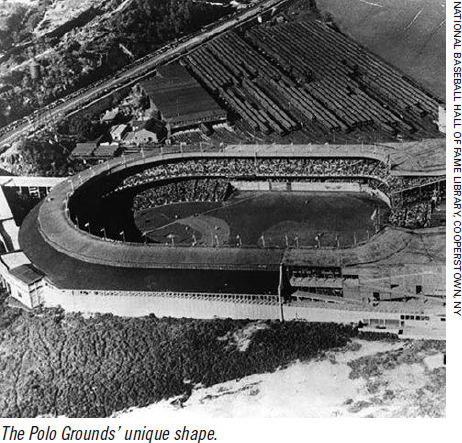
Early twentieth century ballparks in the NL and AL were a clutter of mismatched sizes, with some ballparks extending more than 500 feet to center field, such as the Huntington Avenue Grounds (530 feet), Exposition Park (515 feet), and Ebbets Field (507 feet), to name a few. Ballparks of this era also varied widely in terms of shape. One striking example is the New York Giants’ Polo Grounds, known for an elongated field shape.
As time passed, the size of ballfields grew increasingly homogenous, in part due to a rule implemented by both leagues in 1958 mandating a minimum centerfield distance of 400 feet.4 Enormous ballparks like the Huntington Avenue Grounds gradually disappeared; today, not one ballpark has a center-field distance exceeding 420 feet.
To illustrate how ballparks league-wide changed year to year, I found the mean and standard deviation for the center-field distance of every big-league ballpark in every year, from 1906 to 2019 (Figure 3).
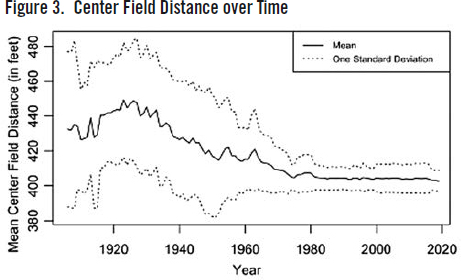
This graph confirms that over the last one hundred years, ballparks have become increasingly homogenous in center-field distance, based on the following characteristics:
1. The negative slope of the solid line demonstrates that center-field walls in stadiums nationwide have moved closer to home plate as time passed.
2. The range of center-field distance among MLB ballparks at present—and in the last half century or so—is unmistakably smaller than the range in the early twentieth century, as shown by the smaller space between the dotted lines (plus/minus one standard deviation).
From this starting point, I will show that playing fields that are smaller and more uniform in size have directly resulted in greater percentages of home runs and correspondingly fewer triples. Closer fences increase the likelihood of deep fly balls and line drives going out of the park, and smaller playing fields offer less space in which the ball can roll around, giving the baserunner less time to reach third base.
SMALL-SAMPLE EXAMPLES THAT SUPPORT THE HYPOTHESIS
Initially, to test my assumptions, I explored three ballparks that underwent dimensional changes to determine if there was a change in triple rates. These anecdotal examples are a preface to the full hypothesis test that follows, which includes data from all ballparks whose size decreased after 1906. I first investigated one of the most iconic ballparks in baseball history: Fenway Park. The center-field distance was 468 feet in 1933, but shrunk to 389 feet before the 1934 season.
With this stadium change, triples changed from being hit 1.3% of at bats in 1933 to 0.9% of at bats in 1934. Notably, this would be the last change to the center-field dimensions for Fenway Park; maybe the Red Sox owners didn’t want to see the triple disappear completely!
In 1960, the center-field fence at windy Candlestick Park was 420 feet away from home plate. In 1961, that fence was moved ten feet closer to home plate. Like Fenway before it, Candlestick’s triple rate dropped off after the size change. The “Say Hey Kid” alone accounted for a portion of the swing: Mays smacked four triples at Candlestick in 1960 but zero in 1961, while seeing an upswing in homers, hitting 11 more home runs than the previous year, 9 of them at Candlestick.
Lastly, Minute Maid Park, home of the Houston Astros, had a well-known and unique feature, Tal’s Hill: a patch of grass that sloped upwards to a center field wall. Not only was Tal’s Hill a slope, but it also had a large flagpole just to the left of straightaway center, which made it a “triples heaven” as outfielders scrambled to track down hit balls. Did removing it after the 2016 season—and shortening the distance to the center field wall—diminish triples?
Yes. With a Tal’s Hill-less Minute Maid, the distance to center field shrank by 27 feet and as a result, the triples rate in 2017 was less than half that of the year before.
These initial results encouraged me to run a full hypothesis test on all of the post-1906 data.

HYPOTHESIS TESTS
To test the hypothesis statistically, I used not only the home team’s data (home runs and triples per at bat) but also the away team’s data at each ballpark, resulting in data by park for each year.
Then I filtered every year in which the center-field dimensions changed for a team. Since my hypothesis is that smaller ballparks decrease triple rates and increase home run rates, I collected extra-base-hit rates for the year the ballpark changed its center-field dimension, and the year prior to the change.
Then, I calculated the change in center-field distance, and gathered all the “negative” differences between the dimension for the year of change minus the dimension for the prior year. A negative difference would mean that the ballpark’s dimensions in the previous year were greater—in other words, smaller ballparks. I then took the means for the triple and home run rates for before and after the stadium change:
Average 3B/AB for year before change = 0.0093
Average 3B/AB for year after change = 0.0088
Average HR/AB for year before change = 0.0192
Average HR/AB for year after change = 0.0208
To calculate whether these differences are significant, I used a paired t-test with the following conditions:
![]()
H0: Smaller center-field distance has no effect on triples per at bat (true difference in means = 0).6
Ha: Smaller center-field distance decreases the rate of triples per at bat (true difference in means < 0).
t = -2.5632
df = 141
p-value = 0.005709 < 0.025, reject H0.
H0: Smaller center-field distance has no effect on home runs per at bat (true difference in means = 0).
Ha: Smaller center-field distance increases the rate of home runs per at bat (true difference in means > 0).
t = 2.36
df = 141
p-value = 0.009823 < 0.025, reject H0.
The two above hypothesis tests strongly support the alternative hypothesis. The sample size is large and the p-values are much lower than the significance level. We can conclude from these data what has been presumed for many years: smaller stadiums lead to a lower number of triples and a higher number of home runs.7
REGRESSION ANALYSIS
I also ran a regression model on all ballpark data to see the overall effect of center-field dimension on triples per at bat. By accounting for year and team in a multivariable regression model, I found that decreasing center field dimensions by one foot leads to an average decrease in triples per at bat of 0.47% with a p-value of < 0.001. While this seems like a small percentage, the maximum average league center field distance (429 feet) in 1923 against the average in 2019 (403 feet) predicts the change in center field dimension to be responsible for a 12% decrease out of the actual 65% decrease in that timespan—a weighty piece of the puzzle.
To illustrate, the same team from the same year plays in two different ballparks: one with a center-field distance of 430 feet and another with a center-field distance of 400 feet. If 15 triples are hit in 1000 at bats in the bigger ballpark, we would expect about 13 triples to be hit, in the same number of at bats, in the smaller ballpark.
CONCLUSION
Although this study has its shortcomings—such as quantifying stadium size with center-field distance, and ignoring other confounding variables (additional field characteristics, the baseball itself from year-to-year, etc.)—the hypothesis was strongly supported in a paired t-test and multivariable regression model: smaller ballparks are a significant factor contributing to the disappearance of the three-bagger. So if you happen to see a triple when you take in a game—whether on TV or in attendance at one of today’s cozier stadiums—consider yourself lucky! You’ve seen a rarity.8
THEO TOBEL is a senior at Santa Monica High School. In his spare time, Theo enjoys watching Dodger baseball and making wood baseball bats on his lathe at home. He combines his love for baseball and mathematics by studying baseball analytics. Theo can be reached at theotobel@yahoo.com and his baseball blog can be found at theobaseballblog.wordpress.com.
Acknowledgments
A special thank you to Professor Jeremy Losak, Phil Birnbaum, Jonah Richards, Jonathan Schwartz, and the creators of the Seamheads Ballparks Database.
Sources
Collelo, Thomas. “Demise of the Triple,” The Baseball Research Journal, 18 (1989): 43–44.
Sports Reference LLC. Baseball-Reference.com—Major League Statistics and Information. Accessed September 30, 2022. https://www.baseball-reference.com.
https://github.com/theodoretobel/The-Mystery-of-the-Disappearing-Three-Bagger.
Notes
1. Lawrence S. Ritter. The Glory of Their Times. (Vintage Books, 1985), 33.
2. There have been a variety baseball statisticians and savants such as Bill James and Tom Tango who have written about “park factor,” an all-encompassing statistic of a ballpark’s effect on outcomes. However, I have yet to find an analysis on the direct effect of dimension changes on extra base hit rates.
3. Seamheads.com Ballparks Database. Accessed September 30, 2022. https://www.seamheads.com/ballparks/index.php.
4. Curiously, a handful of present-day ballparks defy the MLB minimum distance rule, maintaining a center-field distance of less than 400 feet (exactly four as of 2019: Fenway Park, PNC Park, Petco Park, and Oracle Park). These smaller ballparks fall into two categories: those that were “grandfathered” in, and those that simply break the rule. For example, Fenway Park is a grandfathered ballpark, as its last reconstruction of the center-field distance was in 1936 (390 feet), 22 years before the MLB rule was implemented. PNC Park of the Pittsburgh Pirates is an example of a rulebreaker. Although constructed after the institution of the minimum center-field distance rule, PNC’s center-field distance is 399 feet.
5. “Bonferroni Correction.” Wolfram MathWorld. Accessed September 30, 2022. https://mathworld.wolfram.com/BonferroniCorrection.html.
6. Note that the true difference in means is the previous year rate minus the change year rate—thus, if the rate of triples was greater in the previous year than the change year (a decrease), then the true difference in means <0.
7. The differences in each sample (home runs and triples) were checked for normality with a Q-Q plot and the distribution was proven to meet the assumptions of the paired t-test.
8. While collecting data for this study on triples, I stumbled across the following triple of fun facts: 1) The highest rate of triples at a stadium in one year was at 1912 Forbes Field. 2) The last person to hit four triples in a game was Bill Joyce in 1897. 3) Evan Gattis hit eleven triples in 2015—and only 12 total triples in his career.