The Relationship Between WAR and the Selection of Annual Performance-Based Awards
This article was written by Benjamin Alter
This article was published in Spring 2023 Baseball Research Journal
It has been over 20 years since Baseball Prospectus developed the statistic “Wins Above Replacement Player” (WARP), and 12 years since Sean Smith’s Wins Above Replacement (WAR) was first posted on Baseball-Reference.com.1 WAR now is widely recognized as a useful metric for assessing a ballplayer’s overall performance.
Several performance-based awards are given to players each year, with three of them based on balloting by the Baseball Writers Association of America (BBWAA): the Most Valuable Player Award, the Cy Young Award, and the Rookie of the Year Award.2 If balloters cast their votes for the players with the best statistics (and WAR is a valid measurement of their performances), then the top vote getters should be the non-pitchers with the highest WARs and the pitchers with the highest pitching WARs (pWARs). This paper explores the relationships between WAR and the win ners of the three ballot-based performance awards over the years.
THE MVP AWARD AND WAR
The BBWAA has chosen MVP awards for each league since 1931. Previous incarnations of the MVP award include the Chalmers Award, which was given out from 1911 to 1914, and League Awards, which were given out from 1922 to 1929. The winners of these awards are not included in this study, mainly because previous winners were not eligible to win again, invalidating one of the bases of this study.
The BBWAA does not offer a clear definition of what “most valuable” means, leaving the judgment to the individual voters. Among its official criteria are the player’s “strength of offense and defense,” the number of games played, and the player’s “general character, dis position, loyalty and effort.”
Initially, one BBWAA writer in each city with a team filled out a ten-place ballot, with ten points for the recipient of a first-place vote, nine for a second-place vote, and so on. The BBWAA began polling three writers in each league city in 1938, and reduced that number to two in 1961. Beginning in 1938 more weight was given to the first-place vote, increasing it from 10 points to 14.
Several previous studies have tried to identify the statistical drivers that correlate well with MVP ballot ing, including Wood (1999), whose dataset also begins in 1931, and Hanrahan (2003), which uses 1938 as its starting date. Silver (2003) was an early study using sabermetrics as its basis, which used WARP3, a derivative of WARP.
This paper assesses the relative weight placed on individual-based statistics, team-based statistics that are not used to determine bWAR, and subjective factors. MVP winners since 1931 are grouped by decade and then by their bWAR ranking. Excluded from this analysis are instances where relievers were named league MVP, because relievers invariably have much lower bWARs than non-pitchers and starting pitchers.3
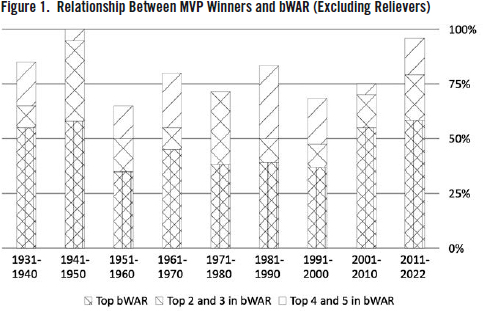
Figure 1 shows how often the players in the top five in bWAR in their league have been the MVP. In the first 20 years of the modern MVP award, it was quite common for the MVP to be in the top 5 in bWAR. Only MVP winners Frankie Frisch (1931), Mickey Cochrane (1934), Gabby Hartnett (1935) and Marty Marion (1944) were not in the top 5 in bWAR.
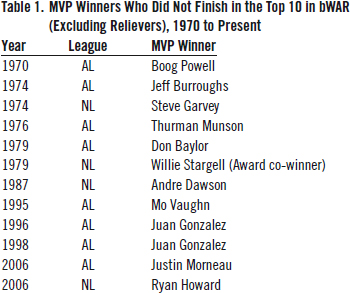
MVP winners with bWARs outside the top 10 became much more common in the 1970s. Table 1 lists the 12 MVP winners since 1970 who finished outside the top 10 in bWAR. Nine of these MVP awardees played for division-winning teams. The three exceptions—Jeff Burroughs, Andre Dawson, and Ryan Howard—led the league in RBIs, a team-dependent statistic not used in calculating bWAR.
MVP winners with relatively low bWAR-related metrics all but disappeared by 2008. In the last 15 seasons, only one MVP winner (Bryce Harper in 2021) failed to finish in the top 5 in bWAR (Harper finished ninth among non-pitchers). Sixteen of the last 28 MVPs led their league in bWAR.
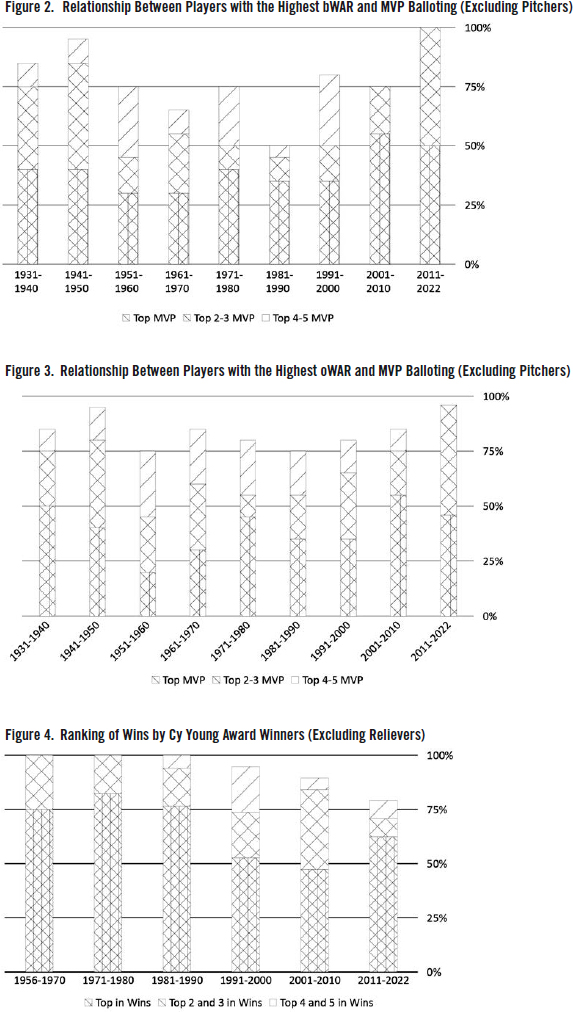
How have the league leaders in bWAR fared in MVP balloting? Figure 2, which shows how frequently the league leader in bWAR finished in the top 5 in MVP balloting, has many similarities to Figure 1. It shows the same drop in the 1950s, fewer players in the 1960s, and even fewer in the 1980s. The relationship between MVP winners and bWAR leaders has been even more pronounced in the last 12 years than the relationship between top MVP vote-getters and bWAR. All 26 MVP winners dating back to 2010 have been in the top three in bWAR.
Whereas there is an increased preference for players with high bWARs, in certain time periods there was an even higher preference for players with high offensive WARs (oWARs). Figure 3 shows how often players in the top 5 in oWAR for their league have won the MVP award. Voters clearly leaned toward high oWAR in the 1960s, the 1980s, and the 2000s. Since 2011, the difference between bWAR and oWAR in MVP balloting has all but disappeared
In summary, MVP voters have long used offensive statistics to inform their choices for the MVP award (excluding pitchers). In the “Analytical Age” (James 2020), their choices continue to be aligned with offense, although they are more closely aligned with bWAR, which also takes into account defensive metrics and does not take into account team-based statistics. The reason for this change may be the increased awareness and general acceptance of bWAR as a valid statistic for measuring a player’s performance.
(Click image to enlarge)
THE CY YOUNG AWARD AND pWAR
From 1956 to 1966, the BBWAA issued just one Cy Young Award per year, after which awards were given to one pitcher in each league. In 1956 and 1957, Cy Young Award winners were ineligible to win a second time. Writers voted for only one pitcher until 1970, when each writer was allowed to vote for three pitchers, with the first-place vote worth five points, the second-place vote three points, and the third-place vote one point.
As shown on Figure 4, pitchers who led their league or were close to the league lead in wins, a team-based statistic, usually won the Cy Young Awards for most of the award’s existence (the graph excludes relievers who received the Cy Young Award, since relievers are rarely among the league leaders in wins).4 This dynamic changed in 2010, when Felix Hernandez won the Cy Young Award with just 13 wins. Jacob deGrom in 2018 and 2019 and Corbin Burnes in 2021 won the Award with 10, 11, and 11 wins, respectively, suggesting that the pattern has permanently changed. An exclamation point was added to this dynamic when Kyle Wright, the only 20-game winner in 2022, finished a distant tenth in Cy Young balloting.
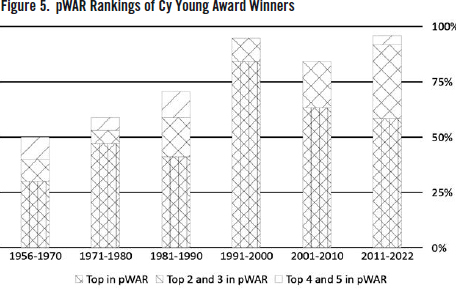
Conversely, starting in the mid-1980s (long before the Analytical Age), there has been a pronounced in crease in the alignment between Cy Young balloting and the metrics that are used to calculate pWAR, as shown on Figure 5. In the last five years, five of the ten Cy Young award winners (deGrom in 2018 and 2019, Burnes in 2021, as well as Trevor Bauer in 2020 and Sandy Alcantara in 2022) have not finished in the top 5 in wins. Wins and pWAR are clearly going in different directions.
THE ROOKIE OF THE YEAR AWARD AND bWAR
The BBWAA has selected Rookies of the Year since 1947. In the first two years of the award, only one player was chosen from both leagues. Starting in 1949, ROY awards have been given in each league. Until 1957, the term “rookie” was undefined, and voters were given discretion regarding who qualified as a rookie. In 1971, rookies were defined as players with fewer than 130 at-bats, 50 innings pitched, or 45 days on the active roster of a major league club (excluding time in military service or on the injury list) before September 1. Since 1980, voters have named three rookies on their ballots, with five points going to their first-place choice, three points to their second-place choice, and one point to their third-place choice.
How do the ROY winners shape up with regard to bWAR? Since the number of rookies receiving votes has varied widely and there is no handy list of players who are rookies in a given year, the ROY winners are compared only with the other rookies who received votes that year.
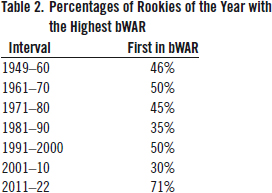
Table 2 shows the percentage of ROY winners who had the highest bWAR among vote-getters. From 1949 to 1981 and from 1992 to 2001, roughly half the ROY winners had the highest bWAR among vote-getters. Of particular note is the huge jump in ROY winners with the highest bWAR since 2010.
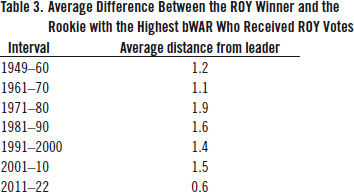
Table 3 shows the difference between the bWAR of the ROY winner and the vote-getter with the highest bWAR (excluding years in which vote-getter with the highest bWAR won). As with Table 2, Table 3 shows a drastic decrease in the difference between vote-getters with the highest bWAR and the bWAR of the seven ROY winners from 2011 to 2022 who didn’t have the highest bWAR.
In conclusion, rookies with relatively high bWARs fared far better in ROY balloting in the past twelve years than in the previous 62 years. As in the case of the MVP award, this change aligns with the increased awareness and general acceptance of bWAR as a valid statistic for measuring a player’s performance.
CONCLUSIONS
In the last 12 years, votes for the MVP and Rookie of the Year awards have become closely aligned with performance as measured by modern sabermetrics, specifically by bWAR and pWAR. These alignments correspond to the date when bWAR was first posted on Baseball-Reference.com. The Cy Young Award, which has been aligned with the metrics taken into account by pWAR since the mid-1980s, has since 2010 shown a decreased alignment with a pitcher’s win total, a team-based statistic that is not used in calculating pWAR. The timing of these changes with the increased availability of bWAR statistics is most likely causational.
BENJAMIN ALTER published an article in the Fall 2022 Baseball Research Journal. Last summer, he co-delivered a paper at SABR’s annual Jerry Malloy Negro League Conference. Prior to retiring in 2021, he was a principal with an environmental consulting firm, authored a textbook on environmental consulting, and was an adjunct professor at the City University of New York (CUNY). When not pursuing his passion for baseball, Mr. Alter pursues his many other passions, including music, fitness, history, and geology.
Sources
Baseball Almanac. 2008. Rookie of the Year Award/Jackie Robinson Award.
Baseball-Reference.com. Last accessed on November 16, 2022.
Baseball-Reference.com. WAR Comparison Chart, accessed on October 26, 2022.
Baseball-Reference.com. WAR Explained, accessed on October 26, 2022.
Baseball Writers Association of America website: bbwaa.com, accessed on October 26, 2022.
Cely, Monte (2007). “The Cy Young Award: Individual or team recognition?” Baseball Research Journal No. 35, 48-51.
Gillette, Gary and Pete Palmer, 2007. The ESPN Baseball Encyclopedia (Fourth ed.). New York: Sterling Publishing Co., 1763.
Hanrahan, Tom, 2003. An MVP voting model (Part I). By the Numbers, Vol. 13 No. 3, 18-28.
James, Bill, 2020. “Three looks at the MVPs.”
billjamesonline.com/three_looks_at_the_mvps/, accessed on October 29, 2022.
Kepner, Tyler. 2011. “Where Do You Find Value? Discussing the M.V.P Criteria.” The New York Times, SP3.
Silver, Nate, 2003. “Lies, Damned Lies: WARPed MVP voting.” Baseball Prospectus.
Vass, George, 1998. “History of the rookie award filled with controversy.” Baseball Digest. 57 (7): 26.
Wood, Rob, 1999. What drives MVP voting? By the Numbers, Vol. 9 No. 1, 12-17. [10].
Notes
1. Baseball Reference (bWAR) and FanGraphs (fWAR) have similar but different versions of WAR (bWAR and fWAR, respectively). This paper uses Baseball Reference’s bWAR.
2. Other awards given to players, such as Gold Glove Awards, Silver Slugger Awards, and Rolaids Relief Man Awards, are either not done by balloting, or the results of the balloting are not provided to the public; therefore, the basis of these awards are not amenable to quantitative analysis.
3. James (2020) does a similar analysis, also employing Win Shares in the analysis. The conclusions of that analysis are similar to the conclusions of this study. It also should be mentioned that some people believe that pWAR undervalues the contributions of relievers.
4. Cely (2006) analyzes the relationship between the Cy Young Award and other conventional statistics, such as ERA, strikeouts, and WHIP It also investigates the relationship between the Cy Young Award and team performance.


