The Rise and Fall of Scoring at the College World Series
This article was written by W.C. Madden
This article was published in 2003 Baseball Research Journal
When the College World Series began in 1947, the wooden bat was the only weapon in the batter’s arsenal. Scores were typical of the times with scoring for the two teams averaging about eight to eleven runs per game. By 1972 and 1973, that average had dipped to seven runs per game, a number that was soon history as the NCAA made some changes.
In 1984, the NCAA decided to allow hitters to use aluminum bats during the season and in the CWS. The ostensible reason was saving money: metal bats were much more expensive, but they outlasted their wooden counterparts ten times over. The mental monsters didn’t break and they were only pulled when they developed flat spots. The NCAA also decided that year to implement the designated hitter rule like that used in the American League. Pitchers would no longer be required to bat.
The seven runs per game average became a memory, as did almost all of the batting records. Within six years, every record was shattered, not counting the first three years of the series because of the limited amount of games in those days.
The first record to go was the doubles mark of 34, topped by one in 1975. That record continued to be broken. Next to go was the home run record; the mark of 17 was broken with 21 in 1976. That record continued to rise as coaches turned to the long ball more for run production. The highest batting record of .266 (except for .314 in 1948 when only two teams played) set in 1971, was broken in 1977, when the average moved up to .284. The record continued to rise as well.
The slugging percentage was also easily surpassed that year as the benchmark of .365 was raised to a robust .419. That record also continued to rise through the years. The average number of runs scored (11.5) was broken in 1979 when 11.6 runs were scored. That too continued to increase through the years, too. Corresponding with that was a rise in the RBI record as well (144 to 153). The hits record (272) went by the wayside in 1979 when 294 hits were made. The only record that did not fall and still stands today is the triples mark: the record is 22 three-base hits in 1962. Interestingly, the number of triples has decreased steadily through the years till it reached less than 10 per year after 1992.
While the hitting records generally climbed, pitching records, not unexpectedly, went in the other direction. Before 1974, the highest ERA was 4.32. That was broken in 1978 (4.78) and continued to rise. Shutouts took a nosedive and, mirroring the majors, the number of complete games rapidly decreased. Before 1973, an average of about 13 complete games were registered per year out of the 15 games held. But 1977 was the last year that complete games were in the double digits. Before 1974, the record number of shutouts was six; since then the high has been three. For one six-year stretch, 1996 to 2001, no shutouts were thrown. Nowadays, complete games and shutouts are a rarity, but on the flip side, the number of saves has risen.
The eclipsing of hitting records reached a peak in 1998 when the series was dubbed “gorilla ball” because of the prolific scoring. Bat manufacturers were creating more powerful bats, and colleges were producing prolific home run hitters. It read like a football score in the championship games when USC whipped Arizona State, 21-14. Wes Rachels knocked in a record seven runs for USC in that game. The 1998 Series shattered numerous records: batting average (.318), hits (327), home runs (62), RBI (212), total bases (558), and slugging average (.543). The average number of runs went up to 16 a game. ERA zoomed to 7.24. With no complete games or shutouts recorded, the save record was also broken by nine.

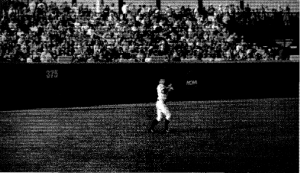
Rosenblatt Stadium’s power alley in left center used to be 360 feet before the walls were moved back before 2002 to 375.
By 1998, many of the individual hitting records had also been broken. Bud Hollowell’s record of four home runs in a Series in 1963 was tied six times by 2000. J. D. Drew of Florida State and Edmund Muth of Stanford each hit three home runs in a game for a record. Drew also set the most total bases record (12), which was later Lieu. Even the doubles record went by the wayside in 2003 when Ryan Garko of Stanford hit four in one game. LSU set the record for most home runs (8) in a 12-10 win over USC in 1998.
The NCAA decided it was high time to make some changes to tone down the scoring barrage. They put limits on the bat manufacturers and moved the walls back in Omaha before the 2002 Series. Rosenblatt Stadium officials moved the fences back fifteen feet in the power alleys and three feet down the lines. The height of the walls varied between two feet and ten feet in center and eight feet elsewhere. A balance returned as averages declined.
By 2003, coaches were talking more about “small ball,” instead of “long ball,’ Even the home run hitting contest was discontinued. The only offensive record eclipsed in 2003 was hit batsmen.
W. C. MADDEN of Fishers, Indiana is the author of the College World Series Record Book and a history of the College World Series, which will be published by McFarland later this year. He has also written several other baseball books, including History of the Western League and two books about the All-American Girls Professional Baseball League.


