

The Specialized Bullpen: History, Analysis, and Strategic Models for Success
This article was written by David Hooley - John Daniels - Sara Andrasik
This article was published in Fall 2018 Baseball Research Journal
A great deal of attention has been given to the baseball closer, particularly since the save was officially recognized in 1969. But the modern bullpen is now multidimensional, complete with analytics and new algorithms, and this should give a manager more weapons with a late-game lead. This paper discusses the evolution of the specialized bullpen, how it has affected baseball, and how much the specialized bullpen contributes to a significant playoff run. This research should reinforce some accepted baseball adages and provide some examples that less is sometimes more.
INTRODUCTION
 Pitch counts are now an integral part of the game. No more “Iron Man” Joe McGinnity pitching both games of a doubleheader. Arms are now too expensive — some would argue too fragile — to be taxed to any extremes. Pitchers, of course, want to stay in as long as possible. But the complete game is now the exception and the modern bullpen is an integral part of strategy.
In well over a century of professional baseball, the strategic bullpen was born and has evolved, mutated, and been continuously refined by innovative managers. The bullpen is the home of the relief specialist. The origins of the term “bullpen” are debated, but it has always been the area where the relief pitchers get to sit. Until 1889, the rules stated that no player substitution was allowed except for injury or sickness. An ineffective starting pitcher would simply change positions with another player on the field. The replacement was known as a “change” pitcher. After 1889, a player substitution could occur at any time and the bullpen was officially born.
Since starters were regarded as the team’s best pitchers, the first relief pitchers were often the starters, who might pitch a few innings between scheduled appearances. Today, this is rarely seen except during the postseason. It was more common in the early years of the bullpen. In the 1920s and ’30s, Hall of Fame starters Waite Hoyt, Dizzy Dean, Carl Hubbell, and Lefty Grove each led the league in saves once — though no one knew it until the metric was invented decades later.
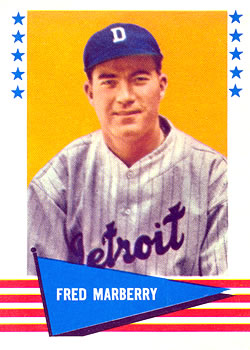
As time wore on, the use of the bullpen as a home for individual specialists began to emerge. Although subject to debate, one of the first recognized relief specialists was Firpo Marberry. His relief work for the Washington Nationals and Detroit Tigers in 1923–36 included 20 saves in a season (awarded retroactively), more than 50 relief appearances in a season twice, and 365 relief appearances. The leagues took notice and other specialists like Johnny Murphy, Joe Page, Hoyt Wilhelm, and Elroy Face made important contributions.
By the 1970s, the “fireman” was an accepted role on a team. Some were heavily relied on, like Mike Marshall, with his 106 games and 208⅓ innings pitched for the Los Angeles Dodgers in 1974. Sparky Lyle, Bruce Sutter, Rollie Fingers, Dennis Eckersley, Trevor Hoffman, and Mariano Rivera come to mind. Some firemen — or closers, as they came to be called — were one-year wonders (Willie Hernandez in 1984), while others enjoyed long and successful careers and made it or will make it to Cooperstown as relief pitchers.
As closers evolved into one-inning specialists, the set-up man also emerged as a part of the specialized bullpen. Certainly not as glamorous as closers, set-up men were often future closers who pitched the seventh or eighth inning. It’s hard to pin down the precise beginnings of set-up man use, but it’s worth noting the New York Yankees bullpen of 1996, when Rivera would often pitch the seventh and eighth innings and closer John Wetteland would pitch the ninth. Broadcaster Tim McCarver said that the Yankees played “six-inning games” that year. In other words, if the Yankees had the lead after six innings, the Rivera-Wetteland combination almost assured a win. And indeed, when Rivera entered games in the seventh inning, the Yanks went 18-2. When he entered in the eighth, they went 14-6.
The emergence of analytics has resulted in even more bullpen specialists. The lefty-on-lefty matchup has been around for years. This was analytics in its infancy, since it was relatively easy to split a batter’s performance against left- and right-handed pitchers. The situational lefty could exploit the weakness of most left-handed batters against left-handed pitchers. But today’s analytics are so detailed that a manager can try to dial up a strikeout, double play, or any other desired outcome. A pitcher who gets a ground ball at an opportune time can save an inning. Obviously, managers are dealing with tendencies and probabilities, but if the information is available, nobody wishes to be second-guessed by the media or fans.
RESEARCH QUESTIONS
 Using Retrosheet, SAS, and R statistical software, 136,395 game outcomes from 1921 through 2016 were examined. All of these games involve a starting pitcher leaving a game, but in line for a win (five innings pitched with a lead of one run or more). Using available data and 1945 and 1990 as arbitrary cutoff dates, 15,897 of the games were in 1921–45 (Pre-closer Era), 63,030 of the games in 1946–90 (Closer Era), and the remaining 57,468 games in 1991–16 (Specialized Bullpen Era). The research questions posed are as follows:
- Looking at the different eras, what influence does innings pitched by a starter and his run differential have on the odds of winning a game?
- Looking at the different eras, given that a starting pitcher leaves the game in line for a win, what is the probability of a team getting the win, accounting for innings pitched and run differential?
- Have these probabilities changed to any degree across these three eras? Has the specialized bullpen helped to increase the likelihood of a team keeping its lead and winning?
- Has the specialized bullpen diminished the late rally?
- Based on these results, are there any general strategies that can be suggested regarding the use of the specialized bullpen?
RESULTS
Research Questions 1, 2 and 3: Did We Win?
Utilizing logistic regression, analytic models for the three eras (Pre-closer, Closer, Specialized Bullpen) were created. Let Y=1 represent the team ahead winning the game (assuming a starter goes five innings with a lead) and Y= 0 indicating a team loss. These models are used to understand the influence of important variables, specifically innings pitched by the starter and run differential at the time of starter exit. The models are also used to predict the probability of winning a game. A detailed explanation of logistic regression is beyond the scope of this paper, but the Appendix contains additional details of logistic regression, the models created, and how they are interpreted.
Table 1 summarizes the influence of the variables in the logistic regression model. The column representing outs (1/3 Inning) was mathematically derived from innings pitched and not part of the original models.
Table 1: Increase in odds of winning the game
| Bullpen Era | Innings Pitched | Run Differential |
| Pre-closer (1921–45) | 127% | 96.5% |
| Closer (1946–90) | 93.00% | 97.2% |
| Specialized Bullpen (1991–2016) | 61% | 98.7% |
These models are quite insightful since:
- For the Pre-closer Era, it appears that innings pitched has a slightly stronger influence on the odds of winning over run differential (127 percent versus 96.5). This would seem to support the theory that these starting pitchers, even tired ones, might have a better chance of winning the game than a Pre-closer Era reliever. Remember, in this era, relievers were considered pitchers not quite good enough to be starters. Relievers had not begun to specialize.
- For the Closer Era, innings pitched (93 percent) and run differential (97.2 percent) odds were much closer. The emergence of the closer meant it was not as critical for the starter to pitch a complete game.
- For the Specialized Bullpen, run differential (98.7 percentage) is now significantly more important than innings pitched (61 percent). This result is a reflection of the strategy of the era. Having a specialized bullpen means that, if you are ahead, your best relievers will probably be put in the game. If you are losing, the manager would probably be less likely to bring these pitchers in.
Now, again using these models, Tables 2, 3, and 4 are used to estimate the probability of a team getting a win. The number of innings the starter pitched and the run differential were used as inputs for each model. These estimates are the predictions of the logistic models already used and discussed in the Appendix. Table 2 shows the percentage of games won for the Pre-closer bullpen:
Table 2: Win percentage matrix, Pre-closer Era
| Innings Pitched by Starter | 1 | 2 | 3 | 4 | 5 |
| 5 | 37.6 | 54.2 | 69.9 | 82.1 | 90.0 |
| 6 | 57.7 | 72.9 | 84.1 | 91.2 | 95.3 |
| 7 | 75.6 | 85.9 | 92.3 | 95.9 | 97.9 |
| 8 | 87.5 | 93.2 | 96.4 | 98.2 | 99.1 |
| 9 | 94.1 | 96.9 | 98.4 | 99.2 | 99.6 |
(Note: Numbered columns indicate Run Differential for Team Ahead)
In examining Table 2, it is intuitively obvious that the percentage of wins increases with both increasing run differential and starter innings pitched. Also note that in the Pre-closer Era, a one-run lead in the eighth inning is better than a two-run lead in the seventh inning and so forth. This reinforces the notion that in the Pre-closer era, an extra inning from the starter is more valuable than an extra run. Again, in the Pre-closer Era, relievers had not begun to specialize. A relief pitcher was considered inferior to a starter but was brought in when the starter was no longer effective.
Now, Table 3 has the same variables, but for the Closer Era.
Table 3: Win percentage matrix, Closer Era
| Innings Pitched by Starter | 1 | 2 | 3 | 4 | 5 |
| 5 | 46.2 | 62.9 | 77.0 | 86.8 | 92.8 |
| 6 | 62.3 | 76.6 | 86.6 | 92.7 | 96.2 |
| 7 | 76.2 | 86.3 | 92.6 | 96.1 | 98.0 |
| 8 | 86.0 | 92.4 | 96.0 | 97.9 | 98.9 |
| 9 | 92.2 | 95.9 | 97.9 | 98.9 | 99.4 |
(Note: Numbered columns indicate Run Differential for Team Ahead)
In Table 3, similar results can be seen as in Table 2. What is interesting in Table 3 is that the relative influence of run differential and innings pitched has changed. Now, generally speaking, an extra run lead is slightly more valuable than an extra inning from the starter. One could speculate on this change, but the importance of that extra run may have to do with the increasing quality of relief pitching. As competent relievers replaced lesser starters in bullpens, pulling the starting pitcher no longer meant a probable dropoff in effectiveness. That extra run became more critical because it was less likely that the lead would be blown by the bullpen.
Finally, Table 4 is for the Specialized Bullpen Era.
Table 4: Win percentage matrix, Specialized Bullpen Era
| Innings Pitched by Starter | 1 | 2 | 3 | 4 | 5 |
| 5 | 54.9 | 70.8 | 82.8 | 90.5 | 95.0 |
| 6 | 66.3 | 79.6 | 88.6 | 93.9 | 96.8 |
| 7 | 76.0 | 86.3 | 92.6 | 96.1 | 98.0 |
| 8 | 83.6 | 91.0 | 95.3 | 97.6 | 98.8 |
| 9 | 89.1 | 94.2 | 97.0 | 98.5 | 99.2 |
(Note: Numbered columns indicate Run Differential for Team Ahead)
In Table 4, the importance of that extra insurance run is very clear. A two-run lead in the seventh inning is even more important than a one-run lead in the eighth inning and so on. Again, with relief pitchers less likely to blow the lead than they had been in the Pre-closer Era, the probability that a lead in the seventh or eighth inning will result in a win grows.
Research Question 4: Rally Time
An entire volume of books could be devoted to stories of baseball superstitions, rally rituals, etc. In the era of the specialized bullpen, has the hope of a rally been dimmed? In other words, teams are now facing fresh flamethrowers in the late innings instead of tired starters. Has this situation diminished the late rally?
The following table indicates the game result by inning and run differential for the team in the lead. In these examples, it does not matter how long the starter pitches. Are teams able to hold onto a one-, two-, or three-run lead in the last three innings? Table 5 shows the percentage of time the team with the lead won the game in the Pre-closer Era.
Table 5: Percentage of wins with the lead, Pre-closer Era
| Inning | 1 | 2 | 3 |
| 7 | 70.0 | 81.9 | 90.6 |
| 8 | 75.2 | 86.9 | 93.5 |
| 9 | 84.2 | 92.6 | 96.8 |
(Note: Numbered columns indicate Run Differential)
Now for the Closer Era in Table 6:
Table 6: Percentage of wins with the lead, Closer Era
| Inning | 1 | 2 | 3 |
| 7 | 71.2 | 83.6 | 91.3 |
| 8 | 76.7 | 88.4 | 94.5 |
| 9 | 85.9 | 93.7 | 97.6 |
(Note: Numbered columns indicate Run Differential)
Now for the Specialized Bullpen Era in Table 7:
Table 7: Percentage of wins with the lead, Specialized Bullpen Era
| Inning | 1 | 2 | 3 |
| 7 | 71.1 | 83.3 | 91.1 |
| 8 | 76.4 | 88.3 | 94.5 |
| 9 | 85.8 | 94.1 | 97.7 |
(Note: Numbered columns indicate Run Differential)
When these tables are compared to Pete Palmer’s empirical data (Palmer, 2018) the logistic models compare quite well. For example, Palmer’s mean win probabilities in the ninth inning for one-, two-, and three-run leads are 85.7, 93.8, and 97.4 percent respectively. This logistic model, seen here in the last row of Table 7, is slightly more optimistic, by about 0.1−0.3 percent. Not much difference.
In comparing Table 5 (Pre-closer) with Table 7 (Specialized Bullpen) individual cells, notice that the Specialized Bullpen percentages are only slightly better per cell, with a maximum increase of 1.6 percentage points (ninth-inning, one-run lead). At best, this is about 2.6 extra wins per year. The percentages here are irrespective of how far a starter pitches into a game. It is simply a comparison of overall pitching staff performance in the two eras. In theory, in the era of specialized bullpens, we might expect the values in Table 7 to increase significantly, but the effect is modest.
Also, to support the premise that the rally is not dead, here are some results. Table 8 represents the probability of blowing the lead and the probability of winning the game after blowing the lead, given a one-, two-, or three-run lead in the seventh inning.
Table 8: Holding the lead
| Pre-closer | Closer | Specialized Bullpen | |
| Prob (blowing the lead) | .280 | .275 | .260 |
| Prob (winning the game after blowing the lead) | .273 | .284 | .270 |
Here, we can see that fewer leads were being blown (.28 down to .26) in the Specialized Bullpen Era. This would be about three games per season. In addition, teams are rallying from a blown lead at almost the same rate (.273 versus .270). This difference is less than one game per season. So, as can be seen, things have not really changed all that much. The game finds a way to balance itself out. The rally is still alive and well.
Research Question 5: What Should We Do?
This quote is attributed to Tommy Lasorda, although others have said it in different ways:
No matter how good you are, you’re going to lose one-third of your games. No matter how bad you are, you’re going to win one-third of your games. It’s the other third that makes the difference.
 Although the numbers do show a slight pitching advantage for the Specialized Bullpen, perhaps 2-3 wins per season, does this guarantee team success on the playing field? The bullpen is only one facet of a team, and this should be examined within the context of the playoffs and World Series.
In 2017, the American League playoff teams in order of seeding were the Indians, Astros, Red Sox, Yankees, and Twins. In the National League: the Dodgers, Nationals, Cubs, Diamondbacks, and Rockies. The Rockies and the White Sox (non-playoff team) appeared to have good bullpens but struggled to win as many games as the other teams. The White Sox lost 95 games, although they were better than their competitors at protecting a lead (when they occasionally had one). Now, from the chicken-or-egg perspective, do good bullpens help a team win or do good teams (capable of come-from-behind wins) make a bullpen look better? Probably a little of both. It’s a somewhat symbiotic relationship, which somewhat diminishes the bullpen’s importance on an elite hitting team.
Of the playoff teams, the Diamondbacks, Dodgers, and Indians appeared to be best at holding a late lead. As you may recall, the Astros defeated the Dodgers in a seven-game World Series. The overall team comparisons are not as easy here, due to the DH, but Houston was first in runs scored, in the AL and all of baseball, while LA was 12th overall and 6th in the National League. On paper, the Astros had the stronger offense and the Dodgers had the stronger pitching, but Houston lost the DH for four games.
The point isn’t that good hitting beats good pitching, which would be a revelation and historically incorrect. The point is that the bullpen is only one piece of a team’s makeup, along with starting pitching, hitting, fielding, and intangibles. In 2017, the apparent better bullpen did not win the World Series. Now, this is not always true, but the argument is that teams seem to spend a lot of roster spots and money on something that does not appear to make any more difference, perhaps less, than good hitters, good starters, and good fielding.
As Fran Zimniuch wrote in his 2009 book, Fireman:
The challenge in the dugout is not limited to having enough position players. Even with a 12- or 13-man pitching staff, a manager’s hands are often tied by his pitchers’ specialized roles. With some relievers unable to throw more than one inning, managers sometimes run out of available pitchers and find themselves in a predicament on the mound.
This is an expensive predicament. As pointed out by Bill Felber in The Book on the Book in 2005:
In 2004, Major League teams committed $283.6 million to the care and feeding of their collective bullpens. That’s $9.45 million per team.
It also represents 14 percent of the 2004 payroll — for players who might play, perhaps, a few times per week, often for only a few innings. Is this the best investment strategy? If we assume 90 player innings per team game in the American League and 81 in the National, and the bullpen pitches 3.5 innings per game (the MLB average in 2017), that represents roughly 4 percent of player innings being used up by 14 percent or more of the payroll.
Now, recalling what Tommy Lasorda said, and not taking the math too literally, every team will win about 60 games and lose about 60 games. The remaining 42 games determine who makes the playoffs and who finishes in last place. Win about 30 of those 42 special games (71.4 percent) and you have 92 wins and will probably be in the playoffs. So, in theory, there are going to be some pivotal games during the year that will define the team’s season — which ones are only known in hindsight. Strategically, when the game’s outcome is in doubt, a good team should win around 70 percent of the time.
Using this 70 percent figure, recall the information provided in Table 4. With a one-run lead, getting the starter past the sixth inning is the point at which you can theoretically win around 70 percent of the time. The longer the starter is able to continue, assuming he is still getting outs, the better your chances of winning. With a two-run lead, a starter can begin to lose effectiveness as early as the sixth inning, get relief help, and still maintain the 70 percent probability. Usually, managers rely on pitch counts and sometimes their own senses to determine bullpen strategy. If the starter can get through seven innings with a one-run lead, then the set-up man and closer can get the team a win 71.1 percent of the time. If this were to happen, assuming the team has the lead in the late innings, then this team will most likely be in the playoffs. But is this always the best approach? Are pitch counts the best determining factor in replacing a starter?
In The Book on the Book, Felber also shows that late in the game a tiring starter is often more effective than the relief pitcher. He shows that, on average, a starter who had faced 28 batters retired 72.3 percent of the hitters he faced after that, while set-up men and closers facing one to three men retired 70.4 percent and 71.4 percent respectively. Felber also found that, generally speaking, good starters began to decline around pitch 115. Most managers are more conservative than this (100 pitches seems to be the magic number). If a batter sees an average of about four pitches (in 2017 it was 3.87 per plate appearance), this is an additional three to four batters, or an extra inning of work.
Another argument against keeping a starter later in the game is the chance of injury over the course of a long season. No manager wants to explain why the ace of the staff will be unavailable for the postseason, especially if the easy excuse is an overworked pitcher. But Felber argues that injury can be as much the fault of underuse as overuse. Today’s starters pitch far fewer innings than their predecessors, yet the trend of pitchers on the disabled list is on an upward trend (2.5 percent in 1948 versus 18 percent in 1998 and 21 percent in 2017). Perhaps sports medicine can diagnose injuries better, perhaps guaranteed contracts reduce the fear of communicating minor injuries, or perhaps expensive starters are just coddled more.
Unfortunately, today’s bullpen approach seems almost programmed and mechanical. Everyone has a specific job to do. One of the downsides of the specialized bullpen is that it is hierarchal in nature and simulates, to some degree, an assembly line at a factory. Felber uses that metaphor in The Book on the Book:
To be fully functional, a hierarchical system requires that virtually every reliever be as competent as the closer — otherwise, the prospect increases that the car breaks down before it ever gets to the closer’s station on the assembly line of victory.
A counterproposal to the assembly-line mentality may be advanced informatics. Perhaps a particular batter has had little success against a certain pitcher. In a key situation, this pitcher might be better suited for the task than the set-up man or closer. Certainly, over time, the set-up man and closer are probably the team’s two best relief pitchers, but they are not going to be lights out every night. Of course, they might not even be available due to previous workloads. Small sample sizes are problematic too, but a manager should manage and not always execute a computer algorithm.
STRATEGIES FOR SUCCESS
Based on this research, what advice could be given to both managers and general managers?
- Most teams do not have both an elite set-up man and closer. Forget about pitch counts and trust your instincts. Let the starter go as long as he can. What is so special about 100 pitches? Every pitcher is different in regard to mechanics, stamina, etc. In past eras, assessing a starter was an important job for the manager, pitching coach, and catcher. Today, managers follow a script so as not to be second guessed.
- If a team has an elite set-up man and closer, then the situational bullpen can be an effective strategy. The problem is most teams do not have this luxury. This again suggests letting the starter pitch a bit longer, or letting the best relievers pitch a bit longer. Why can’t a closer pitch more than one inning, it the situation presents itself? Is the marginal wear and tear on an arm that significant? Is throwing 30 pitches riskier than 15 pitches? This should be investigated. A pitcher has to get up, warm up, and pitch anyway. How is an extra 15-20 pitches going to make that much difference?
FINAL WORDS
In reference to the research questions previously asked, here is a brief summary of the results:
- In the Pre-closer Era, innings pitched by a starter was more important than run differential. In the Situational Bullpen Era, this relationship is reversed. Today, a two-run lead in the eighth inning is slightly better than a one-run lead in the ninth inning and so forth. This might be due to the instability of a new pitcher late in a game.
- The specialized bullpen has been shown to be a more effective strategy, but marginally so. On average, perhaps two to three wins per season. Not every team has an elite set-up man and closer, and one must question the merits of this investment for teams lacking such pitching.
- The rally is still alive. Batters may be facing more pitchers, who throw harder late in the game, but batters are stronger and faster too. The game has a way of balancing itself out, no matter the changes to the rules or strategy.
- The specialized bullpen, like pitching, hitting, and fielding, is only one part of team success. Bullpen is a subset of pitching, and its influence on winning is arguably the weakest of the components. A weak bullpen can cost you a game, but a strong bullpen does not guarantee a World Series ring. You still need the lead late in the game, or the bullpen is irrelevant.
- Bullpen strategy is programmed and pitch counts may not always be the best way to manage a game. A starter should be evaluated on more than just number of pitches. There are certainly other factors, equally important, that should be considered.
As the game continues to involve, one must wonder what the future of the specialized bullpen will be. Perhaps, someday, we may regularly have nine pitchers appearing in a game, each a one-inning specialist. Don’t laugh. In his day, Iron Man McGinnity would have sneered at the idea of a closer.
JOHN DANIELS is an Associate Professor of Statistics at Central Michigan University. A lifelong Detroit Tigers fan, John never knew all those years spent playing Strat-o-matic in the basement would amount to something so useful or so enjoyable.
SARA ANDRASIK is a recent graduate of Central Michigan University’s Applied Statistics and Data Analytics program. During her undergraduate time at Grand Valley State University, she helped lead the softball team to two World Series appearances as a pitcher.
DAVID HOOLEY is a recent graduate of Central Michigan University’s Master’s in Applied Statistics and Data Analytics program. He is currently employed as a data analyst.
APPENDIX
Logistic regression is a technique to model probabilities using multiple linear regression. In this situation, Y=1 is defined as winning the ballgame while Y=0 is defined as losing. This particular model has an intercept and two slope parameters.
For example, in the Pre-closer model:
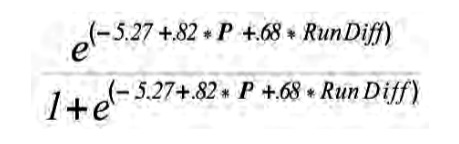
Where 5.27 is the intercept and .82 and .68 are the respective slope estimates. In logistic regression models, the slopes are interpreted to show the change in the odds [ Prob(win) / Prob(loss) ]. For example, for the number of innings pitched by the starter (IP):
Odds Ratios: IP: e.74 = 2.23 (each inning pitched increases the odds of winning 110% holding Run Diff constant)
Mathematically, it can be shown that each out (1/3 of an inning) increases the odds of winning 28%
Run Diff: e.69 = 1.97 (each additional run ahead increases the odds of winning 99% holding IP constant)
The probability of a win can be estimated by plugging in the IP and Run Diff into the logistic equation and the result will be a value between 0 and 1, representing the probability of a win.
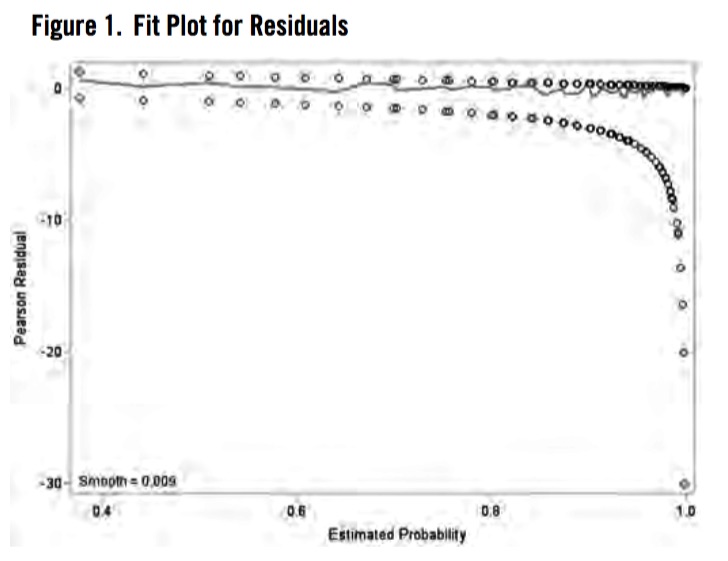
To validate a logistic regression model, the residuals (Y minus predicted Y) versus the fits (predicted Y) are displayed on a plot with a localized regression line (lowess) included. If the lowess line is approximately horizontal, this indicates a valid logistic regression model. Here in Figure 1 is the residuals versus the fits for the Pre-closer model. The other models had similar results.
Figure 1: Fit Plot for Residuals
Sources
Bill Felber, The Book on the Book, 1st ed., (New York: Thomas Dunne Books, 2005).
Fran Zimniuch, Fireman: The Evolution of the Closer in Baseball (Chicago: Triumph Books, 2009).
Sean Lahman, Baseball Database, http://www.seanlahman.com/baseball-archive/statistics/
Pete Palmer, “Relief Pitching Strategy: Past, Present, and Future?” Baseball Research Journal, Vol. 47, No. 2 (Phoenix, Arizona: SABR, Spring 2018).