

The Traffic Directors
This article was written by Neal Williams - Dan Fox
This article was published in 2007 Baseball Research Journal
“The main quality a great third base coach must have is a fast runner.” — Rocky Bridges, California Angels coach
“It’s frustrating. Your job is not to get in the way of a rally.” — Rich Donnelly, Dodgers third base coach after Game One of the 2006 NLDS
Most readers will remember what was perhaps the strangest play of the 2006 postseason and for Dodger fans that memory is not a happy one. With runners on first and second and nobody out in the top of the second inning, Dodgers rookie Russell Martin took an inside-out cut at a 2-1 fastball from the Mets’ John Maine and drove it deep to right field. Jeff Kent, the runner on second, apparently didn’t see the ball immediately and got an extremely poor jump while J. D. Drew at first base read that the ball was over the head of right fielder Shawn Green and began motoring for second. With Kent finally under way and Drew close on his heels, Green played the ball perfectly off the wall on one hop, relayed to Jose Valentin, who threw a one-hopper to Paul Lo Duca just in time to nip a diving Kent at the plate. In the meantime Drew had not slowed at all, and upon turning around a surprised Lo Duca was able to put down the tag as Drew also attempted a headfirst slide. The result was a double play which proved huge in a 6-5 Mets win.
After the game Dodgers third base coach Rich Donnelly noted that he didn’t want to send Kent but saw that with Drew close behind, he’d likely end up with two runners on third and at that point he was hoping for a botched throw. And for some reason, perhaps their proximity or his attention focused on the lead runner, Donnelly did not or was unable to give the stop sign to Drew.
Of course, most third base coaches most of the time aren’t put in such a difficult position by their runners. Instead, in addition to their job relaying signs to the batter, they are concerned with waving around one runner at a time. The question then from an analyst’s viewpoint is twofold. First, is the job of directing traffic on the bases quantifiable? In other words, can we create a metric that measures the success and failure of this component in a reasonable way? And second, if it is measurable, can some coaches be said to be more skilled at this half of their job than their peers? In this essay we’ll take a crack at answering both questions.
QUANTIFYING THE WAVE
In the summer of 2006, in a series of six articles published on the Baseball Prospectus website one of us (Dan Fox) endeavored to more formally quantify base running by developing a series of metrics measured in terms of runs. Those metrics are:
Equivalent Ground Advancement Runs (EqGAR). Measures the contribution of base runners above and beyond what would be expected in opportunities they have for advancing on outs made on the ground. For example, advancing from second to third on a groundout to shortstop or getting gunned down at home on a grounder to second.
Equivalent Air Advancement Runs (EqAAR). Measures the contribution of base runners above and beyond what would be expected in opportunities they have for advancing on fly-ball and line-drive outs. For example, scoring on sacrifice flies or advancing from first to second on a fly ball to left field. This metric is park adjusted.
Equivalent Stolen Base Runs (EqSBR). Measure the contribution of base runners in their stolen base attempts and pickoffs.
Equivalent Hit Advancement Runs (EqHAR). Measures the contribution of base runners above and beyond what would be expected in opportunities they have for advancing on singles and doubles. For example, moving from first to third on a single to left field or scoring from first on a double. This metric is park adjusted.
When totaled, these give us a fairly complete picture of the contribution made by a player on the bases beyond what would have been expected given their opportunities. And therein lies the rub. The methodology that underlies these metrics isn’t a simple totaling of the number of bases gained in these situations, but rather an application of changes in the expected number of runs across several axes including the base/out situation (the Run Expectancy matrix), handedness of the batter, and the position of the fielder who fielded the ball.
By calculating how often runners typically advance in a whole host of scenarios (for example, with a runner on second and nobody out, a runner will advance from second to third 43% of the time when the ball is fielded by the shortstop, but 97% of the time when handled by the second baseman) and translating those percentages to runs using the Run Expectancy matrix, we can credit or debit a runner for each and every opportunity they have on the bases.
Totaling the credit assigned to each opportunity (and not crediting the runner for advancing the minimum number of bases) for players allows us to assign a number of theoretical runs above and beyond what a typical player would have contributed given the same opportunities. Yes, theoretical since these metrics, being based on models like the RE matrix, don’t actually measure the precise number of runs contributed by a runner, but rather can be thought of as an accounting of the decisions made by runners and coaches that put their teams in more or less advantageous situations throughout the course of a season. That accounting is performed in terms of runs. As mentioned above, we then adjust for park effects where necessary. For example, the spacious Coors Field outfield allows for easier advancement than the smaller Fenway Park.
Already many of you can see where this is going. EqHAR, by measuring runner advancement on hits, may be an appropriate methodology to apply to third base coaches, since it measures an aspect of the game in which third base coaches are directly involved. Looking more closely, EqHAR is composed of three basic scenarios:
- Runner on first, second not occupied, and the batter singles.
- Runner on first, second not occupied, and the batter doubles.
- Runner on second, third not occupied, and the batter singles.
A third base coach may be active in each of these scenarios, but as will be obvious, it typically depends on where the ball is hit. When a batter singles or doubles with a runner on first base, the runner typically makes his own decision about whether to advance if the ball is hit to left field or within his field of view in center field. On the other hand, he’ll usually pick up his third base coach if the ball lands in right field. Likewise, when on second base a ball hit to the outfield typically results in the runner taking matters into his own hands only if the ball is hit to left, but relying on the coach if the ball is hit to center or right. By using these general rules as a guide, the analysis can be restricted in this sense to plays that fall only into these categories but also include scenarios when multiple base runners are on base.
- Runner on first and the batter singles and the ball is fielded by the right Other bases may be occupied.
- Runner on first and the batter doubles and the ball is fielded by the right Other bases may be occupied.
- Runner on second and the batter singles and the ball is fielded by the center or right fielder. Other bases may be occupied.
One might argue that these categories are either too restrictive or not restrictive enough, and we have sympathy with both arguments.
For example, with the runner on first on a single fielded by the center fielder, there are certainly occasions when the runner picks up the coach. Conversely, with a runner on second and the batter singling to left, there are definitely times when the runner knows the ball will be difficult to handle or is running with the pitch and so heads home without consulting the coach. This analysis will not include those events. And these events of course do not include runners attempting to advance on ground-ball and fly-ball outs, nor does it include runners attempting to stretch doubles into triples or triples into inside the park home runs. The thought was to error on the side of caution and include only those events where it seems the third base coach would be most likely to have influence.
Further, these scenarios will include times when runners run right through the stop sign given by their frantic coach only to get thrown out. Through no fault of his own, the coach will be still be debited for plays like these.
Surely this is far from a perfect system, but given the granularity of the play-by-play data available and absent video inspection of each play, this seems like a reasonable approach for a first pass at creating this kind of metric.
The primary advantage to using the methodology described above as opposed to simply counting the number of runners that were thrown out on each coach’s watch is that this system also gives appropriate credit when a runner advances successfully. The system also takes into consideration how difficult the advancement event was and gives more credit when a runner takes a base in a higher reward situation. While keeping runners from getting thrown out is clearly a major component of the job, knowing when to take risks based on the game situation is a secondary component and one that this metric captures.
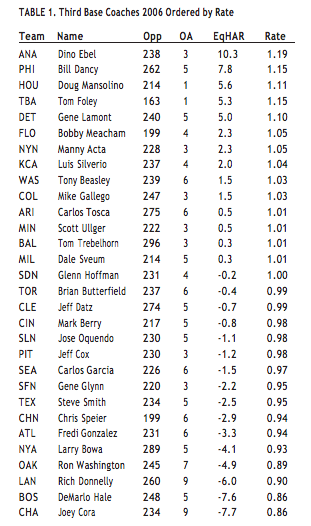
Given the above caveats, we ran the EqHAR framework for third base coaches for 2006 with the following results.
(Click image to enlarge)
This table includes the number of hit advancement opportunities (Opp), the number of times runners were thrown out advancing (OA), the EqHAR for those opportunities, and a Rate statistic that is the ratio of EqHAR to the expected number of advancement runs given both the quantity and the quality of opportunities along the axes mentioned above. This is important, since you’ll notice that while Baltimore and Tom Trebelhorn had 296 opportunities, Tom Foley in Tampa Bay had just 163, and all other things being equal, more opportunities means a higher EqHAR.
It should be noted that the coach was assigned all plays for the 2006 season for his team since there is no easily accessible record of when a third base coach was not on the field for his team. For example, although Chris Speier took a several-day leave of absence beginning July 20 after being arrested for DUI earlier that week, the opportunities during that time are credited to Speier. Through this analysis the coaches were assigned opportunities based on their team’s media guides for the respective seasons.
So under this measure Dino Ebel of the Angels played a part in helping his runners to the tune of just over 10 additional theoretical runs (the second highest of any single season from 2000 through 2006) while Joey Cora was complicit in costing the White Sox the equivalent of almost eight runs. Intuitively, this range seems to be within the bounds of believability. Newly minted managers Ron Washington (-4.9) and Fredi Gonzalez (-3.3) don’t come out very well, although Manny Acta (+2.3) does.
But is this really a fair gauge of a third base coach’s influence? Keep in mind that failing to advance as frequently as the average runner in various situations, as well as getting thrown out, will both depress EqHAR, with the latter being much more costly than the former. Even so, it could be the case that Cora was saddled with extremely slow runners who didn’t advance as often as they should or runners who don’t take direction very well and run through his signs or even who simply don’t hustle. And Ebel may be blessed with a Chone Figgins, who regularly scoots home on singles and doubles and never gets caught (Figgins was not thrown out in 56 opportunities and recorded the highest individual EqHAR at 4.93 in 2006).
(Click image to enlarge)
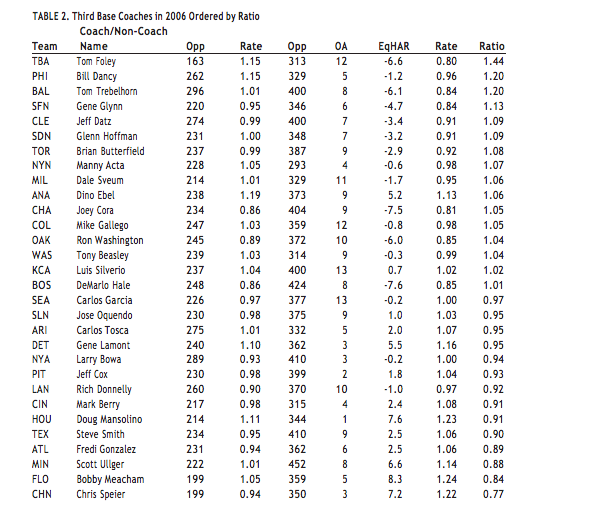
Because this metric depends on the players a coach has to work with, an additional step is warranted that acknowledges that dependency. This step involves comparing the opportunities that coaches can be said to have some control over with ones that they do not. If a team is populated with poor base runners who have trouble advancing or regularly get thrown out in situations where the coach is a spectator, one might argue that those opportunities should serve as the baseline with which we judge the coach. Table 2 shows the results of this recalculation by including these “noncoach” opportunities. Table 2 includes a final column that is the ratio of the Rate for opportunities the coach has influence over to the Rate for the opportunities for which they do not.
Under this second measure Cora moves from 30th to 11th by virtue of his team racking up a very poor EqHAR of -7.5 and rate of 0.81 in opportunities that Cora had little or no influence over. When comparing the 0.81 rate in his coach-influenced opportunities to 0.86, Cora comes out at 1.05, thereby slightly outperforming his team.
In Table 2, Washington and Gonzalez both look a little better while Speier and Florida’s Bobby Meacham fall by virtue of their respective teams performing quite well in non-coach opportunities, at 1.24 for the Marlins and 1.22 for the Cubs. And what of the Angel’s Ebel, who came out on top in Table 1? He slides to 10th since the Angels recorded a very respectable 1.13 rate in non-coach opportunities, while Tom Foley of the Devil Rays takes the top spot since his team performed so poorly in other opportunities (-6.6, 0.80) and so well when he was likely involved (5.3, 1.15).
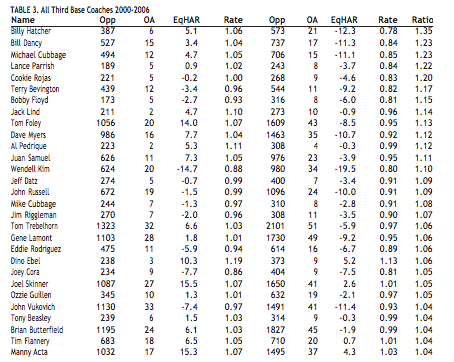
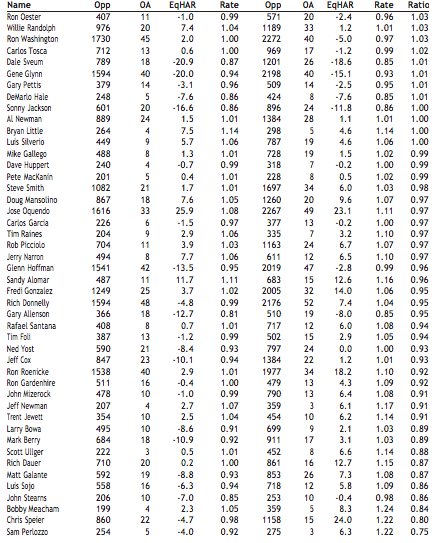
This metric can be expanded to encompass multiple seasons and therefore a larger view. Table 3 shows these metrics for each of the 74 third base coaches employed from the beginning of the 2000 season through 2006.
(Click images to enlarge)
Here Billy Hatcher takes the top spot through his work as the Devil Rays third base coach in 2000-2001. Although his rate statistics for the two seasons (1.01, 1.10) were certainly above average, his team in noncoach opportunities registered rates of just 0.75 and 0.82. Speier, as the third base coach for the Brewers in 2000, Diamondbacks in 2001, and the Cubs in 20052006 had 22 runners nabbed in 860 opportunities for an EqHAR of -4.7 and rate of 0.98, while otherwise his team was thrown out 15 times and had a rate of 1.22, pushing him to the bottom of the list.
From an absolute perspective Dave Sveum registered the lowest EqHAR at -20.9 during his time with the Red Sox in 2004-2005 and Brewers in 2006, while Gary Allenson with Milwaukee in 2001-2002 had the lowest absolute rate at 0.81. In both cases, however, the poor performance of their teams buoyed their ratings. Cardinals third base coach Jose Oquendo had the highest absolute EqHAR of 25.9 in his seven years with Tony LaRussa, while Ebel recorded the highest rate at 1.19 in his single season with the Angels. These absolute numbers indicate that over the course of seven seasons the range in terms of EqHAR is around 55 runs.
In answer to the first of the questions posed above, the act of waving runners around is quantifiable, albeit imperfectly, with the limitations already discussed. The quantification in the above analysis passes the test of reasonableness and takes the following form. Third base coaches in the absolute sense seem at most to be able to contribute to just over one additional win or one loss (Sveum with the 2005 Red Sox recorded an EqHAR of -12.6 and Jerry Narron with the Rangers in 2000 was at +10.9) in the course of a season, over what would be expected. Over the course of seven seasons that contribution grows to around two and half wins, indicating there is a large degree of variability in play. However, judging a coach by that absolute metric is not necessarily equitable since it doesn’t take into consideration the personnel the coach is working with. To correct for this, a ratio that uses a baseline can be calculated, and when that ratio is converted to runs, the range becomes -1.5 to +1.5 wins per season and -3 to +3 wins over the course of seven seasons.
PERSISTING THE WAVE
While we’ve answered the first question in the affirmative, does the difference we see between third base coaches in a single season indicate that there is a disparity in skill between these coaches?
The standard way performance analysts have approached a question like this is to run year-to-year comparisons in an effort to see if the effect being measured persists. As it turns out, roughly two-thirds of third base coaches remain in the role the following season, with a high of 24 being retained during the winter 2003-2004. Using the ratio calculated in the previous section, a correlation coefficient (denoted as r where a value of -1 indicates a perfectly negative linear correlation and a value of 1 indicates a perfectly linear one) can be calculated for each pair of seasons as shown in Table 4.
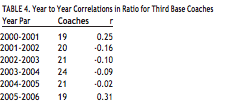
From an overall perspective those 124 pairs can be graphed as shown in Figure 1.
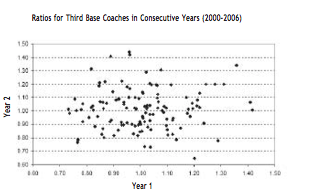
As you can see from the graph in Figure 1, the data doesn’t trend in any direction and in fact the correlation coefficient across all pairs of years is just .04. A value so close to zero is evidence that there is in fact no correlation. In other words, knowing a third base coach’s ratio in one season gives you no information about what his ratio will be in the next. Further, the data is almost perfectly normally distributed, which is additional evidence that there is little or no skill component evident in the data. This can then be interpreted as meaning that there is no discernable third base coaching skill that carries over from year to year and that therefore the answer to our second question is no.
There may be several reasons for this negative result. Reminiscent of the ongoing debate over clutch hitting, the skill this metric is trying to measure may be much more subtle than the metric can deliver. Instead of a coach being “responsible” for up to +1.5 wins per season, his actual contribution to those wins may be a fractional part of that value and hence the variability component in the numbers we use for correlation swamps the skill component to a large degree. So there may indeed be a skill involved in waving runners around, but that skill is for all intents and purposes unimportant in the big scheme of things. The obvious dependence on his personnel would seem to support this.
Additionally, perhaps the metric is poorly designed and may not capture the skill at all though it exists. It could even be the case that there really is no skill involved in holding and sending runners (or if you prefer, there is no skill difference between coaches at the major league level) and the differential results we see can be chalked up to a combination of personnel (try as we might to disentangle it or due to turnover of the roster) and simple luck driven by anything and everything from the opponents’ defense to the weather.
Our quest for knowledge about the game is just as often informed by studies that show no effect as those that confirm our intuition. As for the influence of third base coaches in determining when to send and when to hold runners, the most we can say from this study (assuming our metric is relevant) is that if there is a skill involved, it is hard to measure, and although the judgment exercised on the field can often make the difference in individual plays, it doesn’t manifest itself in the larger scale of seasons.
Sources
Schrodinger’s Bat: Hit the Ground Running: www.baseballprospectus.com/article.php?articleid=5298
Schrodinger’s Bat: An Air of Advancement: www.baseballprospectus.com/article.php?articleid=5346
Schrodinger’s Bat: Advancing in Context: www.baseballprospectus.com/article.php?articleid=5380
Schrodinger’s Bat: Using The House Advantage: www.baseballprospectus.com/article.php?articleid=5432
Schrodinger’s Bat: The Running Man: www.baseballprospectus.com/article.php?articleid=5495
Schrodinger’s Bat: The Whole, the Sum, and the Parts: www.baseballprospectus.com/article.php?articleid=5523