Two Measures of Fielding Ability
This article was written by Jim McMartin
This article was published in 1983 Baseball Research Journal
Baseball has been traditionally divided into the three major aspects of hitting, pitching, and fielding. While there are abundant quantitative measures for hitting, far fewer for pitching, fielding ability has but one, the fielding average. Unfortunately, this dominant statistic is a poor measure of fielding skill. It is computed by dividing the fielder’s total of putouts and assists by his total chances (putouts + assists + errors).
The basic problem is that a fielder is not charged with an error when he is simply too slow to get to the ball. Instead, the batter is credited with a hit and the pitcher’s record is similarly debited. What we need is a meaningful measure that reliably distinguishes among fielders. The research reported here examines the reliability and validity of two measures of fielding. The results are compared to the opinions of SABR members, as reported by Ed Winkler (Baseball Research Journal, 1980, pp. 42-45).
The fielding records of all shortstops and second basemen who played in the major leagues for at least four years (minimum of 100 games per season) were examined. The fifth edition of the Macmillan Encyclopedia was the source of these data. This yielded sample sizes of 115 second basemen and 1 27 shortstops. For these fielders, their lifetime records included all seasons in which they played 70 or more games at one position, shortstop or second base. Records of current players were updated to include their 1982 performances.
Two fielding measures were computed for each fielder:
Fielding Effectiveness (FE) is found by multiplying two components –
(a) Bill James’s range factor, which is the sum of putouts and assists divided by games played (Bill James 1982 Baseball Abstract). This measures how active a player was at his position. Slow players are indirectly penalized by their failure to be credited with either a putout or assist.
(b) The second component measures the middle infielder’s ability to complete the double play. The putouts and assists that a middle infielder is credited with in the process of “turning the double play” are given extra weight because of the DP’s importance as a defensive weapon. Other things being equal (e.g. range factor), middle infielders who complete more DPs are more skilled at the position than those who complete fewer. Many sabermetricians believe that the “big inning” holds the key to winning games. If this is so, then the DP seems to be the defense’s natural antidote.
This second component is measured by subtracting a fielder’s errors from his double plays, dividing the difference by games played, and adding the number one to the resulting fraction. I call this the Take Away – Give Away Ratio (T-G%). The constant, 1, is added so that the product of the two components will be greater as each component, separately, is greater:
FE = (P0 + A)/G x (I + (DP – E)/G)
An example is in order. Who was the more effective shortstop in 1982, Bill Russell or Ozzie Smith? Their fielding records show:
Games POs Assists DPs Errors
Russell 150 216 502 64 29
Smith 139 279 535 101 13
Applying these data to the formulas for the two components we obtain:
Range x T-G% = Fielding Effectiveness (FE)
Russell 4.79 x 1.23 = 5.89
Smith 5.86 x 1.63 = 9.57
While the outcome of this particular comparison will surprise no one who saw both shortstops field the position in 1982, it is more meaningful to report that Smith’s FE of 9.57 is the fifth highest seasonal value for all shortstops playing 100 games or more. The four higher values were achieved by Bill Jurges in 1933 (10.14), Eddie Miller in 1940 (9.59), Lou Boudreau in 1944 (10.17), and Rick Burleson in 1980 (9.68).
(2) The second measure of fielding skill is called the Leader Index (LI). This is found by adding the number of times a fielder has led his league in putouts, assists and double plays, and subtracting the number of times he led the league in errors. The difference is then divided by the number of seasons played times three. This is a very stringent measure of fielding skill over the course of a career. To achieve the maximum possible value, 100%, a player would have to lead his league in putouts, assists, and DPs and never lead the league in errors at that position, for each and every season he played. Since it is such a stringent performance measure, it is particularly useful for comparing excellent middle infielders to each other. It is not valuable in comparing average or below average fielders because such players would rarely lead their leagues in the positive categories.
Two internal analyses of the data were conducted. The first analysis was to determine if FE was more or less stable for the same player from year to year. The FEs of the 115 second basemen were correlated (product-moment) for their “middle years” of service (e.g. years four and five of an eight-year career or five and six of a nine-year career). The resulting coefficient of +.51 from such a large sample is interpreted to mean that there is stability to this measure.
The second internal analysis was conducted to determine if FE and LI correlate with each other. Players were divided into decades of their greatest service (from 1900) and the product-moment correlation was computed for each decade. The medians r’s for second basemen and shortstops were .68 and .49, respectively. These data indicate that there is a modest relationship between FE and LI.
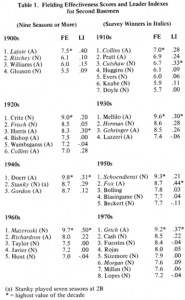
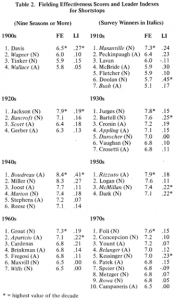
The results of both internal analyses are interpreted to mean that FE and LI are basically reliable measures of fielding skill. But reliability is a necessary but not sufficient condition for the question of a measure’s validity. How can it be shown that either fielding measure validly measures fielding skill? One way is to compare these two measures with the results of expert opinion. Tables 1 and 2 present the FEs and Us of second basemen and shortstops, respectively, for each decade since 1900. Winners of a survey of SABR members are italicized. Absence of league identification (i.e. no (A) or (N)) means that the player performed at least two years in both leagues.
Inspection of the data presented in Table 1 for second basemen shows that the opinions of SABR members and both measures of fielding ability are in exact agreement for each league for the decades of 1900, 1910, 1950, and 1960. In addition, these three indices agree that Billy Herman was the NL’s best fielding second baseman in the 1930s, Eddie Stanky held that honor in the 1940s, and Bobby Grich did the same for the Junior Circuit in the 1970s. Of the 16 possible winners (eight decades times two leagues), the three indices were in agreement 11 times, or 69%.
Table 2 shows that there is less agreement between these objective measures and SABR opinion in the case of shortstops. There was no decade in which survey and objective measures were in exact accord for both leagues. Agreement is found on at least two of the three measures for Rabbit Maranville in the 1910s, Everett Scott in the 1920s, Lou Boudreau in the 1940s, Phil Rizzuto in the 1950s, and Luis Aparicio in the 1 960s. SABR choices of Donie Bush over Roger Peckinpaugh in the 1910s, Leo Durocher over Bill Jurges in the 1930s, Marty Marion over Ed Miller in the 1940s, and Maury Wills over Dick Groat in the 1960s are at serious variance with both objective measures. The same could be said for the choice of Larry Bowa as the NL’s best fielding shortstop of the l970s. The data does not support such a choice. (However, Bowa’s fielding average is superior to the others!)
(Click images to enlarge)
In the case of disagreement among different measures, how can one decide which, if either, is a better index of fielding performance? Clearly, some criterion independent of either is required. Suppose we agree that a valid criterion of fielding performance is managerial decision. After all, managers are paid to decide which of several candidates will do the best job at a given position.
Let us consider the performance records of Maury Wills, voted the best NL shortstop of the 1960s by SABR members but finishing well behind Dick Groat on both FE and LI.
In 1967 and 1968 Wills played for the Pittsburgh Pirates at third base! Why did managers Harry Walker, Danny Murtaugh, and Larry Shepherd prefer to play Gene Alley at the more important shortstop position? Let us compare them (lifetime records) as shortstops.
|
|
Games |
POs |
Assists |
DPs |
Errors |
FE |
LI |
|
Gene Alley (1965-72) |
838 |
1387 |
2778 |
625 |
127 |
8 |
0 |
|
Maury Wills (1959-71) |
1466 |
2426 |
4541 |
804 |
270 |
7 |
0 |
On both objective measures Alley is clearly superior to Wills. These data are consistent with the decision of three managers and inconsistent with the votes of the majority of SABR members.
Why, then, did Wills receive the most votes as the NL’s best fielding shortstop of the 1960s? Was it because he won two Gold Gloves and Groat none? Psychologists have long known of the “halo effect” – the tendency to attribute positive traits to individuals known to possess other (but unrelated) positive traits. Simply put, Wills was in the public’s collective eye to a far greater extent than was either Alley or Groat: (1) Wills played for the pennant-contending Dodgers to a greater extent than did Groat for the Pirates; (2) Wills stole 104 bases in 1962 and captured numerous headlines; Groat stole a lifetime total of 14 bases and captured no headlines; (3) Wills played more seasons at shortstop than Groat and SABR voters consistently elected the player with the most longevity at his position.
The point is that subjective opinion is highly open to be influenced by factors other than pure fielding skill. Thus, there is need to establish some objective measure or measures that help us focus on the skill under consideration. I propose FE and LI as reasonable measures of the fielding abilities of shortstops and second basemen.


