

Ty Cobb’s Splits
This article was written by Trent McCotter
This article was published in Fall 2009 Baseball Research Journal
Ty Cobb is still remembered as one of the greatest players in the game’s history. He’s perhaps the only player from more than one hundred years ago whose name is still recognized by even casual fans. However, he bears the burden of having played in an era when statistics weren’t compiled or analyzed at anywhere near the same level as they are today.
His lifetime batting average and hit total are easily found,1 but what about his home and away on-base percentage, or his numbers against left-handed pitchers? Cobb’s official day-by-day stats are recorded on dozens of handwritten ledger sheets that are housed in the Hall of Fame’s basement, making it difficult to determine such statistical splits for Cobb. In fact, it had never been done.
However, over the last few years, I have entered all of Cobb’s official day-by-day stats from those paper ledgers into a computer database. I also included new information, like the opposing team, the opposing starting pitcher, and which games were home and away.
By digitizing Cobb’s career stats, we can now create certain statistical splits where before we had only season totals.
We still won’t know stats like Cobb’s average with runners in scoring position or his exact numbers against each pitcher. To calculate those, we’d need play-by-plays of all 3,035 of Cobb’s career games—and the record of those details just doesn’t exist. But we still can calculate a lot of interesting figures for his entire career.
Besides offering the sheer fun of seeing splits for the first time for one of the game’s greats, this article gives new stats that can be used to compare Cobb to other great hitters for whom such splits are easily available on Retrosheet. Along the way, I will point out some of the highlights but also present the full data in tables so that readers can draw their own conclusions.
Here we go.
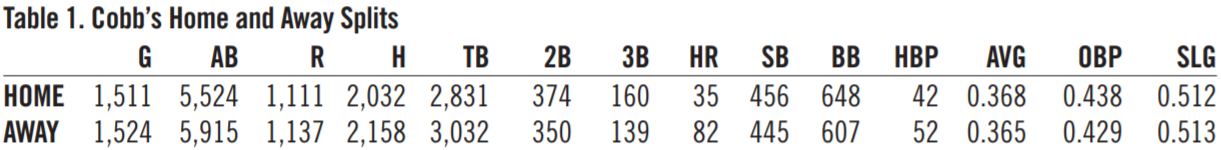
Note that Cobb hit only three points higher at home than on the road and that he had more career hits on the road. His consistency in almost all statistical fields shows he wasn’t a product of a hitters’-haven home ballpark. A player compiling Cobb’s road numbers alone would be worthy of Hall of Fame consideration.
As just one example of his road-hitting prowess: Cobb hit .423 on the road in 1912, .414 in 1913, and .414 in 1917. In fact, in 1917 Cobb had a 39-game hitting streak on the road, one of the longest such streaks in MLB history. (See table 2.)
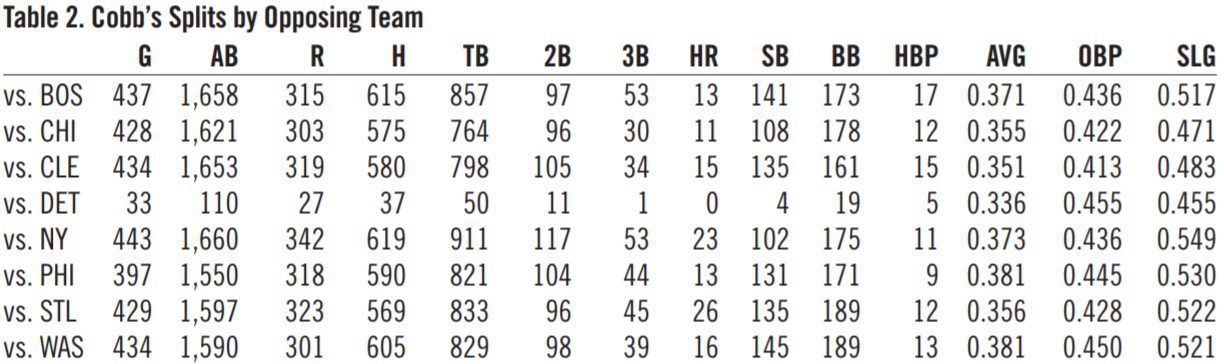
Cobb hit over .350 against all teams except Detroit, against whom he played only during his final two seasons, when he was with the Athletics. Philadelphia and Washington, frequently among the worst pitching staffs of Cobb’s era, proved their critics right; the Tiger great hit over .380 against both of them and also had his highest slugging marks against them. (See table 3.)
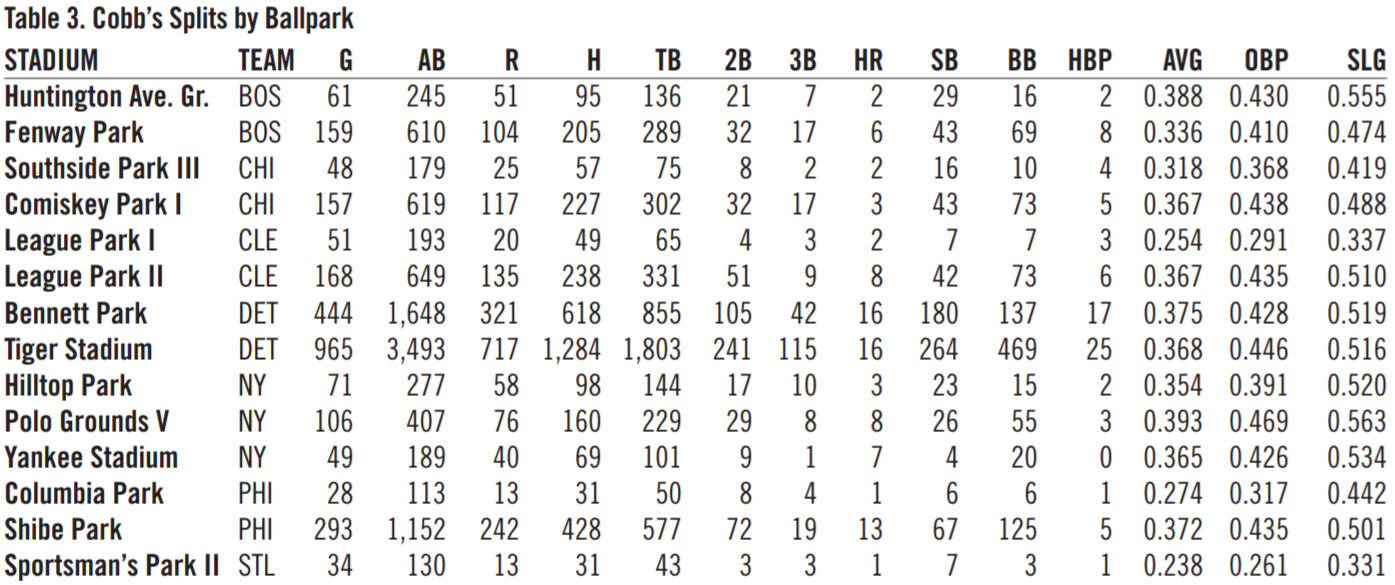
Cobb had his best numbers at Washington’s Griffith Stadium (.405 average) and the Yankees’ Polo Grounds (.563 slugging). From September 13, 1913, through May 11, 1918, Cobb also put together one of the most amazing—yet heretofore unknown—hitting streaks by getting a base hit in 48 consecutive games at the Polo Grounds. This streak appears to be the longest hitting streak at any particular ballpark in MLB history.
It should be pointed out that Cobb wasn’t the only one who hit well at the Polo Grounds. During his time with the Boston Red Sox, Babe Ruth hit only 22 percent of his home runs at Fenway. However, in 1920 he went to the Yankees and hit 54 percent of his homers at the Polo Grounds, where he compiled a record .990 slugging percentage. It’s not a stretch to say that Ruth never would have come close to 714 homers if he’d stayed at Fenway Park for his entire career.
Returning to Cobb, the only two parks that stymied the Georgia Peach were two that existed only during the beginning of his career: Cleveland’s League Park I, where he hit an anemic .254 with a .291 on-base percentage, and St. Louis’s Sportsman’s Park II, where Cobb hit only .238 in 34 games. (See table 4.)
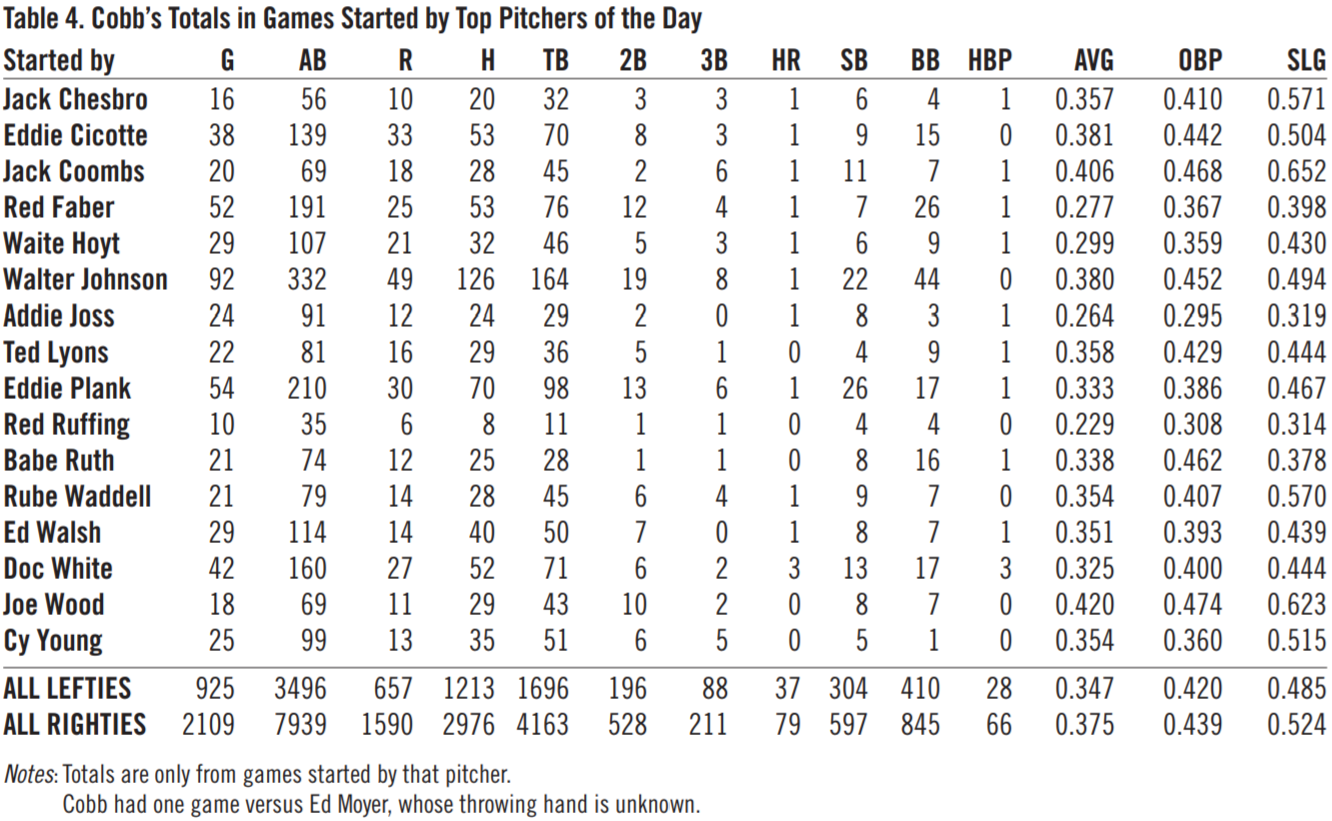
In this table, Cobb’s stats for an entire game are attributed to the one pitcher who started the game. Since we don’t have full information about relief pitchers, this table is really just a close representation of how Cobb did against these particular starters. Relievers were rare in these days anyway, as these pitchers completed an aggregate of 74 percent of their career starts.
Cobb had good numbers in games where Walter Johnson started (.380 average with a .452 on-base percentage). Cobb always said that the reason he did well against Johnson was that The Big Train was afraid of hitting batters; the stats seem to back it up—Cobb wasn’t hit by a single pitch in any of the 92 games that Johnson started against Cobb. Cobb also did well in games started by a young lefty known as Babe Ruth (.338 average), although only two of Cobb’s 25 hits in those games went for extra bases.
As a lefty, Cobb naturally did worse against south-paws, hitting 28 points higher against righties. Over the last twenty years in the majors, a typical lefty has hit about 15 to 20 points lower against left-handed pitchers than against right-handed pitchers. Note that Cobb’s career average against lefties would still be the fifth-highest overall career average in MLB history.
The only top pitchers who seem to have held Cobb down were Red Ruffing, who allowed just a .229 batting average and .314 slugging average in games started against Cobb; and Addie Joss, who kept Cobb below a .270 batting average and .300 on-base percentage. Even the great Cy Young, whose career was winding down just as Cobb’s was beginning, could only keep Cobb to about a .350 batting average. Interestingly, Cobb stole a disproportionate amount of bases off of Eddie Plank—a lefty, no less—whom Cobb faced more than any other pitcher except Johnson. (See table 5.)
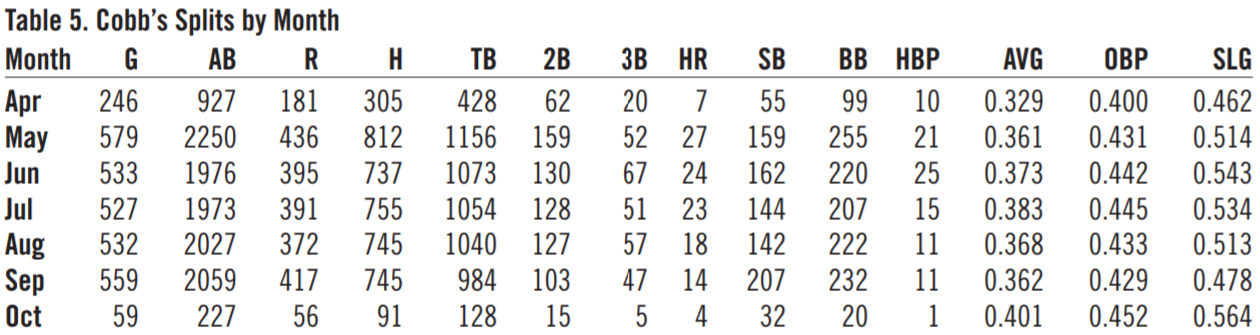
Cobb tended to start off cool in the cool month of April—he had a mere .329 average. But he quickly turned up the heat as the summer grew warmer. His best months were June and July, where he had a .985 and .979 OPS, respectively. As shown in the next section, Cobb’s best months did in fact tend to be June and July.
He also tended to steal more bases at the very end of the season (September and October), perhaps knowing that every run was more valuable to his team as the pennant race came down to the wire. At the very least, Cobb’s famous offseason training (he added weights to his boots when he went hunting) allowed him to keep fresh legs even in September. (See table 6.)
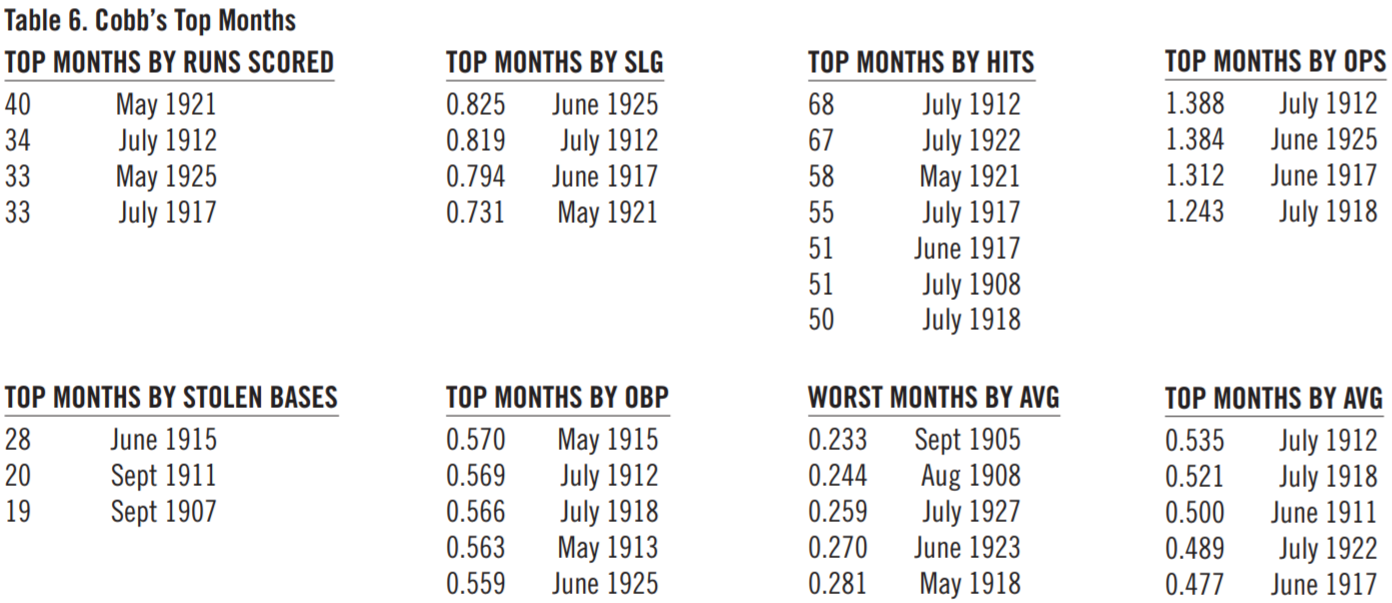
Of the 91 months in his career in which he had at least 75 at-bats, Cobb hit below .270 in only three of them. In fact, he hit below .280 in a month only four times! Compare that to Ichiro Suzuki, who has had 53 months of 75 or more at-bats during his career but has already had nine months below .270 and eleven below .280.
Cobb’s 68 hits in July 1912 is the all-time MLB record; over the last fifty seasons, the most hits in any month is 56 by Ichiro Suzuki in August 2004. Cobb’s .535 average in July 1912 is believed to be the MLB record for a full month; the highest over the last fifty seasons is .512 by Todd Helton in April 2000.
Even Cobb’s run-scoring and base stealing marks would stand up well against modern totals. His 40 runs in May 1921 would match the highest total in the last fifty years; Chuck Knoblauch also accomplished this in July 1996. Only two players in the last fifty years have had more steals than Cobb did (28) in June 1915: Rickey Henderson (33 in July 1983 and 31 in September 1980) and Lou Brock (29 in August 1974).
HITTING STREAKS
Naturally, Cobb is one of the most prodigious hit-streakers in MLB history. He had eight separate 20-game hitting streaks during his career, which matches Willie Keeler and Pete Rose for the most ever. In fact, his totals for all of the following are believed to be MLB records:
- 66 streaks of 10+ games
- 18 streaks of 15+ games
- 8 streaks of 20+ games (40g, 35g, 23g, 22g, 21g, 21g, 21g, 20g)
- 2 streaks of 30+ games (40g, 35g)
A Word about the Numbers
Some of you may notice that the splits I present for Cobb don’t always sum up to his accepted career totals. There are two primary reasons for this:
- Some of the stats in encyclopedias (such as RBIs pre-1920 and early extra-base hits) were calculated ex post facto by researchers who left only season totals—but no game-by-game stats—and so I either had to research them myself or leave the totals blank; and
- The official sheets are riddled with errors—players’ lines switched, numbers transposed, and arithmetic errors.
As a result, I am still combing through Cobb’s stats, looking for additional corrections that may need to be made, and I’m also working on cataloging Cobb’s pre-1920 RBI. I present details below of a few of the errors that I came across in Cobb’s official sheets. This list is nowhere near complete.
- Oct 1 and 2 (game 1), 1907: Cobb’s steals and sacrifice bunt totals were transposed on the ledger sheets, giving him five too many sacrifice bunts and five too few stolen bases.
- 1909: Addition error on first page of Cobb’s sheets over-credited him by one run.
- 1911: Addition error on second page of Cobb’s sheets over-credited him by one at-bat.
- May 9, 1912: Cobb hit a home run but wasn’t given a run scored on the official sheets.
The fielding stats of the time are in even worse shape than the batting stats are. For instance, Cobb played at second base in the final game of 1909, but I did not discover this fact for almost one hundred years!
CONCLUSIONS
The splits above can help us compare Cobb’s numbers to modern-day greats, whose splits and numbers are available at the click of a mouse on Retrosheet.org and baseball-reference.com. Until now, we’ve never known if Cobb was a product of a friendly home ballpark, or if he struggled against lefties, or how he really hit against Walter Johnson. Now we finally have numbers to back up the proposition that Cobb could hit pretty much any pitcher at any stadium during any month of the year!
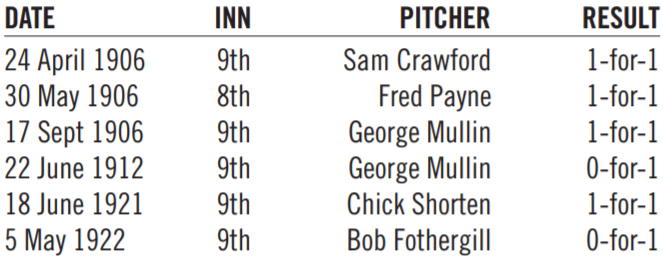
As a final interesting note: Several sources have claimed that only one man has ever pinch-hit for Ty Cobb. Bob Fothergill is usually identified as the lucky man. However, in my research going through Cobb’s game-by-game stats, I discovered that there have actually been several men to pinch-hit for Cobb. Here is the list of those known to have done it:
Acknowledgments
I’d like to thank Steve Gietschier, Pete Palmer, Bob McConnell, and all the volunteers at Retrosheet for contributing info used in this article.
Notes
1 It’s also well known that Cobb’s numbers are constantly Cobb originally was listed with 4,191 career hits. However, a missing hit from 1906 bumped the total to 4,192. Two hits being double-entered in 1910 reduced it to 4,190. An error from 1912 reduced it further to 4,189; however, writer Mark Stang and I recently came across a canceling error from 1912 that put Cobb back at his current total of 4,190 hits.