

Were Pitchers More Likely to Throw at Black Batters? 1947–66
This article was written by Jerry Nechal
This article was published in Fall 2022 Baseball Research Journal
A generally accepted narrative of the early days of baseball integration is that White pitchers deliberately threw at Black batters. According to Ken Burns’ Baseball, when Jackie Robinson broke the color barrier, “Pitchers threw at his head.”1 His counterpart in the American League, Larry Doby, stated, “I was knocked down in many games. I was hit more by pitched balls than any player of equal power in the league.”2
There exists some documentation to support these claims. The most widely publicized was a 1947 incident where Philadelphia Phillies manager Ben Chapman instructed his pitchers when to throw at Robinson.3 Likewise, pitcher Hank Wyse confirmed that Cubs pitchers had standing orders to knock Robinson down. “Paul Erickson knocked him down four times…”4
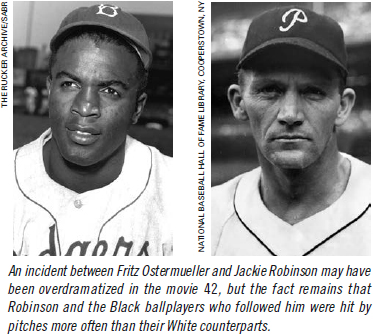
Consistent with this directive, in the film 42, Pirates pitcher Fritz Ostermueller is depicted as both verbally abusing and deliberately throwing at Robinson.5 Years later, one of Ostermueller’s teammates confirmed the pitcher’s intentions.6 Unfortunately, verbal confirmation of these incidents is sparse and mostly confined to the 1947 season. However, we can undertake a statistical study rather than rely on anecdotes.
The ranking of batters by the number of times hit per season 1947–56 reveals evidence to support the narrative. A Black player ranked first or second in either the AL or NL hit by pitch category 16 times from 1947 through 1956. A brief review of those who ranked in the top ten in both leagues on the hit-by-pitch leaderboard reveals a disproportionate share of Black players, as well. Although representing only slightly over four percent of the total player population, out of the top ten percent of players being hit by pitch, Black players made up over 16 percent of that group.
PRIOR RESEARCH
A search for quantitative analysis of pitchers intentionally throwing at Black batters produced minimal results. Little seems to have been done in this area, with one recent exception. In April 2020, Bryce Kanago and David George Surdam published a study titled “Intimidation, Discrimination, and Retaliation: Hit-by-Pitches during the Integration of Major League Baseball.”7 Their work analyzes AL and NL batters hit by pitchers from 1947 through 1956.
They attempted to determine if Black batters were hit more often because of their superior performance rather than the color of their skin. Using advanced regression analysis, Kanago and Surdam adjusted for performance, but still found that differences exist between Black and White batters in the likelihood of being hit by a pitch. They also found that superior-performing Black players are more likely to be hit than superior-performing White players.
While this one study supported the premise that Black batters were targeted in the early days of baseball integration, more research is needed in this area. The Kanago and Surdam study is restricted to the first ten years of baseball integration when the percentage of Black players remained small, partially due to racial quotas.8 In the final year of their study, 1956, there were still only 25 batters in their research calculations. For statistical purposes, larger sample sizes are always preferred.
Besides the need for further confirming research, other important questions remain regarding White pitchers throwing at Black batters. If widespread targeting did happen, how long did it last? Was the practice curtailed as more Black players entered the leagues? This study will explore the answers to these questions by examining data covering a longer time period. For analytical purposes, it will extend the range of study to cover the first two decades after integration, from 1947 through 1966. Likewise, this study will attempt to address the question of small sample sizes in the early years of baseball integration.
METHODOLOGY
Within this study, the vital statistic is this: times hit by pitched ball (HBP). Whether a pitcher deliberately threw at a batter is a subjective decision for which no data exist. If certain players were deliberately targeted, then it is logical that those same players would ultimately be more likely to be hit by pitches. Certain batters are hit more frequently than others for various reasons, such as crowding the plate or deliberately diving into pitches.
However, this analysis assumes that those characteristics would be evenly distributed across both White and Black players. Adopting these assumptions, the likelihood that a Black player was targeted can be measured by calculating the number of times batters were hit relative to the number of times they came to bat.
For the purposes of this study, only players who had 200 or more plate appearances in a single season were considered. Establishing this thresh-old excludes observations which are not representative of a regular player. These overall data are readily available in Baseball-Reference.com, both by individual player and aggregated into totals by league.
The first obstacle was the challenge of separating the data into racial categories. Standard baseball statistical resources do not identify players by race. Fortunately, an earlier research project had faced and overcome the same problem. In his pioneering study, “The Effects of Integration, 1947–1986,” Mark Armour assembled a list of Black major league players by year.9 This study uses that list as the final authority on identifying Black players. Also for purposes of this study, “White” was defined as any non-Black player, including those of Latino, American Indian, and Mexican descent.
The next step was to list and total both the number of plate appearances (PAs) and the number of HBPs for each player making 200 or more plate appearances by year. Because of the difficulty in producing the data, no distinction was made regarding which plate appearances were against Black pitchers versus White pitchers. As with Black batters, there were relatively few Black pitchers in the first two decades of baseball integration covered by the study. A comparison of the White and Black groups was made by calculating the average of total plate appearances divided by total HBPs.
![]()
INITIAL RESULTS
The results for each of the first 10 years studied showed that Black batters were hit by pitches more frequently than their White counterparts. The average number of plate appearances per HBP was lower for Black batters. For example, in 1950 White batters were hit by a pitch once every 219 plate appearances. For Black players, this number was every 112 times, or nearly twice as often. Figure 1 shows these results for the first five years of baseball integration.
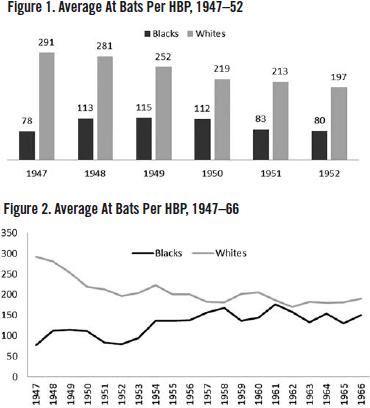
One would expect that as the presence of Black players became more accepted, pitchers would throw at them less often. If so, the differences in average plate appearances per HBP between the two groups would diminish. Figure 2 shows that to be the case over twenty years, with the annual difference between year one and year ten being greater in the first decade than in the second.
In the second decade the difference between White and Black is narrower, although the rates fluctuate by year. Nevertheless, there is no single year in the entire 20 years where Black players are hit less often than White ones. Even in the final year of 1966, the difference between the two groups widens again—White: 190 PA, Black:150 PA.
VALIDITY TESTING
While collecting and compiling the data for this study, one major concern regarding the validity of its conclusions stood out. For the first ten years, the total number of Black players was very small relative to the total number of White players. In 1947, 170 White players and one Black player—Jackie Robinson—met the 200 plate appearances criterion. The number of Black players in Jackie’s wake increased year by year, but quite slowly. For example, in 1953 there were still only 11 Black players who came to bat at least 200 times.
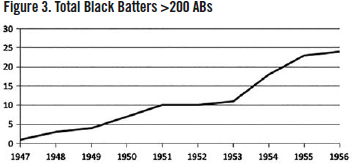
Figure 3 shows that although the number of black batters with over 200 ABs grew steadily over that first decade, the number was still below 25 batters in 1956.
With the small population sizes of the Black players, the data are potentially subject to distortions due to outliers or other variables such as those suggested by Kanago and Surdam in their 2020 study. One or two players could possibly distort the results. In statistical terms this does not result in a normal distribution. For example, Minnie Miñoso, a Black player who ranks number eleven in all-time HBPs, first qualified for the study group in 1951 when there were only nine other Black players with 200 PAs. In that year he was hit by pitches a league-leading 16 times. He averaged 17 over the next six years.
It is not as if there weren’t White counterparts to Miñoso. For example, in that same year (1951), Nellie Fox was hit by 14 pitches. However, his total was spread over a much larger distribution of White players. It should be noted that Kanago and Surdam attempted to adjust for players with high hit-by-pitch numbers by excluding them from their analysis.
With the small number of Black batters, the use of standard statistical testing methodologies is problematic. A common rule of thumb among statisticians, following the Central Limit Theorem, is that sample sizes should be at least 30 or more.10 The reaching of this minimum threshold increases the likelihood that the sample will approach a normal distribution. In our case, this can prevent the possibility that players like Miñoso can distort the findings.
Because of the small number of Black players, especially in the early decade, this study avoided statistical testing for single seasons. Instead, it aggregated data for the first ten years into one larger period. The data for all ten seasons were aggregated in order to produce a sample size of Black players of at least 30 in total. This method showed that across all ten seasons there were a total of 34 Black players that had at least one season where they achieved 200 or more plate appearances. This total population of Black players was used as the sample. To produce an equivalent comparative group, 34 White players were randomly selected from a pool of 435 eligible White players from the same ten year period.
To test the hypothesis as to whether there is a significant difference between the two groups, the Z Test for Difference of Proportions was selected.11 This tool allows us to conduct a null hypothesis test to determine whether the difference between two proportions is statistically significant. The null hypothesis theorizes that there is no difference between the two groups. If the null hypothesis is rejected, then there is a statistically significant difference in the two groups. In our case the proportions are calculated as follows:
![]()
Total plate appearances for each group were surprisingly close in number: Black: 58,864, White: 54,107. Within the actual formula, these numbers were used as the sample size. For Black players, the calculated proportion was .0086; for the White sample, it was .00462. After inputting these values into the Z test formula, the result is a minute p-value of .0001%. For the 95 percent confidence interval all p-values below 5% indicates a rejection of the null hypothesis. Even with a 99% confidence level, where p-values need to fall below 1%, the null hypothesis is rejected. Thus, in our case, there is a statistically significant difference between the two groups being hit by pitched balls during the ten-year period of 1947 through 1956.
Testing or analysis of the next ten years (1957–66) is more problematic. As Figure 2 illustrates, the difference in frequency of HBPs between the two groups narrowed, although there was no consistent trend. The number of Black batters finally did reach the statistical testing milestone of 30 in 1958. The total was a robust 66 in 1966. Thus, for this ten year period, the data were not aggregated. Z tests for Difference in Pro-portions were conducted for each of these ten seasons. Table 1 shows the results.
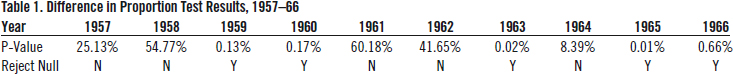
Over this second decade of baseball integration, the null hypothesis was rejected five times and accepted five times. Additionally, there was no linear trend across this time span. In other words, there does not appear to be a consistent, clear difference between White and Black players in terms of the likelihood of being hit by a pitch. It is still worth noting that for this second decade, just as in the first, the yearly rate at which Black batters were hit by pitches always exceeded that of White batters.
CONCLUSIONS
The raw numbers and statistical testing do support the idea that White pitchers deliberately threw at Black batters in the first decade of baseball integration (1947–56). This phenomenon appears not to be just something that was directed at the few initial pioneers of integration; it lasted for several years. Over the first decade of integration, Black batters were nearly twice as likely to be hit by a pitch as White batters. That there was a difference between the groups was unequivocal, and tested out statistically at the 99 percent confidence level.
However, as speculated, when baseball integration extended into a second decade, it is less clear that White pitchers deliberately threw at Black batters. When the percentage of Black players became larger, statistically significant differences between the two groups were inconsistent. This could be attributable to either larger sample sizes or that discrimination by White pitchers against Black batters became less prevalent. Despite this conclusion, Black batters were still hit by pitches more frequently than White batters in every season of the study period from 1947 through 1966. Further study is needed to determine if or when this latter phenomenon ended.
JERRY NECHAL is a retired former administrator at Wayne State University, residing in Sylvan Lake, Michigan. He has previously written about “The Worst Team Ever” in the Baseball Research Journal as well as making several contributions to both the SABR Biography Project and the Games Project. Other interests include hiking, architecture, theater and gardening. He still longs for a bleacher seat in old Tiger Stadium.
Acknowledgments
The following two faculty members of Wayne State University, Detroit, contributed to this study through their advice and suggestions: Ty Partridge, PhD Associate Professor, Director, Research Analysis and Design Unit Department of Psychology and David Merolla, PhD, Associate Professor and Chair Department of Sociology.
Notes
1. “Inning 6.” Baseball, created by Ken Burns, National Endowment for the Humanities, 1994.
2. Jackie Robinson, Baseball Has Done It (Philadelphia & New York: J. B. Lippincott Company, 1964), 63.
3. Brian Carroll, When to Stop the Cheering? (Abingdon, England: Rutledge, 2006), 162–63.
4. David Falkner, Great Time Coming (Simon & Schuster: New York, 1995), 165.
5. Brian Helgeland (Director). (2013). 42 (Film) Legendary Pictures.
6. Bruce Markusen, “Cooperstown Confidential: What really happened with Fritz Ostermueller and Jackie Robinson,” The Hardball Times, May 10, 2013, https://tht.fangraphs.com/cooperstown-confidential-what-really-happened-with-fritz-ostermueller-and-j.
7. Bryce Kango and David George Surdam, “Intimidation, Discrimination, and Retaliation: Hit-by-Pitches during the Integration of Major League Baseball,” Atlantic Economic Journal, 48(1), 67–85.
8. Lee Lowenfish, “The Rise of Baseball’s Racial Quota System in the 1950s,” Nine, Volume 16, No. 2, (Spring 2008}, 52.
9. Mark Armour, “The Effects of Integration, 1947–1986.” SABR Baseball Research Journal, Volume 36 (2007).
10. “Why is the minimum sample size 30?” Treehozz, last updated May 6, 2020. https://treehozz.com/why-is-theminimum-sample-size-30
11. Deborah A. Rumsey, “How to Estimate the Difference between Two Proportions,” dummies, https://www.dummies.com/education/math/statistics/how-to-estimate-the-difference-between-two-proportions.