

Where Have You Gone, Carl Yastrzemski? A Statistical Analysis of the Triple Crown
This article was written by John Daniels
This article was published in 2008 Baseball Research Journal
All I want out of life is that when I walk down the street folks will say, “There goes the greatest hitter that ever lived.” —Ted Williams
In the 216 combined seasons of the modern era (1901—2008) in baseball, there have been 14 winners (9 in the American League, 4 in the National League) of the Triple Crown (TC). The TC winner is the league leader in batting average, home runs, and runs batted in a single season. The TC winners are listed in table 1.

It is interesting to note the following facts about the TC:
- As of 2008, it has been 41 years since the last TC winner (Carl Yastrzemski, 1967).
- Before this 41-year drought, the longest period without a TC winner was 12 years (1910—21).
- With the exception of 1910—19, from 1901 through 1969 each decade had at least one TC winner.
In light of this, I will investigate here the absence of a TC winner since 1967, using the database at www.baseball1.com to examine the past 108 years of AL and NL hitting data.
Eligibility
To lead the league in BA, a player must meet the eligibility rules. These rules have changed over time.
- Before 1920, a player must have appeared in 60 percent of the team’s games to qualify for a batting title. This number was rounded to the nearest integer.
- From 1920 through 1944, a player must have appeared in 100 games, except for the AL in 1938. That year Jimmie Foxx (.349 in 149 games) was awarded the batting title over Taffy Wright (.350 in 100 games). The relatively low number of games a player had to play to qualify would cost Foxx (.364 in 154 games) the Triple Crown in 1932, when Dale Alexander (.367 in 124 games) was awarded the batting crown.
- From 1945 through 1956, a player must have had 2.6 at-bats per team game.
- From 1951 through 1954, a player could lead if he still led after the necessary number of hitless at-bats were added to his at-bat total.
- From 1957 to the present, a player must have 3.1 plate appearances per team game. From 1967 to the present, a player could win the batting title if he still led after the necessary number of hitless plate appearances were added to his AB total. The application of this rule enabled Tony Gwynn (.353) to win the batting title in 1996.
So, for the purpose of analyzing the data with some consistency, I will use the current rule (3.1 plate appearances per game) throughout my analysis. It should be noted that, on five occasions (1904, 1915, 1918 in the AL, and 1919 in the NL) in the Dead Ball Era, the leader in HR did play in 60 percent of his team’s games but did not have the modern requirement of 3.1 plate appearances. For this study, these players were not considered eligible, but even if they were they would not have won the TC.
DISTRIBUTION OF BA, HR, AND RBI
Let’s take a closer look at the numeric distributions of the three variables involved in the Triple Crown. Because of their similarity, both the American League and National League distributions were combined. Figure 1 provides the frequency distribution of these variables for all eligible players from 1901 through 2005 and shows how different the distribution of HR is from the distribution of BA and RBI.
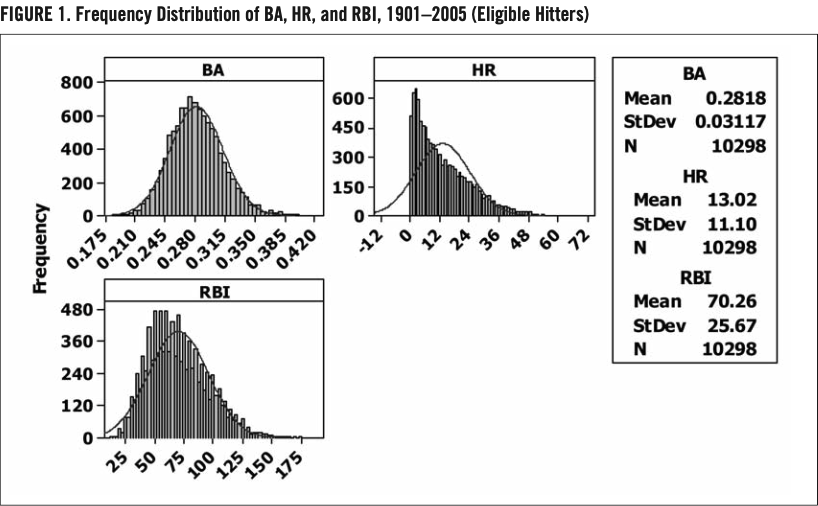
As shown in figure 1, both BA and RBI are mound-shaped and slightly right-skewed. HR is clearly not mound-shaped but is right-skewed. DeVany (2006) claims HR is a stable Paretian probability distribution with a finite mean and an infinite variance. To simplify things, if we were to consider HR as an exponentially distributed random variable (with μ=13.02), the 99th percentile would be approximately 4.61 standard deviations above the mean versus only 2.575 standard deviations above the mean for a normally distributed random variable (BA and RBI). So a TC winner must be first and foremost a prolific home-run hitter. Common sense tells us this, but these distributions provide some verification.
STATISTICAL DEPENDENCY OF BEING THE LEAGUE LEADER
The probability of leading the league in one of these categories is not statistically independent of leading in the other two categories. For example, hitting a HR also increases both BA and RBI. If 216 years of combined AL and NL baseball data are examined we can see the following (table 2).
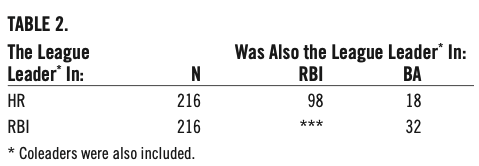
If you led the league in HR, you have a higher probability of winning the RBI crown (98/216 = .454) than of winning the BA title (18/216 = .083). The product of these two probabilities (.454 x .083 = .038), if we assume statistical independence and the rules of conditional probabilities, would be the probability of winning the TC [P(TC)]. As noted above, there have been 13 TC winners in 216 combined years of baseball. So, we estimate P(TC) = 13/216 = .060. Since .038 ≠ .060, these events are not statistically independent of each other. It would further simplify things if we had both statistical independence and a uniform probability distribution (1/n) for all three variables. Under this situation, the probability of winning the TC for a randomly selected batter would simply be the product of leading the league in each category (1/n), or
P(TC) = (1/n) x (1/n) x (1/n) = (1/n3) [1]
Of course this isn’t the case. For example, in a league with only 10 competitors there would be only a 1/1000 = .001 probability of winning the TC. This would be an extremely rare event, even rarer than in actual baseball history. So any estimation of probabilities associated with the TC must account for this lack of statistical independence as well as for the nature of the distributions.
THE EFFECT OF COMPETITION
Don’t look back; something may be gaining on you. — Satchel Paige
It is no secret that increased competition makes it tougher to dominate in one’s chosen endeavor. AT&T, General Motors, and McDonald’s were all once dominant icons of their respective industries. However, success breeds imitation. An increase in competition has reduced these corporations to competitors, not dominators, vying for market share. Such an analogy is comparable when evaluating hitters. One can argue that increased competition makes it more difficult for any one player to dominate in all three TC categories. Figures 2 and 3 depict the increase in hitting competition within the American League and the National League, respectively, using the current eligibility requirement of 3.1 plate appearances per team game.
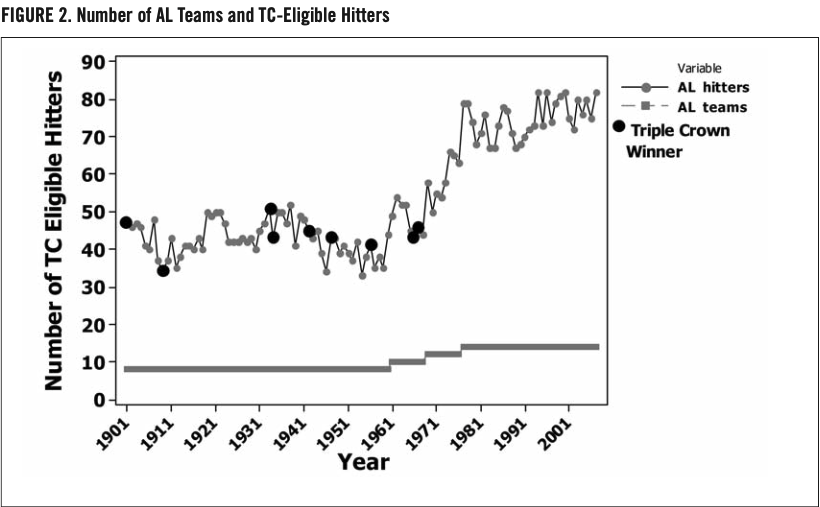
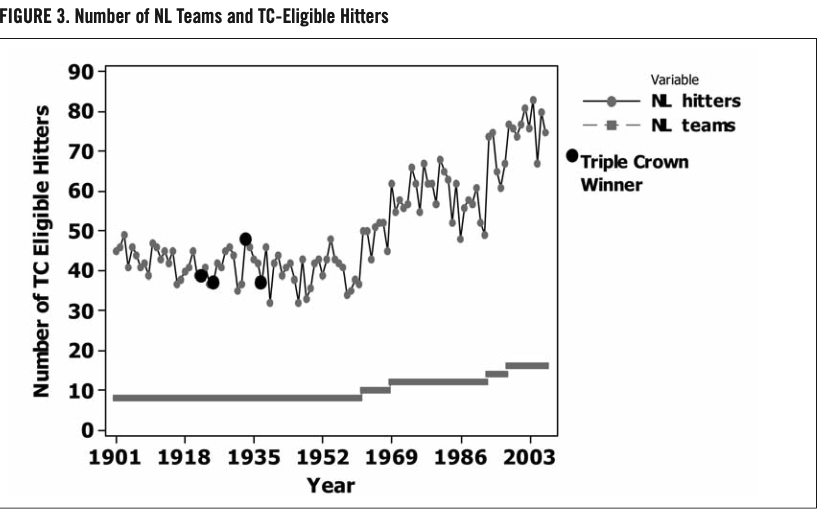
Note that, while the eligible-hitter trends in figures 2 and 3 are increasing, they are somewhat erratic. The trend toward increase, starting around 1969, can be explained by league expansion and the designated hitter in the AL beginning in 1973. The erratic nature of the trend can perhaps be explained by the random influence of player injuries, platooning, interleague trades, labor strikes (resulting in fewer games played), etc. For years with TC winners, the total number of competitors is summarized in table 3.
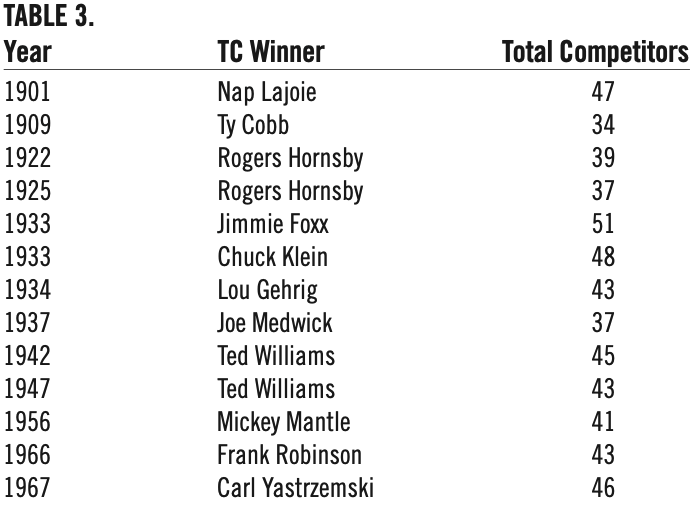
The smallest number of TC competitors was 34 (Cobb, 1909); the largest number was 51 (Foxx, 1933). Although figures 2 and 3 show that there is an overall increase in hitting competition, the trick is to understand just how much influence this increase has on the probability of winning the TC. Since using equation [1] will not produce the desired results, we will first simulate winning the TC. Intuitively, we expect this simulation to show that an increase in competition will reduce P(TC). The exact nature of this relationship, however, needs to be investigated. Once the relationship is determined, a statistical model can be constructed.
TRIPLE CROWN SIMULATION AND STATISTICAL MODELING
This analysis will be a two-stage process:
- Simulate batting results to determine the functional relationship between the number of competitors and the probability of winning the Triple Crown.
- Using a chosen statistical model, estimate the parameters of this functional relationship using the actual TC results.
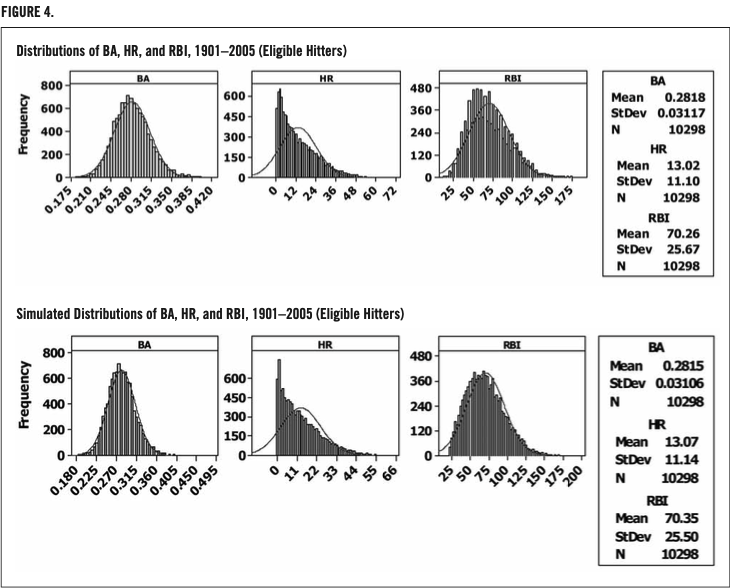
To perform stage 1, I used Fleischman’s (1978) Power Method and some SAS programming guidelines from Fan and Fan (2005) to create a population (and subsequent random sample). This simulated population is given in the top panel of figure 4. Note the close similarities with the data in the left panel, the actual frequency distributions previously given in figure 1.
The simulation is conducted as follows:
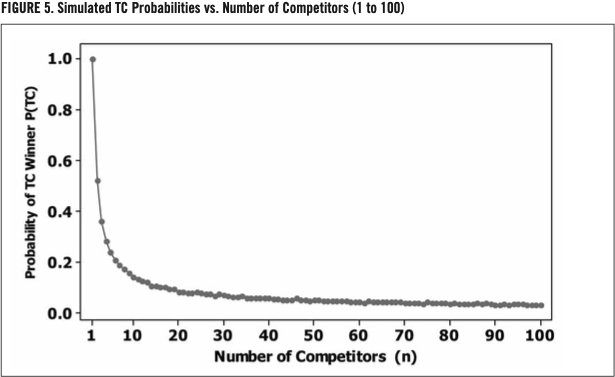
A random sample of size n competitors is taken from the simulated population. If a player in this sample wins the Triple Crown among his competitors, this event is noted. This process is repeated 10,000 times and the probability of winning the TC for n competitors is calculated as P(TC) = number of times TC won/10,000. The process is then repeated for an increasing n, and the probability of winning the TC for each n is calculated. We might expect some sort of decreasing curve, since under independence the curve would follow equation [1]. It should be emphasized here that the objective at this stage is only to verify the mathematical nature of the relationship between P(TC) and n, not to estimate the actual probabilities. The results of the simulation are provided in figure 5.
As expected, the relationship between P(TC) and the number of competitors is some sort of monotonic decreasing curve.
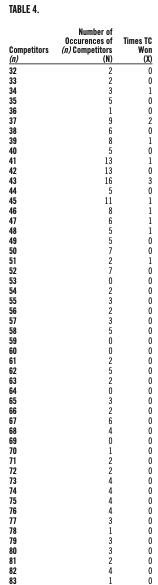
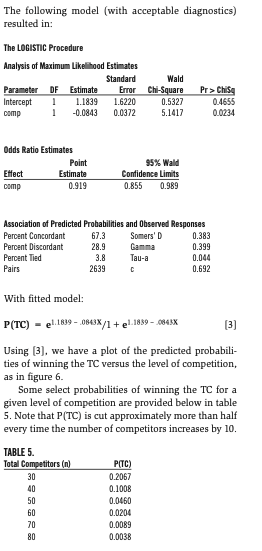
Because winning the Triple Crown is a dichotomous outcome (Yes=1 vs. No=0) and the relationship appears monotonic decreasing, it was decided to fit the empirical data in table 4 to a logistic regression model. The general form of the logistic function is
P(TC) = eb0 + b1X / 1 + eb0 + b1X [2]
in which X represents the number of competitors and b0 and b1 represent the parameters to be estimated. Table 4 summarizes the occurrence of TC winners at the different levels of competition.
(Click image to enlarge)
(Click image to enlarge)
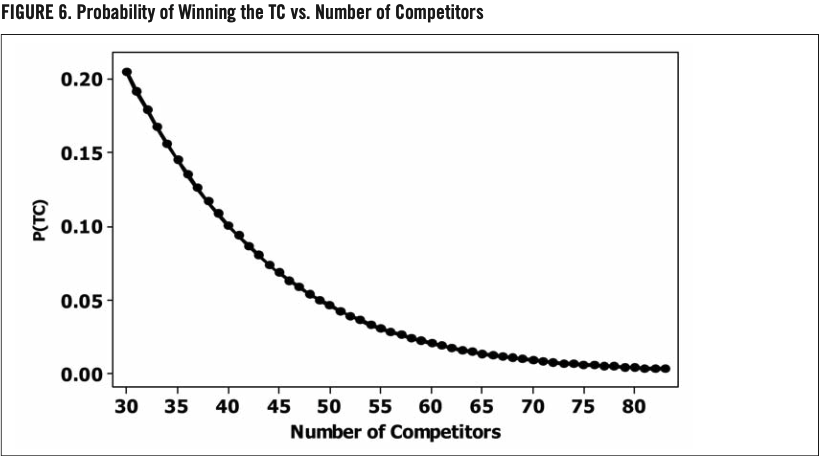
When we examine the years 1901 through 67, we see that the mean P(TC) = .080. From 1968 through 2007, the mean P(TC) = .0150 and is more than an 81 percent decrease. In the year 2008 alone, there were 68 TC-eligible competitors in the AL, which has a predicted P(TC) = .010. This is more than an 88 percent decrease in probability from the mean in the period 1901—67.
CLOSE, BUT NO CIGAR
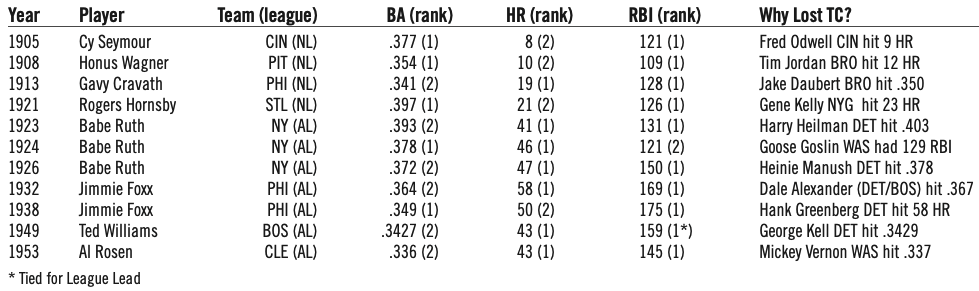
For further evidence of the influence that competition has on the TC, let’s examine those players who ranked first in two TC categories but second in the remaining category (table 6).
Except for Yastrzemski in 1967, no player since 1953 has come as close as the players listed in table 6. The closest in the American League was Dick Allen (White Sox), who in 1972 hit .308 with 37 HR and 113 RBIs but finished third in BA, behind Rod Carew (Twins, .318) and Lou Pinella (Royals, .312). Jim Rice (Red Sox) in 1978 hit .315 with 46 HR and 139 RBIs but finished third in BA, behind Rod Carew (.333) and Al Oliver (Rangers, .324). In the National League, Dante Bichette (Rockies) hit .340 with 40 HR and 128 RBIs but finished third in BA, behind Tony Gwynn (Padres, .368) and Mike Piazza (Dodgers, .346). The effect of increased competition has not only reduced the chance of a player winning the TC. It has kept players from even coming close.
Table 6
WAITING FOR “MR. RIGHT”
It is sometimes argued that the right batter simply hasn’t come along: “When baseball’s next Michael Jordan or Tiger Woods appears, then we’ll have another Triple Crown winner.” Perhaps, but let’s examine some of the superlative batting performances over the past 40 years. Looking at table 7, we can see that there have certainly been some excellent hitters, to judge from their performances. Their numbers are as good as or better than Yastrzemski’s in 1967, although here I have not standardized their values relative to those of their peers.
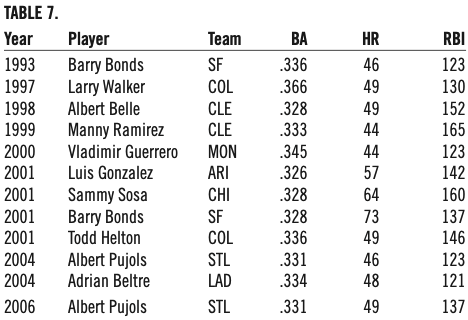
Moreover, there have been hitters who have finished first in each of the TC categories but in different years (Barry Bonds, Alex Rodriguez, Andres Galarraga). The talent is clearly there, but the increased level of competition makes it difficult to dominate in all three hitting categories simultaneously.
Conclusion
In my opinion, the Triple Crown winner is probably extinct. Changes to the game that have continued to increase the number of competing hitters (expansion, the designated hitter) have significantly decreased the probability of a hitter ever winning the Triple Crown. Granted, the evidence presented here is based on correlated rather than causal relationships, but, still, it requires some explanation that no one has won the Triple Crown in the past 41 years. At the very least, we can say that a contemporary player who has the tools to be considered a TC candidate faces barriers that are more formidable than those faced by his predecessors forty years ago.
JOHN DANIELS is an Assistant Professor of Statistics at Central Michigan University.
Notes
The data for this analysis was provided by Sean Lahman, Lahman’s Baseball Archive Database (v. 5.5), at www.baseball1.com. Any discrepancies between this database and other commonly used baseball databases should not affect the conclusions I present in this article.
Sources
Baseball Almanac, www.baseball-almanac.com.
DeVany, A. “Steroids, Home Runs and the Law of Genius.” http://www.arthur-devany.com/webstuff/images/DeVanyHomeRunMS.pdf (2005).
ESPN, http://sports.espn.go.com/mlb/statistics (2008).
Fan, X., and X. Fan. “Using SAS for Monte Carlo Simulation Research in SEM.” Structural Equation Modeling, 12, no. 2 (2005): 299—333.
Fleischman, A. I. (1978). “A Method for Simulating Non-Normal Distributions.” Psychometrika 43 (1978): 521—32.
Lahman, S. Lahman’s Baseball Database (version 5.5, 2007). http://www.baseball1.com.