

Which Great Teams Were Just Lucky?
This article was written by Phil Birnbaum
This article was published in SABR 50 at 50
This article was published in SABR’s Baseball Research Journal, Vol. 34 (2005).
A team’s season record is massively influenced by luck. Suppose you take a coin and flip it 162 times to simulate a season. Each time it lands heads, that’s a win, and when it lands tails, that’s a loss. You’d expect, on average, to get 81 wins and 81 losses. But for any individual season, the record may vary significantly from 81-81. Just by random chance alone, your team might go 85–77, or 80–82, or even 69–93.
Suppose you were able to clone a copy of the New York Yankees, and play the cloned team against the real one. (That’s hard to do with real players, but easy in a simulation game like APBA.) Again, on average, each team should win 81 games against each other, but, again, the records could vary significantly from 81–81, and the difference would be due to luck.
As it turns out, the range and frequency of possible records of a .500 team can be described by a normal (bell-shaped) curve, with an average of 81 wins and a standard deviation (SD) of about six wins. The SD can be thought of as a “typical” difference due to luck — so with an SD of six games, a typical record of a coin tossed 162 times is 87–75, or 75–87. Two-thirds of the outcomes should be within that range, so if you were to run 300 coin-seasons, or 300 cloned-Yankee seasons, you should get 200 of them winding up between 75 and 87 wins.
More interesting are the one-third of the seasons that fall outside that range. If all 16 teams in the National League were exactly average, you’d nonetheless expect five of them to wind up with more than 87 wins or with fewer than 75 wins. Furthermore, of those five teams, you’d expect one of them (actually, about 0.8 of a team) to finish more than 2 SDs away from the mean — that is, with more than 93 wins, or more than 93 losses.
This is a lot easier to picture if you see a real set of standings, so Table 1 shows a typical result of a coin-tossing season for a hypothetical National League where every team is .500.
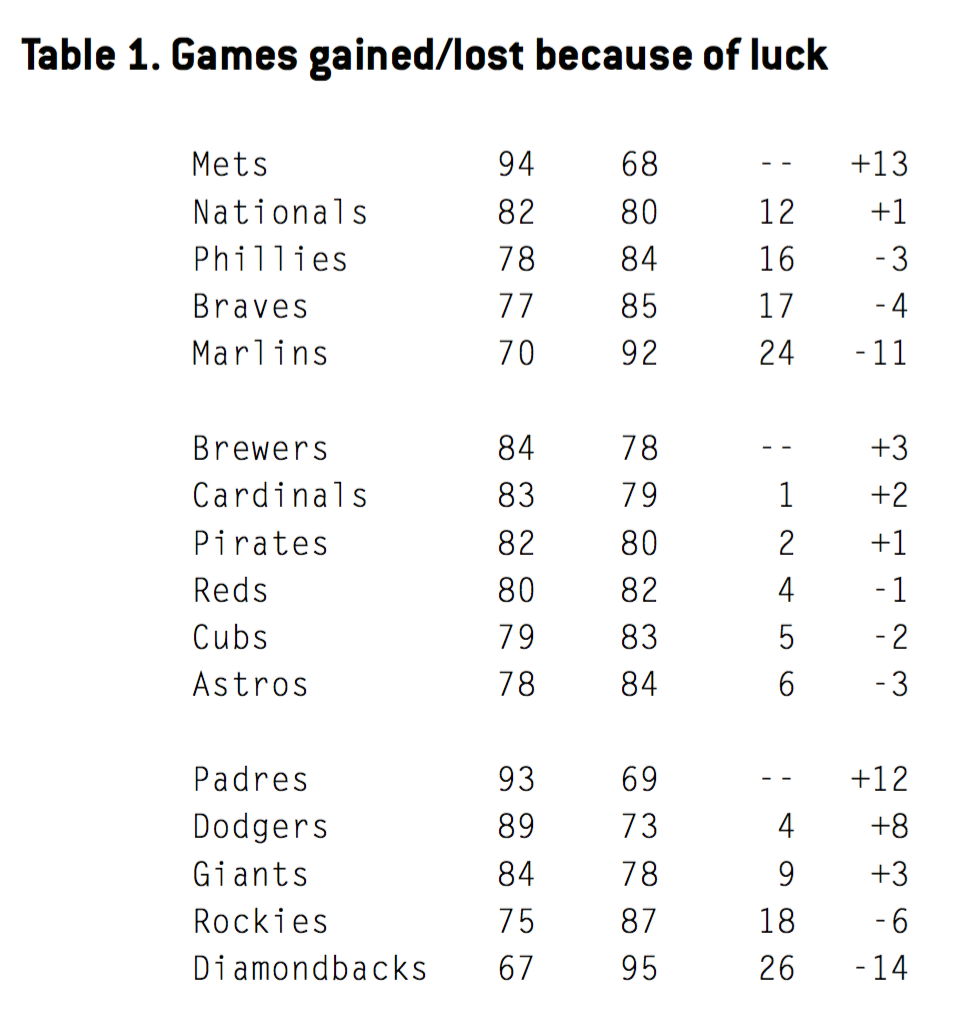
In this simulated, randomized season, the Mets in the East and Diamondbacks in the West were both really .500 teams — but, by chance alone, the Mets finished ahead of Arizona by 27 games!
As it turns out, this season is a little more extreme than usual. On average, the difference between the best team and the worst team will be about 24 games, not 27. Also, there should be only one team above 93 wins (we had two), with the next best at 89.
Real Seasons
So far this is just an intellectual exercise because, of course, not every team is a .500 team. But even teams that aren’t .500 have a standard deviation of around six games, so a similar calculation applies to them.
For instance, suppose you have a .550 team, expected to win 89 games. That’s eight games above average. To get a rough idea of the distribution of wins it will actually get, you can just add those eight games to each row of Table 1. So, if our .550 team plays 16 seasons, in an extremely lucky season it’ll finish 102–60, and in its unluckiest season it will go only 75–87 — still a swing of 27 games (although, as we said, 24 is more typical). It’s even possible that those two seasons will be consecutive, in which case the team will have fallen from 102 wins down to 75 in one season — and only because of luck!
If, in an average season, one team will drop 12 or more games out of contention for no real reason, and some other team will gain 12 games, it’s pretty obvious that luck has a huge impact on team performance.
Which brings us to this question: is there a way, after the fact, to see how lucky a team was? The 1993 Philadelphia Phillies went 97–65. But how good were they, really? Were they like the top team in the chart that got 13 games lucky, so that they really should have been only 84–78? Were they like the bottom team in the chart that got 14 games unlucky, so that they were really a 111–51 team, one of the most talented ever? Were they even more extreme? Were they somewhere in the middle?
This article presents a way we can find out.
Luck’s Footprints
A team starts out with a roster with a certain amount of talent, capable of playing a certain caliber of baseball. It ends up with a won-lost record. How much luck was involved in converting the talent to the record?
There are five main ways in which a team can get lucky or unlucky. Well, actually, there are an infinite number of ways, but those ways will leave evidence in one of five statistical categories.
1. Its hitters have career years, playing better than their talent can support.
Alfredo Griffin had a long career with the Blue Jays, A’s, and Dodgers, mostly in the 1980s. A career .249 hitter with little power and no walks, his RC/G (Runs Created per Game, a measure of how many runs a team would score with a lineup of nine Alfredo Griffins) was never above the league average.
Griffin’s best season was 1986. That year he hit .285, tied his career high with four home runs, and came close to setting a career high in walks (with 35). He created 4.16 runs per game, his best season figure ever.
In this case, we assume that Alfredo was lucky. Just as a player’s APBA card might hit .285 instead of .249 just because of some fortunate dice rolls, we assume that Griffin’s actual performance also benefited from similar luck.
What would cause that kind of luck? There are many possibilities. The most obvious one is that even the best players have only so much control of their muscles and reflexes. In The Physics of Baseball, Robert Adair points out that swinging one-hundredth of a second too early will cause a hit ball to go foul — and one-hundredth of a second too late will have it go foul the other way! To oversimplify, if Griffin is only good enough to hit the ball randomly within that .02 seconds, and it’s a hit only if it’s in the middle 25% of that interval, he’ll be a .250 hitter. If one year, just by luck, he gets 30% of those hits instead of 25%, his stats take a jump.
There are other reasons that players may have career years. They might, just by luck, face weaker pitchers than average. They may play in more home games than average. They may play a couple of extra games in Colorado. Instead of 10 balls hit close to the left-field line landing five fair and five foul, maybe eight landed fair and only two foul. When guessing fastball on a 3–2 count, they may be right 60% of the time one year but only 40% of the time the next.
I used a formula, based on his performance in the two seasons before and two seasons after, to estimate Griffin’s luck in 1986. The formula is unproven, and may be flawed for certain types of players — but you can also do it by eye.
Here’s Alfredo’s record for 1984-1988:
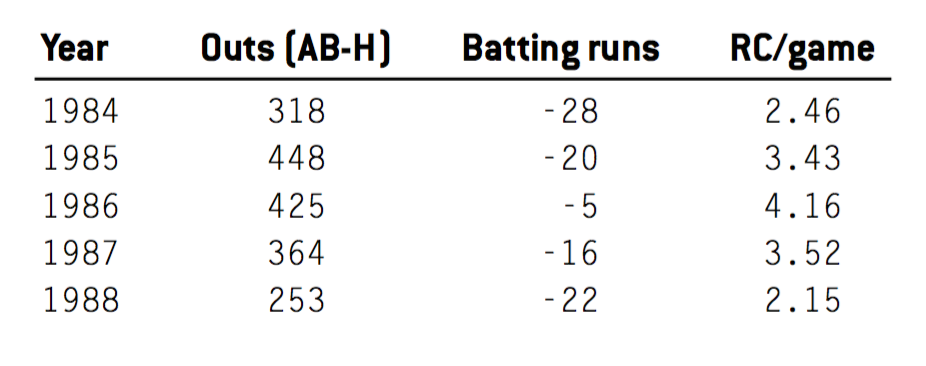
Leaving out 1986, Griffin seemed to average about –22 batting runs per season. In 1986, he was –5: a difference of 17 runs. The RC/G column gives similar results: Griffin seemed to average around three, except in 1986, when he was better by about one run per game. 425 batting outs is about 17 games’ worth (there are about 25.5 hitless at-bats per game), and 17 games at one run per game again gives us 17 runs.
The formula hits almost exactly, giving us 16.7 runs of “luck.” That’s coincidence, here, that the formula gives the same answer as the “eye” method — they’ll usually be close, but not necessarily identical.
Griffin is a bit of an obvious case, where the exceptional year sticks out. Most seasons aren’t like that, simply because most players usually do about what is expected of them. The formula will give a lot of players small luck numbers, like 6 runs, or –3, or such. Still, they add up. If a team’s 14 hitters each turn three outs into singles, just by chance, that’s about 28 runs — since it takes about 10 runs to equal one win, that’s 2.8 wins.
And, of course, the opposite of a career year is an off-year. Just as we measure that Alfredo was lucky in 1985, he was clearly unlucky in 1984, where his 2.46 figure was low even for him.
2. Its pitchers have career years, playing better than their talent can support.
What’s true of a hitter’s batting line is also true of the batting line of what the pitcher gives up. Just as a hitter might hit .280 instead of .250 just by luck, so might a pitcher give up a .280 average against him instead of .250, again just by luck.
Using Runs Created, we can compute how many runs per game the pitcher “should have” given up, based on the batting line of the hitters who faced him (this stat is called “Component ERA”). And, just as for batters, a career year (or off-year) for a pitcher will stick right out.
Here’s Bob Knepper, from 1980 to 1984:
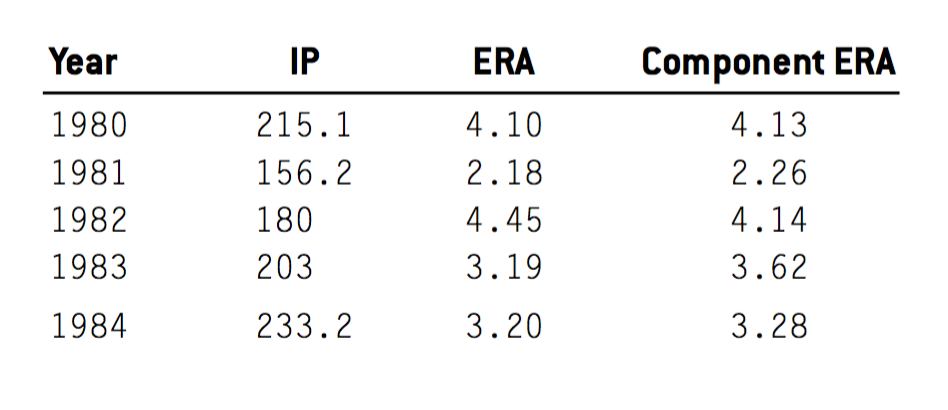
Leaving out 1981, Knepper seemed to average a CERA of about three-and-a-half. But in ‘82, he was at 4.14. That’s about .7 runs per game, multiplied by exactly 20 games (180 innings), for about 14 runs lost due to random chance.
The formula sees it about the same way, assigning Knepper 17 runs of bad luck.
A pitcher’s record necessarily includes that of his fielders — and so, whenever we talk about a pitcher’s career year, that career year really belongs to the pitcher and his defense, in some combination.
3. It was more successful at turning baserunners into runs.
The statistic “Runs Created,” invented by Bill James, estimates the number of runs a team will score based on its batting line. Runs Created is pretty accurate, generally within 25 runs a season of a team’s actual scoring. But it’s not exactly accurate, because it can’t be.
Run scoring depends not just on the batting line, but also on the timing of the events within it. If a team has seven hits in a game, it’ll probably score a run or two. But if the hits are scattered, it might get shut out. And if the hits all come in the same inning, it might score four or five runs.
The more a team’s hits and walks are bunched together, the more runs it will score. That’s the same thing as saying that the better the team hits with men on base, the more runs it will score. Which, again, is like saying the better the team hits in the clutch, the more runs it will score.
But several analyses, most recently a study by Tom Ruane of 40 years’ worth of play-by-play data, have shown that clutch hitting is generally random — that is, there is no innate “talent” for clutch hitting aside from ordinary hitting talent. So, for instance, a team that hits .260 is just as likely to hit .280 in the clutch as it is to hit .240 in the clutch.
And if that’s the case, then any discrepancy between Runs Created and actual runs is due to luck, not talent.
And so when the 2001 Anaheim Angels scored 691 runs, but the formula predicted they should score 746, we chalk the difference, 55 runs, up to just plain bad luck.
4. Its opposition was less successful in turning baserunners into runs
If clutch hitting is random, it’s random for a team’s opposition, too. So when the 1975 Big Red Machine held its opponents to 70 fewer runs than their Runs Created estimate says they should have scored, we attribute those 70 runs to random chance. The Reds’ pitchers were lucky, to the tune of seven wins.
5. It won more games than expected from its Runs Scored and Runs Allowed
The 1962 New York Mets achieved the worst record in modern baseball history, at 40–120. That season they scored only 617 runs and allowed 948 — both figures the worst in the league.
There’s another Bill James formula, the Pythagorean Projection, which estimates what a team’s winning percentage should have been based on their runs scored and runs allowed. By that formula, the Mets should have been 7.6 games better in the standings than they actually were — that is, they should have been 47–113.
Any difference between expected wins and actual wins has to do with the timing of runs — teams that score lots of runs in blowout games will win fewer games than expected, while teams that “save” their runs for closer games will win more than their projection. But studies have shown that run timing, like clutch hitting, is random. Teams don’t have a “talent” for saving their runs for close games, and therefore any difference from Pythagorean Projection is just luck.
So we judge that seven of the Mets’ 1962 losses were the result of bad luck, and that based on this finding, they weren’t quite as bad as we thought. Of course, 47–113 is still pretty dismal.
Putting It All Together
Earlier, we mentioned the 1993 Phillies. How lucky were they? Let’s take the five steps, one at a time:
1/2. Career Years or Off-Years
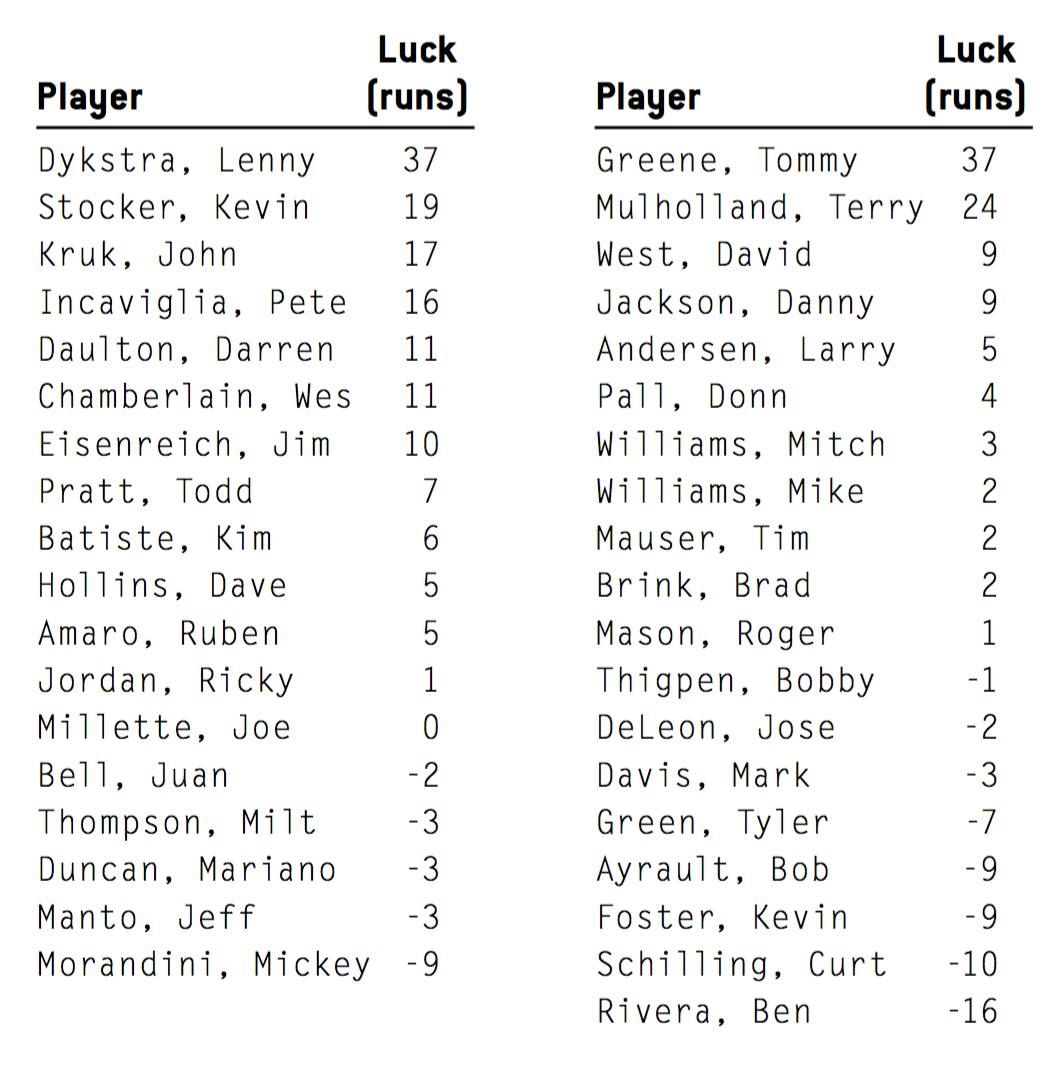
Everything came together in 1993, as individual Phillies hitters had career years, to the tune of a huge 131 runs.
Lenny Dykstra had a monster year, hitting 19 home runs (his previous high was 10) with a career-high .305 average. He was 37 runs better than expected. Rookie Kevin Stocker was lucky by 19 runs — he hit .324, but would never break .300 again. John Kruk and Pete Incaviglia were a combined 33 runs better than expected. Of the hitters, only Mickey Morandini, at –9, had an off-year of more than three runs.
The pitchers, for their part, were lucky by 39 runs, led by Tommy Greene, who had the best year of his career, 37 runs better than expected. Other than that, the staff performed pretty much as expected. A full list:
3. Runs Created by Batters
The Phillies scored 24 more runs than expected from their batting line.
4. Runs Created by Opposition
The Phillies’ opponents scored almost exactly the expected number of runs, exceeding their estimate by only one run.
5. Pythagorean Projection
Scoring 877 runs and allowing 740, the Phillies were Pythagorically unlucky. They should have won 3.1 more games than they did — at 10 runs per win, that’s about 31 runs worth. Adding it all up gives:
- Career years/off years by hitters: +131 runs
- Career years/off years by pitchers: +39 runs
- Runs Created by batters: +24 runs
- Runs Created by opposition: -1 run
- Pythagorean projection: -31 runs
- TOTAL: +162 runs (16 wins)
- Actual record: 97-65
- Projected record: 81-81
We conclude that the 1993 Phillies were a dead-even .500 team that just happened to get lucky enough that it won 97 games and the pennant.
This shouldn’t be that surprising. The Phils finished last in the division in 1992, and second-last in 1994, with mostly the same personnel. You can argue, if you like, that the players caught a temporary surge of talent in 1993, which they promptly lost after the season. But the conclusion that they had a lucky year makes a lot more sense.
The Best and Worst “Career Years”
Which players had the worst “off-years” between 1960 and 2001? Here’s the chart:
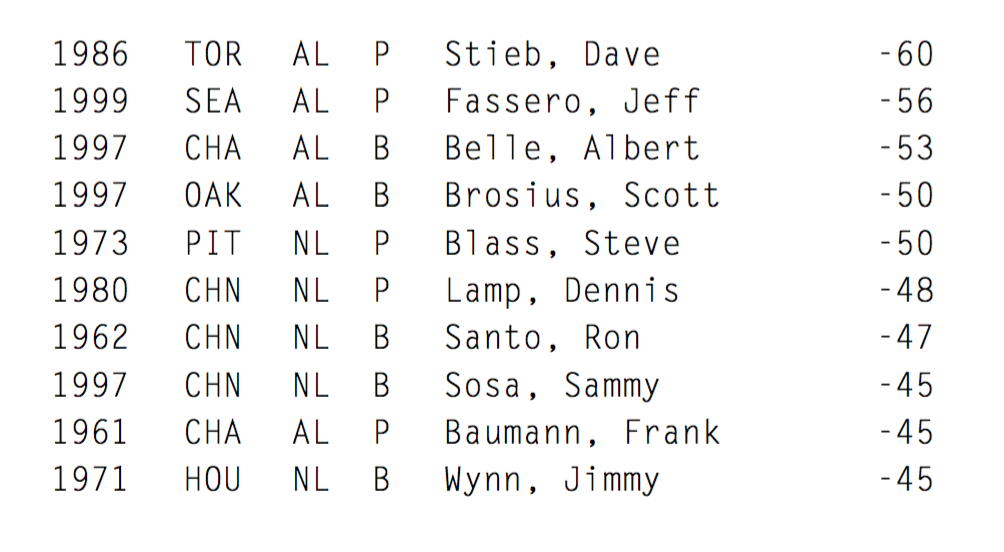
It’s an interesting chart, but also shows a limitation of the formula — it can’t distinguish between players who were lucky, and players who had a real reason for their performance problem.
Take Steve Blass, for example. His well-documented collapse in 1973 was not because he was just unlucky, but that he suddenly was unable to find the strike zone. While succumbing to “Steve Blass disease” is, I guess, a form of bad luck, it’s not really the kind of luck we’re investigating, which assumes that the player has his normal level of talent, but things just don’t go his way. If you’re doing an analysis of the 1973 Pirates, you might want to subtract out those 50 runs, based on the known understanding that they weren’t really bad luck.
Dave Stieb in 1986 — the worst “unlucky” season of the past 40 years — is another interesting case. Stieb was arguably the best pitcher in the AL in 1984 and 1985; he was legitimately bad in 1986, but went back to excellent in 1987 and 1988. What happened in 1986? Bill James suggested that Stieb had lost a little bit of his stuff, and was slow to accept his new limitations and pitch within them. I looked over a couple of game reports in the Toronto Star from that year, and the tone seemed to be puzzlement at Stieb’s bad year — there was no suggestion that Stieb was injured or such.
Here are the luckiest years:
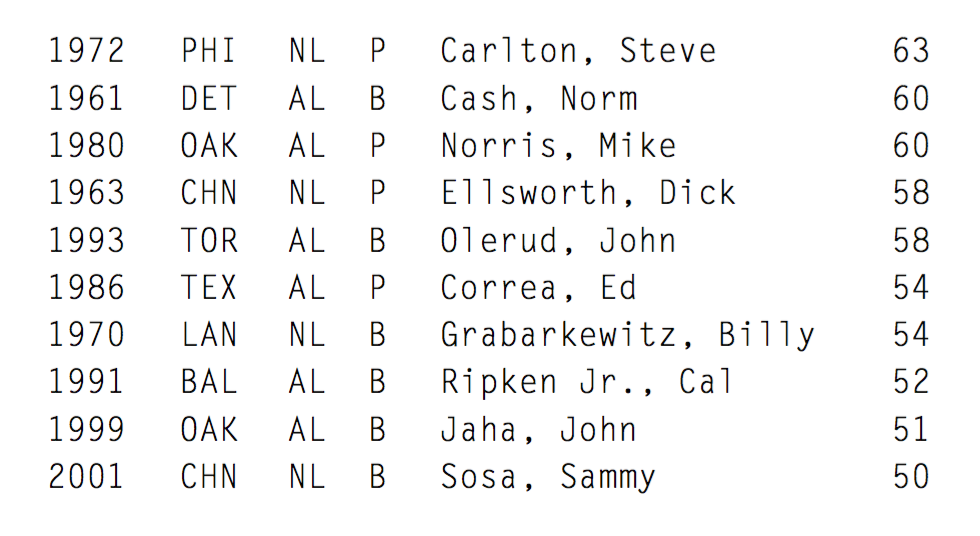
Steve Carlton’s awesome 1972 season, when he went 28-10 for a dismal .378 team, comes in as the luckiest of all time. Norm Cash is second, for his well-documented cork-aided out-of-nowhere 1961 (note that the system is unable to distinguish luck from cheating). And it’s interesting that Sammy Sosa appears on both lists.
You would expect that the luckiest season of all-time would be one like Cash’s, where an average player suddenly has one great year. But, instead, Carlton’s 1972 is a case where a great player has one of the greatest seasons ever. Of course, it’s a bit easier for a pitcher to come up with a big year than a hitter, because there’s a double effect — when his productivity goes up, his impact on the team is compounded because he gets more innings (even if only because he’s not removed in the third inning of a bad outing). On the other hand, a full-time hitter gets about the same amount of playing time whether he’s awesome or merely excellent.
Again, you can visit these cases to see if you can come up with explanations other than luck — Mike Norris, for instance, is widely considered to have been mortally overworked by Billy Martin in 1980, destroying his arm and, in that light, perhaps 60 runs is a bit of an overestimate.
Lucky and Unlucky Teams
The lists of players are interesting but probably not new knowledge — even without this method, we were probably aware that Norm Cash had a lucky season in 1961. On the other hand, which were the lucky and unlucky teams? I didn’t know before I did this study. Not only didn’t I know, but I didn’t even have a trace of an idea.
Table 7 shows the 15 unluckiest teams between 1960 and 2001. The unluckiest team over the last 40 years was the 1962 New York Mets – the team with the worst record ever. This is not a coincidence — the worse the team, the more likely it had bad luck, for obvious reasons.
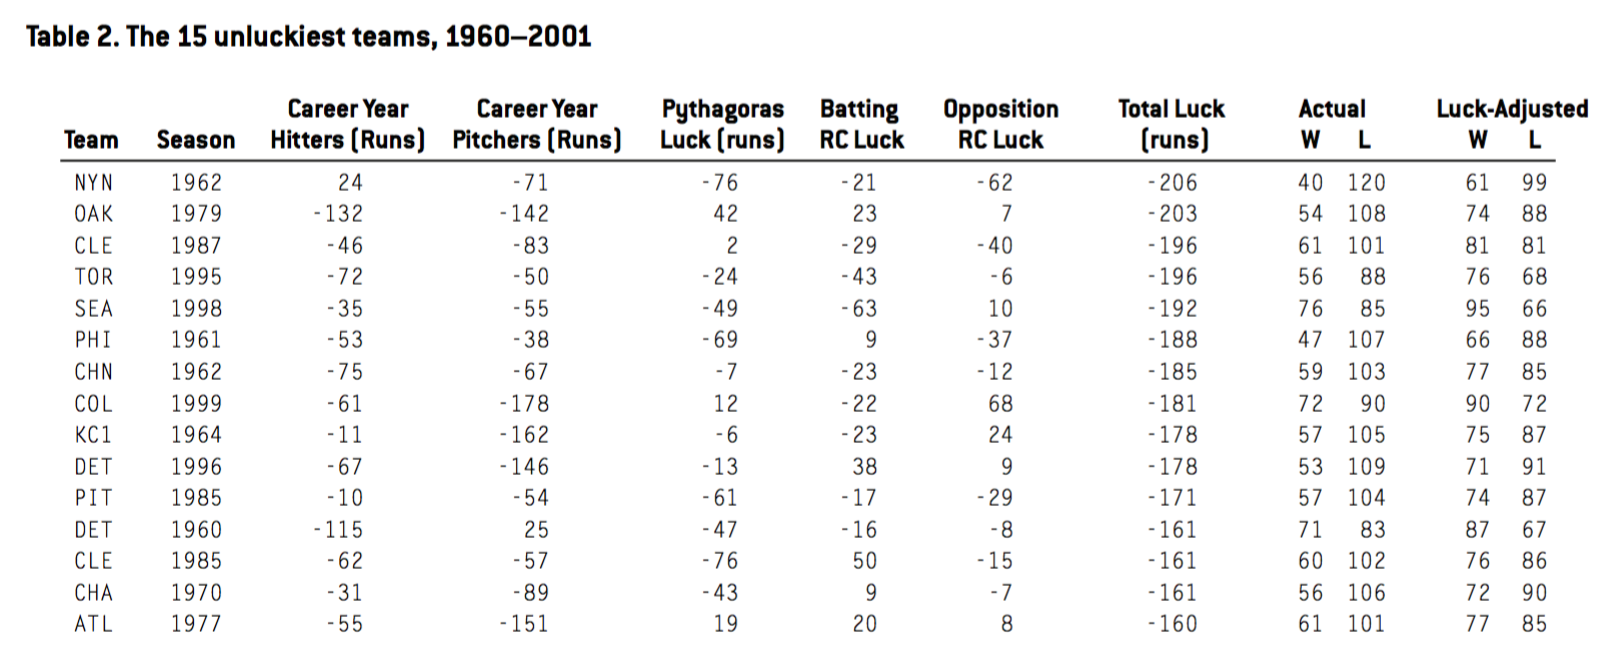
(Click image to enlarge)
Most of the Mets’ problems came from timing — poor hitting in the clutch, opponents’ good hitting in the clutch, and poor hitting in close games. That poor timing cost them about 15 wins. Bad years from their pitchers cost them another seven wins, which was partially compensated for by two wins worth of good years by their hitters.
On the other hand, the 1979 Oakland A’s had good timing — seven games of good luck worth. But their players had such bad off-years that it cost them 27 games in the win column. Of their 33 players, only five had career years of any size. The other 28 players underperformed, led by the 2–17 Matt Keough (43 runs of bad luck), off whom the opposition batted .315.
The 1995 Blue Jays were actually the unluckiest team by winning percentage — they were –196 runs in a shortened 144-game season. They wound up tied for the worst record in the league when in reality their talent was well above average.
But the 1998 Mariners could probably be considered the most disappointing of these 15 teams. Their talent shows as good enough to win 95 games, surely enough for the post-season — but they had 19 games worth of bad luck, and finished 76–85. It’s not on the chart, but the Mariners were unlucky again the next season, by 13 games this time — they should have been a 92-win wild-card contender in 1999, but again finished down the pack at 79–83.
The luckiest team (Table 8), by a runaway margin, was the 2001 Seattle Mariners, who won 116 games. And they did most of it through career years.
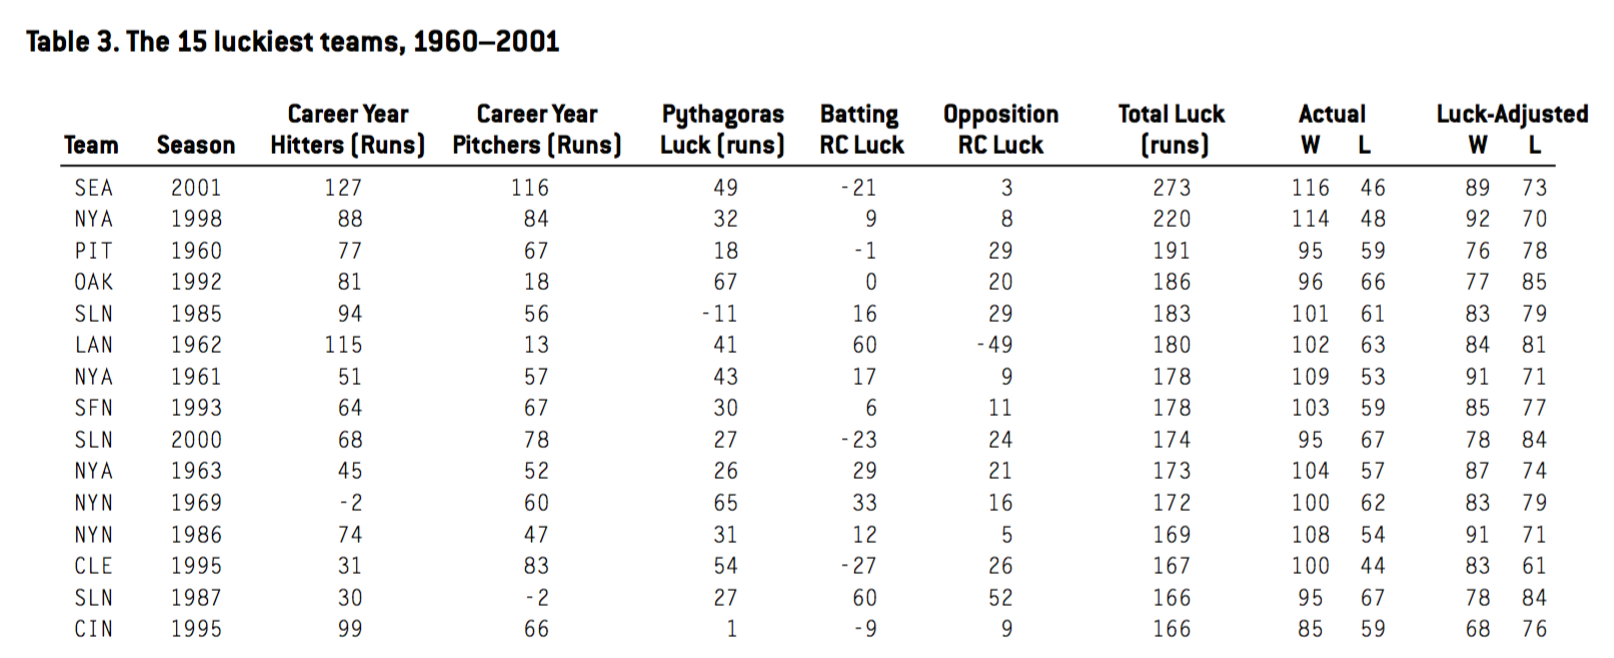
(Click image to enlarge)
Of the lucky runs, 127 came from the hitters (in this study, second only to the 1993 Phillies), and the pitchers contributed 116 of their own (fifth best). Thirteen separate players contributed at least one lucky win each — Bret Boone (40 runs), Freddy Garcia (38), and Mark McLemore (23) topped the list. Only one player was more than 10 runs unlucky (John Halama, at -11). Despite all the luck, the Mariners were still an excellent team — with average luck they would have still finished 89–73.
The 1998 Yankees are considered one of the best teams ever, and it’s perhaps surprising that they emerge as the second luckiest team. Like the 2001 Mariners, the ’98 Yankees got most of their luck from their players’ performances — about eight games each from their hitting and pitching. In talent, they were 92–70, which is still a very strong team. Indeed, of the 15 luckiest teams, the 1998 Yankees show as the best.
The Miracle Mets of 1969 were 17 games lucky — but this time most of their luck was timing luck — 10 wins in Runs Created, and about two wins in Pythagoras. Still, they were a respectable 83– 79 team in talent.
The worst of these lucky teams was the 1960 Pirates. Bill Mazeroski’s famous Game Seven home run brought the World Series championship to a team that, by this analysis, was worse than average, at 76–78. The 97–57 Yankees, whom they beat, had been eight games lucky themselves, but were still the most talented team in the majors that year, at 89–65.
The Best Teams Ever
Which teams were legitimately the best, even after luck is stripped out of their record? Perhaps not surprisingly, the list is dominated by the “dynasty” teams:
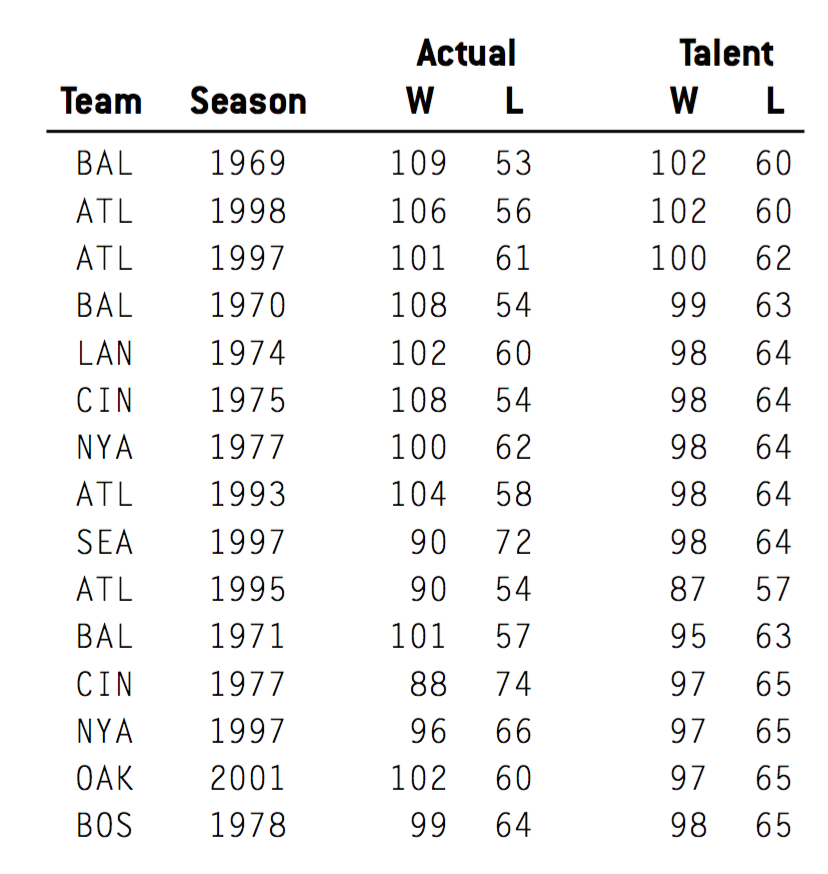
The 1969, ’70, and ’71 Orioles all appear in the top 15, as do four Braves teams from the ‘90s. The ill-fated victims-of-Bucky-Dent 1978 Red Sox come in at number 15. (The list may not appear to be in the correct order because of rounding — but it is.)
The 1975 Reds made the list, but the 1976 Reds don’t (they came in at number 42). Interestingly, the unheralded 1977 Reds, whose nine games of bad luck dropped them to 88–74, appear at number 12. The 1978 Reds, with a projected talent of 96–65, were 21st. This suggests that the Big Red Machine stayed Big and Red longer than we think, but bad luck made it look like the talent had dissipated.
I’ve never heard the 1974 Dodgers described as among the best of all time, but they’re fifth on the list. It was Steve Garvey’s first full season, and the Dodgers had a solid infield and legitimately strong pitching staff.
Arguably the biggest surprise on this list isn’t the presence or absence of any particular team, but that only three teams over the last 40 years were talented enough to win 100 games. This is legitimate — if there were lots of 100-game teams, we’d see a substantial number getting moderately lucky and winning 106 games or more. Also, it’s consistent with a different study I did back in 1988, which found that, theoretically, a team that wins 109 games is, on average, only a 98-game talent. But there is no assurance that this is correct — it’s possible that my algorithm for “career years” overestimates the amount of luck and underestimates the amount of talent.
Here are the worst teams ever:
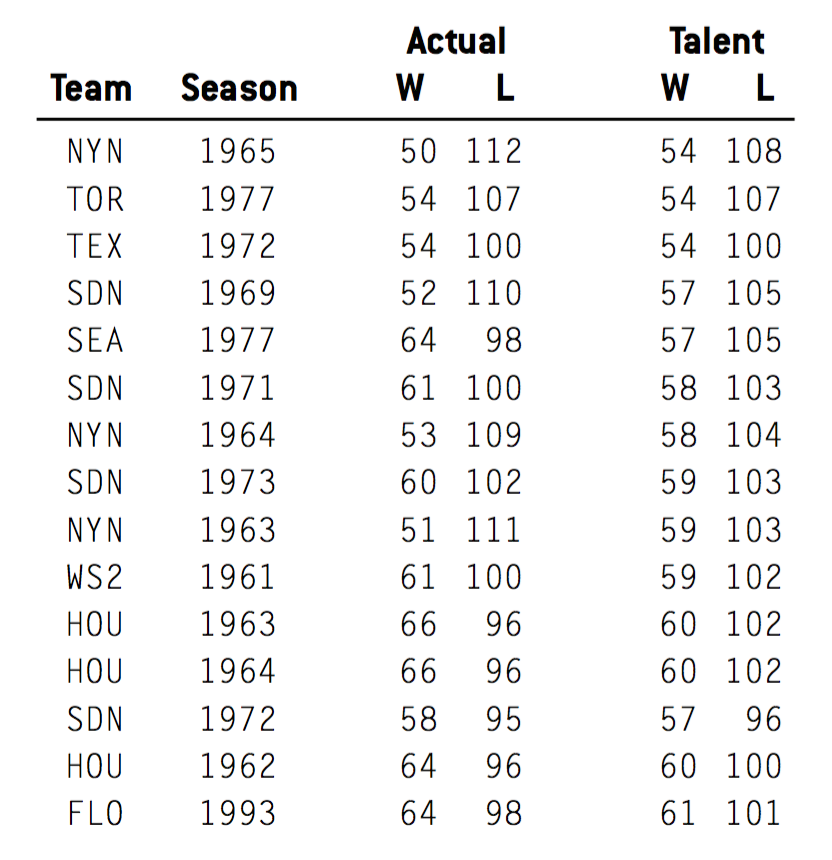
With expansion, it’s a lot easier to create a team that loses 100 games than a team that wins 100 games. The 100-game loser list is 23 teams long.
Interesting here is the repeated presence of the expansion San Diego Padres, with four teams in the top 15 abysmal list. It’s actually worse than that — the 1970 team finished 19th, and the 1974 Padres were 29th. For six consecutive years San Diego fielded a team in the bottom 30. That they have not been recognized as that futile a team probably stems from the fact that, unlike the expansion Mets, they never had enough bad luck to give them a string of historically horrific records. From 1970 to 1973, their luck was positive each year.
Missing from this list are the 1962 Mets — as we saw, they really should have been 61–99, for 19th worst ever.
The bottom 14 teams are all from the ‘60s and ‘70s, suggesting — or confirming — that competitive balance has improved in recent decades.
How often does the best team win?
In 1989, a Bill James study found that because of luck, a six- or seven-team division will theoretically be won by the best team only about 55% of the time.
I checked the actual “luck” numbers for all 96 division races from 1969 to 1993 (excluding 1981), and found that 59% (57 of 96) were won by the most talented team — very close to Bill’s figure.
Of the 39 pennant races that went to the “wrong” team, the most lopsided was the 1987 National League East. The Cardinals finished first by three games — but were a 78-game talent, fully 16 games worse than the second-place Mets.
Also of note: the 1989 Mets should have finished 15 games ahead of the Cubs instead of six back. The 1992 White Sox should have won the division, beating the A’s by 14 games, instead of finishing third. And the hard-luck Expos were the most talented team in the NL East in 1979, 1980, 1981, 1982, and 1984. They made the postseason only in 1981. In 1982, they were good enough to have finished first by 11 games.
In his 1989 article Bill James speculated that a sub-.500 team could conceivably win the World Series, though it was unlikely. He wrote, “Did we see it in ’88?” For the record, the 1988 Dodgers come out as an 82–80 team — close but not quite. The ’82 Cardinals came the closest in the four-division era — they won the Series with 81.2-game talent.
But the 1960 Pirates fit the bill. Without luck, they were 76–78. Nineteen games of good fortune pushed them to 95–59, the World Series, and set the stage for Bill Mazeroski’s heroics. Table 11 shows every World Series team from 1960 to 2001.
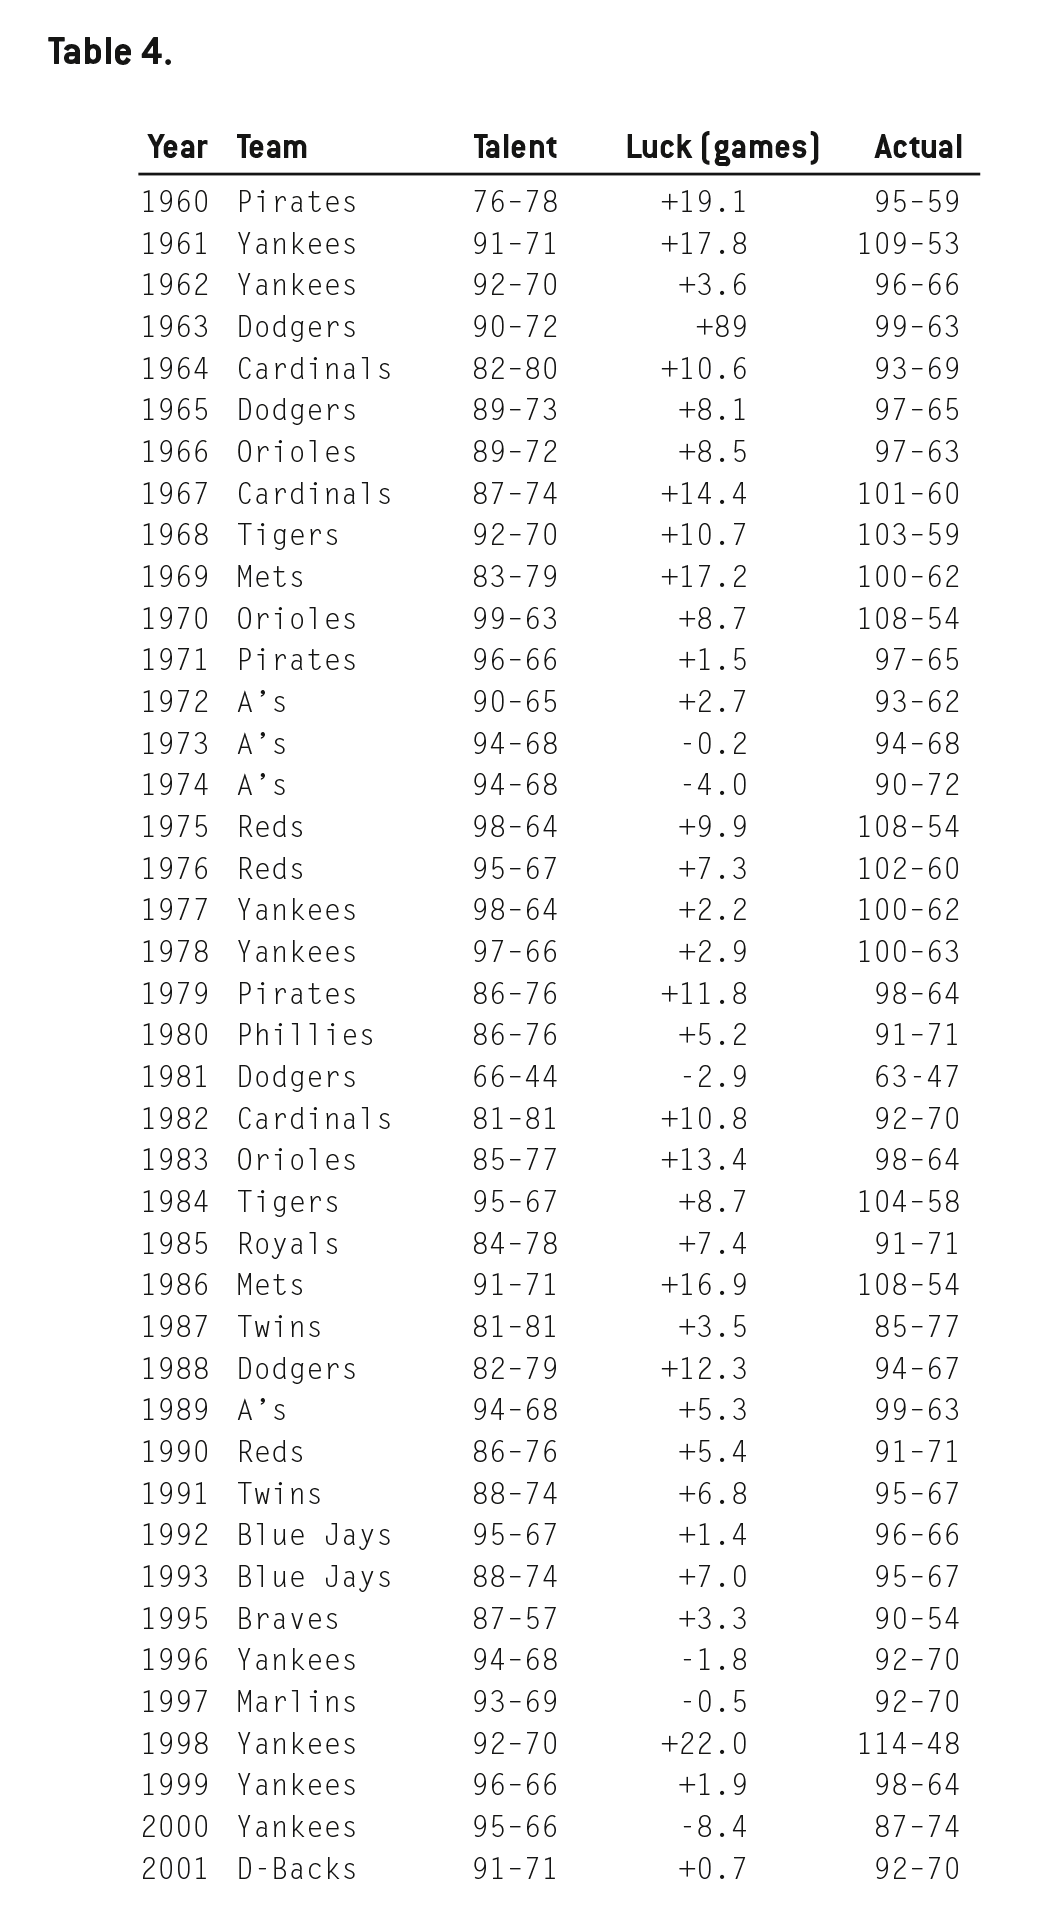
Table 11 makes it evident that, to win the World Series, it’s not enough to be a good team — you have to be lucky, too. Of the 41 champions, 35 of them had a lucky regular season. Of the six unlucky teams, only the 1974 A’s and the 2000 Yankees were unlucky by more than three games.
Before 1969, all the winning teams were lucky, some substantially. Between 1969 and 1993, in the four-division era, luck was a little less important. Since 1995, the champions were, on the whole, only marginally lucky (with the exception of 1998).
This makes sense — back in the one-division league, one lucky team could blow away nine others. Now that team eliminates only three or four others, and even then, those other teams have a shot at the wild card. And the lucky team now has to win three series against superior opponents, instead of just one, which increases the chance that a legitimately good team, instead of just a lucky one, will now come out on top.
From 1995 to 2001, every champion was at least a 90-game talent (adjusting 1995 for the short schedule). Before the wild card, champions with talent in the 80s were very common.
(Click image to enlarge)
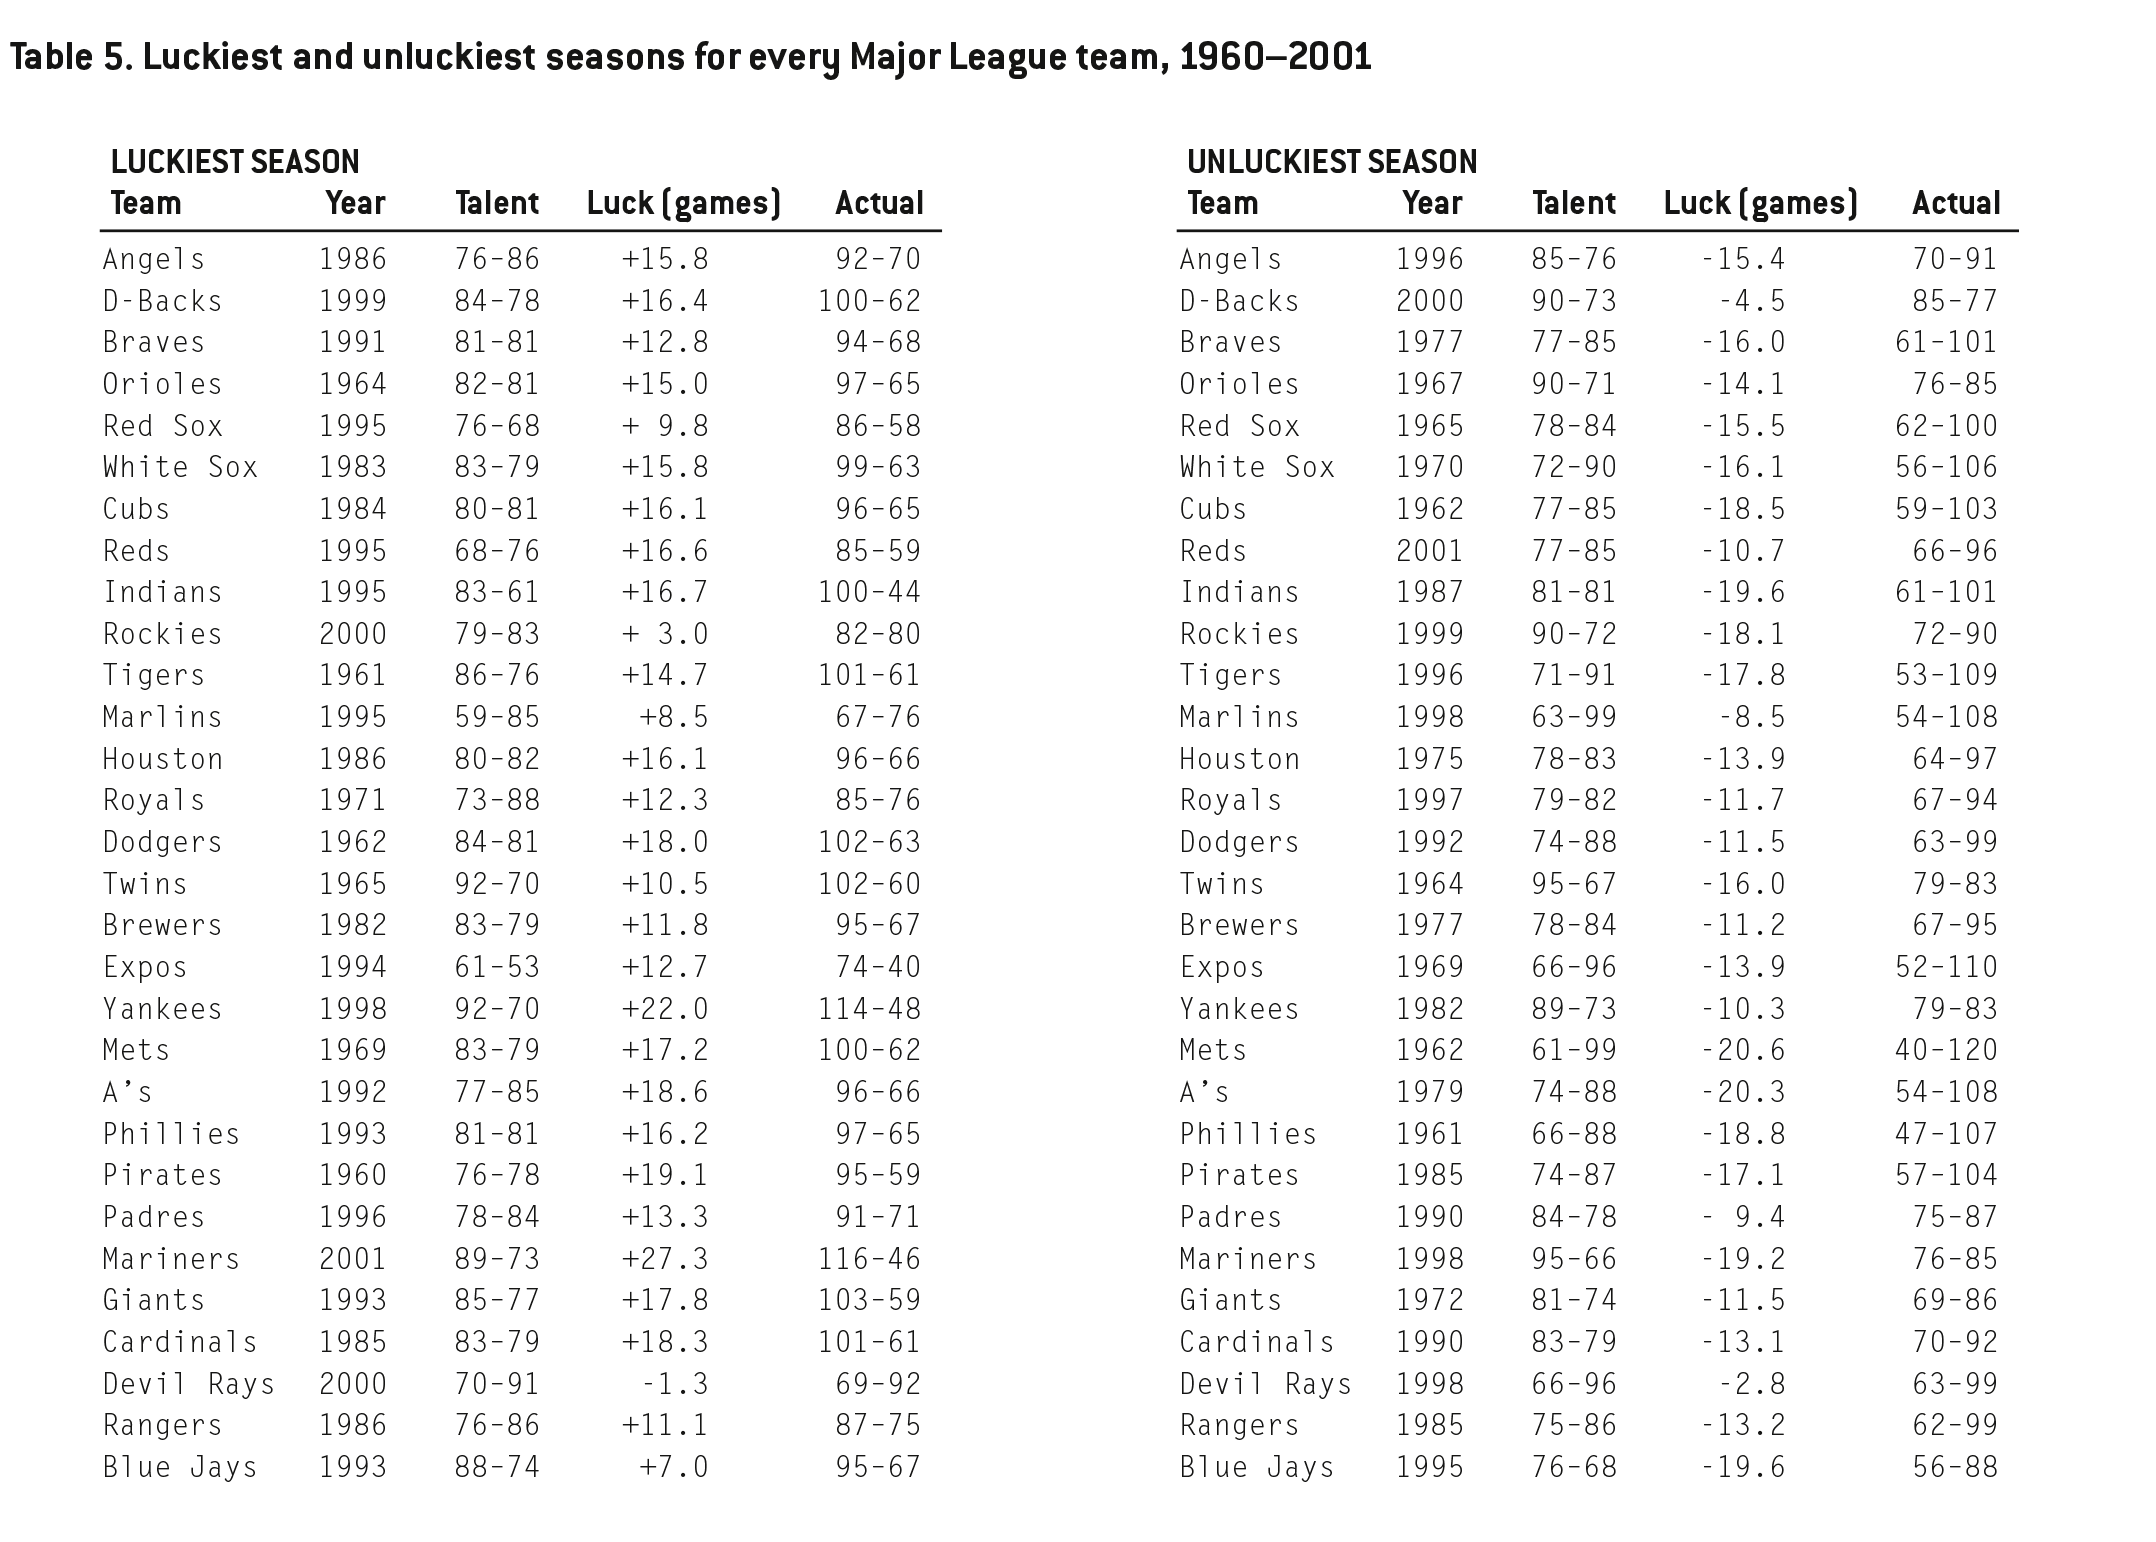
Table 12 lists the luckiest and unluckiest seasons for every major-league team from 1960 to 2001. The Blue Jays and the Red Sox have had good success over the years, but never had a huge season where they won 108 games or something and ran away with the division. That seems to be because they never had the kind of awesome luck you need to have that kind of record. The Jays were never more than 7 games lucky, and Boston never more than 9.8.
For the flip side, look at the San Diego Padres — they were never unlucky by more than 9.4 games. As we noted earlier, that perhaps spared them the reputation as one of the worst expansion teams ever — with a bit of bad fortune, their record could have rivaled the Mets for futility.
And the negative sign in Tampa Bay’s “best luck” column is not a misprint — in the first four years of their existence, they were unlucky all four years.
Finally, take a look at the Twins. Their luckiest season immediately followed their unluckiest. As a result, they went from below .500 in 1964 to 102 wins in 1965 — even though they actually became a worse team!
Summary
What can we conclude from all this? First, luck is clearly a crucial contributor to a team’s record. With a standard deviation of six or seven games, a team’s position in a pennant race is hugely affected by chance — seven wins is easily the difference between a wild-card contender and an also-ran.
Second, you have to be lucky to win a championship. As we saw, 85% of world champions had lucky regular seasons.
Third, teams with superb records are likely to have been lucky. Very few teams are truly talented enough to expect to win 100 games. The odds are very low that the 2005 White Sox (99–63) and Cardinals (100–62) are really as good as their record. Despite all this, it should be said that while luck is important, talent is still more important. The SD due to luck was 7.2, but the SD due to talent was 8.5. It’s perhaps a comfort to realize that talent is still more important than luck — if only barely.
PHIL BIRNBAUM is editor of By The Numbers, SABR’s Statistical Analysis newsletter. A native of Toronto, he now lives in Ottawa, where he works as a software developer.
The Algorithm
This is the algorithm to calculate a player’s career-year or off-year luck for a given season. The procedure is arbitrary. I used it because it seems to work reasonably well, but it no doubt can be improved, probably substantially. But, hopefully, any reasonable alternative algorithm should give similar results in most cases.
Of course, any algorithm should sum to roughly zero, since over an entire population of players the luck should even out.
Batters
A batter’s luck is calculated in “runs created per 27 outs” (RC/27). To calculate a batter’s luck for year X:
- Take the player’s average RC27 over six years: two years ago counted once, last year counted twice, next year counted twice, and two years from now counted once. Weight the average by “outs made” (hitless AB + CS + GIDP) so that seasons in which a batter had more playing time will have a higher weight. Adjust each RC27 for league and park.
- Add a certain number of “outs made” at the league average RC27:
– if the player had more than 2,100 outs made in the six seasons, add 100 league-average outs made;
– if the player had fewer than 1,200 outs made in the six seasons, add 900 league-average outs made; and
– if the player had between 1,200 and 2,100 outs made, subtract that from 2,100 and add that number of league-average outs made.The purpose of this step is to regress the player to the mean. Just as a player who goes 2-for-4 in a game probably isn’t a .500 hitter, a player who hits .300 in 1,200 outs made is probably less than a .300 hitter. This adjusts for that fact.
- If the player had less than 1,600 outs made over the six seasons (not including those added in step 2), subtract 0.0006 for each out made under 1,600. In addition, if the player had less than 800 outs made over the six seasons, subtract another .0006 for each out made under 800.
The purpose of this step is to recognize that players with fewer plate appearances are probably less effective players.
- Add .09 if the player had more than 1,600 outs made (not including those added in step 2).
- This gives you the player’s projected performance, expressed in RC27. To figure the luck, subtract it from the actual RC27, multiply by outs made, and divide by 27. So if a player projects to 4.5, his actual was 5.5, and he did all that in 270 outs that year, then (1) he was lucky by 1.0 runs per game; (2) he was responsible for 10 games (270 outs divided by 27); so (3) he was “lucky” by 10 runs.
Pitchers
A pitcher’s luck is calculated in “component ERA” (CERA), which is the number of runs per game the opposition should score based on its batting line against him. To calculate a pitcher’s luck:
- Take the player’s average CERA over six years: two years ago, last year counted twice, next year counted twice, and two years from now counted once. Weight the average by “outs made” (IP divided by three) so that seasons in which a pitcher had more playing time will have a higher weight. Adjust each CERA for league and park.
- Add a certain number of “outs made” at the league average CERA:
– if the player had more than 900 outs made in the six seasons, add 900 league-average outs made;
– if the player had fewer than 400 outs made in the six seasons, add 400 league-average outs made; and
– if the player had between 400 and 900 outs made, add that number of league-average outs made. - Temporarily add this year’s outs made to the total of the six seasons (not including those added in step 2). If that total is less than 1,200, add 0.0006 for each out made under 1,200.
- Add .35.
- If the player started more than 70% of his appearances, add .1.
- If the player had more than 300 outs made this year, but less than 300 outs made total in the six seasons from step 1, ignore the results of the previous five steps, and use the league/park average CERA instead. (That is, assume he’s an average pitcher.)
- This gives you the player’s projected performance, expressed in CERA. To figure the luck, subtract the actual CERA, multiply by outs made, and divide by 27. So if a player projects to 3.50, his actual was 4.50, and he did all that in 270 outs that year, then (1) he was unlucky by 1.0 runs per game; (2) he was responsible for 10 games (270 outs divided by 27); so (3) he was “unlucky” by 10 runs.