Which of the 14 Expansion Franchises Yielded the Most Successful Draft?
This article was written by Maxwell Kates
This article was published in Time For Expansion Baseball (2018)
 Pat Gillick once observed that it should take 10 years for an expansion team to emerge into a contender.1 The Hall of Fame executive would know; he oversaw the burgeoning of two of the 14 expansion teams. On one hand, his Astros were still a few years away from contending when he left Houston for the New York Yankees in 1973. On the other, after joining the Toronto Blue Jays on the ground floor in 1976, he watched their first pennant race in Year 7, winning the American League East two years later.
Each of the 14 expansion teams channeled their inner Pygmalion at different waves and speeds. In hockey, yes, it is possible to clinch a Stanley Cup berth in a team’s first season, as evidenced by the St. Louis Blues and the Vegas Golden Knights. In baseball, however, the odds are stacked against the expansion teams. All 14 emerged from humble beginnings and rose to contend in their respective league or division, before retreating yet again to mediocrity. This essay will address the question of which expansion draft yielded the most successful team in its first decade of play. To illustrate the premise, the following three statistical metrics shall be used:
How well did the teams perform on the field in their first 10 years? This question will be answered by analyzing the different won-lost records and winning percentages.
For how long did the players selected in the expansion drafts contribute effectively to their teams? This question will be answered by examining the length of time expansion players remained on their teams as active players.
Within the realm of expansion players, it is important to note “drafted players” and “regeneration players.” Drafted players were, quite simply, the players selected in each expansion draft. Regeneration players were the players received in trades for the drafted players. Both drafted and regeneration players are taken into account for the longevity analysis.
For example, the Montreal Expos selected Jesus Alou, Jack Billingham, and Skip Guinn in the 1968 expansion draft. Before the 1969 season, all three were traded to the Houston Astros for Rusty Staub. Three years later, in 1972, Staub was traded to the New York Mets for Tim Foli, Mike Jorgensen, and Ken Singleton. Alou, Billingham, and Guinn were “drafted” players. Staub was a “regeneration” player and so were the three Mets.
Of course, this part of the analysis assumes that a player on the roster after 10 years continues to display significant positive value. There is the argument that remaining on his team for 10 years may prove that he was not of significant enough value to be traded. The value of the drafted and regeneration players will be addressed by analyzing the statistical output of the players using wins above replacement (WAR).
It is the author’s hypothesis that, given their relatively quick rise to contend and the length of time that they remained competitive, the Kansas City Royals shall score most points for their expansion draft, with the Toronto Blue Jays finishing second.
PART I: WON-LOST ANALYSIS
One of the objectives used to analyze the success of each expansion draft was the won-lost records for the first 10 years of each franchise. Both the American and National Leagues adopted 162-game seasons prior to their first expansion drafts and the length of their seasons has not changed. Therefore, it should have been easy to assign point values for won-lost records. But what about strike seasons? Due to labor stoppages, complete seasons were not played in 1972, 1981, 1985, 1994, or 1995. What is the most accurate method to account for won-lost records in the incomplete seasons? The solution was to assign points based on winning percentages rather than wins whether the season was played to completion or not:
- .500 record: 1 point per season
- .550 record: 2 points per season
- .600 record: 3 points per season
The big winner here was the Arizona Diamondbacks with 12. Posting a record of 100-62 in 1999, only their second season, the Snakes capitalized on their success by defeating the Yankees in the World Series two years later. However, most of the key players on the 2001 Diamondbacks, including Randy Johnson, Mark Grace, and Steve Finley, were free agents, posing zero correlation with the expansion draft held four years earlier. The Kansas City Royals finished a close second with 11 points. The Royals, in an era that predated free agency, first broke the .500 barrier in 1971 in only their third season. From 1972 to 1978, the Royals posted only two losing seasons.
At the other end of the spectrum, three teams scored no points. The Seattle Mariners did not post a winning season until 1991, their 15th year of existence, nor did the Montreal Expos until 1979, their 11th. As for the Tampa Bay Devil Rays, they perpetuated their role as the doormat of the American League East for their entire first decade, failing to register even a .440 winning percentage.

PART II: EXPANSION PLAYERS
As defined earlier in this essay, expansion players consist of the following two components:
- Drafted Players: Players selected in the expansion draft
- Regeneration Players: Players received in trades for players selected in the expansion draft
Points were awarded to expansion players on the basis of five-year increments. If a drafted or regeneration player remains on his team’s roster five years into the franchise history, he is awarded two points. Any player drafted or generated by the expansion draft who remained on the roster after 10 years is awarded five points.
Leading the way here were the Kansas City Royals with 53 points. The expansion draft generated trades for Hal McRae, Amos Otis, Fred Patek, Marty Pattin, and Kansas City native Steve Mingori. All remained active and productive on the Royals’ roster in 1978 as they won their third consecutive American League West title. The Toronto Blue Jays were not far behind with 50 points. Expansion draft picks Jim Clancy, Ernie Whitt, and Garth Iorg all contributed to the Blue Jays’ in their “Drive of ‘85,” as did regeneration players Damaso Garcia and Rance Mulliniks.
On the other end of the scale, the Tampa Bay Devil Rays and Arizona Diamondbacks registered only 10 and 15 points, respectively. Only one expansion player, Brandon Lyon, remained in an Arizona uniform 10 years after the Diamondbacks joined the major leagues. No Devil Rays player can make the same claim.
PART III: INDIVIDUAL STATISTICS
The third and perhaps most crucial metric to understand the effectiveness of the 14 expansion drafts is to analyze the statistical output of the players. Several problems arose with this particular analysis. Which statistics should be analyzed and how best to weight these statistics? Are runs batted in more important than home runs? Since most expansion teams posted poor aggregate records, would won-lost be of any significance at all? And how do you compare players across eras? In the 1960s, the mound was higher, fences were wider, and the ball did not travel as far. Every team played on natural grass surfaces during the first round of expansion. By 1977, when the Mariners and the Blue Jays were admitted into the American League, 10 of the 26 teams played on artificial turf.
To solve the problem, the home run, runs batted in, won-lost, and earned-run average were all shelved in favor of one all-encompassing statistic: wins above replacement (WAR). Unveiled by Bill James at the SABR convention in Milwaukee on July 13, 2001, WAR is defined as “the number of wins [a player is] responsible for beyond the replacement level at the player’s position.”2 In other words, WAR is a statistical measure used to analyze the number of additional wins a player’s presence is expected to contribute over that of a player of average capabilities. WAR encompasses pitching, fielding, and baserunning statistics as well as batting.
For the purpose of writing this essay, WAR is the simplest and most direct way to assess the collective output of the expansion players. This essay will adopt the Baseball Reference calculation of WAR. If a player’s WAR is valued at 1, that is equal to one point in the expansion players’ analysis. Suppose players selected in an expansion draft and others generated in trades for those players yielded 17 wins above replacement after subtracting negative from positive scores. That would be equal to 17 points in this analysis.
Among first year teams, the 1969 Kansas City Royals scored the highest WAR with 26.6. At the other end of the scale, the 1993 Colorado Rockies as a team score a WAR of only 6.1. The Royals continued to lead their expansion brethren with an aggregate WAR of 184.8 in their first decade of American League baseball. Hal McRae (15.7), Amos Otis (37.2), Fred Patek (21.5) and Al Fitzmorris (15.5) all contributed to the Royals and their strong finish between 1969 and 1978.
The Seattle Pilots-Milwaukee Brewers franchise also generated a high WAR of 151.1. Most of the output was the work of regeneration players. As general manager of the Brewers from 1970 to 1972, Frank Lane traded most of the roster he inherited. In return, Lane received players like Don Money (23.9 WAR with the Brewers through 1978) and Johnny Briggs (14.4) from the Phillies, George “Boomer” Scott (22.6) from the Red Sox, and Jim Colborn (12.5) from the Cubs. The Tampa Bay Devil Rays, meanwhile, posted an aggregate WAR of only 36.9 among their expansion players. The New York Mets were not much better with 41.8.
THE ENVELOPE, PLEASE …
Now for the results of the expansion draft analysis:
14. Tampa Bay Devil Rays, 1998 to 2007, 47 pts
Not surprisingly, the Tampa Bay Devil Rays generated the lowest overall score. During their first decade in the major leagues, the Rays finished in last place every year, winning as many as 70 games only once, in 2004. Five expansion players remained on their roster in 2003, combining for a WAR of -0.1. One positive spin about the draft is that at least it yielded one good season from each of Miguel Cairo (3.2 WAR), Quinton McCracken (2.1), and Tony Saunders (3.1) in 1998.
Aggregate WAR: 36.9
13. New York Mets, 1962 to 1971, 66 pts
A great miracle happened at Flushing Meadows when, in 1969, the New York Mets won the World Series in only their eighth season. However, most of the team’s success in 1969 was attributed to the farm system and scouting department rather than the expansion draft. Only four players (Tommie Agee, Don Cardwell, J.C. Martin, Al Weis) were generated by trades from the expansion draft. Of the four, only Agee’s WAR (5.2) was of any significance. In the seven intermediate seasons, the Mets averaged only 56 wins while producing a total WAR of 27.5 from its expansion players
Aggregate WAR: 41.8
12. Seattle Mariners, 1977 to 1986, 115 pts
Like the Devil Rays, the Mariners did not post one winning season among their first 10 in the American League. Their record was slightly better than Tampa Bay’s; they finished in last place five times as opposed to 10. The Mariners did generate quality players, both through the expansion draft and through trades. The problem that the Mariners encountered under the ownership of Lester Smith and Danny Kaye, and, later, George Argyros, is that they could scarcely afford to keep players like Ruppert Jones, Rick Honeycutt, Floyd Bannister, and Richie Zisk. Only in 1987 did the luck of the Mariners’ trident begin to point upward when they selected Ken Griffey Jr. as the first overall pick in the June amateur draft.
Aggregate WAR: 87.6
11. Arizona Diamondbacks, 1998 to 2007, 116 pts
The Diamondbacks rose meteorically to win 100 games in 1999, 92 games and the World Series in 2001, and 98 games in 2002. As was discussed earlier, the rapid ascent of the Diamondbacks is attributed more to their free-agent signings than the players they selected in the expansion draft. It should be emphasized that two key players in their playoff run, Luis Gonzalez (30.2 WAR) and Curt Schilling (25.9 WAR), were acquired in trades generated by the expansion draft. The Diamondbacks’ reign atop the National League West was short, as the team plummeted to a record of 51-111 in 2004.
Aggregate WAR: 89.4
10. Houston Colt .45s-Astros, 1962 to 1971, 120 pts
In their first decade in the National League, the Houston franchise reached the break-even level only once, and that was exactly .500 (81-81) in 1969. The Colt .45s reaped immediate benefits from drafting pitchers Dick Farrell (16.7) and Bob Bruce (11.1). In addition, the draft generated a 1965 trade to the St. Louis Cardinals for Mike Cuellar (13.4). After yielding an aggregate WAR of 23.0 in 1962, expansion players yielded 16.2 wins above replacement to the Colt .45s in 1963 and 16.3 in 1964. Their contributions to the Astros after moving to the Astrodome were modest.
Aggregate WAR: 71.5
9. Colorado Rockies, 1993 to 2002, 126 points
The Rockies and their expansion players struggled in their first two seasons, posting a WAR of 6.1 in 1993 and 6.9 in 1994. Then in 1995, after moving from Mile High Stadium to Coors Field, the Rockies won a wild-card title with a record of 77-67. Two of the most prominent “Blake Street Bombers,” Larry Walker and Ellis Burks, were free-agent signings. However, unlike the Arizona Diamondbacks, the Rockies’ expansion players did contribute to their quick ascent. Dante Bichette, Vinny Castilla, Darren Holmes, Curtis Leskanic, Steve Reed, Kevin Ritz, and Eric Young Jr. were responsible for 21.2 wins above replacement for the 1995 Rockies. However, the early success of the Rockies was short-lived: Colorado contended again in 1996 and 1997 before retreating to mediocrity.
Aggregate WAR: 87.5
8. Montreal Expos, 1969 to 1984, 127 pts
The Expos were the third team who failed to reach the .500 barrier in its first decade in the major leagues, contending only in 1979 with a record of 95-65. Entering the National League with a record of 52-110 in 1969, the Expos fielded an above-average representation of quality players acquired through the expansion draft and trades. Players like Rusty Staub, Bill Stoneman, Ron Hunt, and Ron Fairly led the Expos to win an improbable “70 in ‘70” before appearing on the verge of contending as early as 1973. A global energy crisis, compounded by political uncertainty in Quebec, prompted the Expos to implement “Phase Two” in 1974. The most harmful trade in this austerity program sent Ken Singleton and Mike Torrez to the Baltimore Orioles for Rich Coggins and Dave McNally. Singleton and Torrez contributed a combined WAR of 48.3 before both players retired in 1984. Coggins and McNally, meanwhile, combined for a WAR of -1.0. Of the four teams celebrating their 10th anniversary in 1978, the Expos were the only one to post a losing record.
Aggregate WAR: 96.7
7. San Diego Padres, 1969 to 1978, 128 pts
Like their expansion brethren in Montreal, the Padres posted a record of 52-110 in 1969. The Padres, however, could not escape the basement of the National League West for another six years. Most of the players drafted by the Padres were prospects and therefore, remained on the roster longer than usual for an expansion team. The prize of the expansion draft was Nate Colbert, who was responsible for 17.2 wins above replacement in six years with San Diego. Although the Padres breached the .500 barrier in 1978 with a record of 84-78, their success was short-lived; they returned to last place in 1980.
Aggregate WAR: 89.1
6. Florida Marlins, 1993 to 2002, 137 pts
The Florida Marlins posted only one winning season in their first 10 years, a 92-70 record in 1997 on their way to winning the World Series. Many of the expansion players had already been replaced on the roster by free agents. However, the 1997 Marlins still included Jeff Conine (11.1 WAR), who was selected in the expansion draft, along with Gary Sheffield (13.0 WAR, who was acquired in a 1993 trade for Trevor Hoffman. Sheffield was traded to the Los Angeles Dodgers in 1998 for Mike Piazza, a Wayne Huizenga “blockbuster” that generated deals for Preston Wilson and Mike Lowell. Sheffield notwithstanding, expansion players were generally unaffected by the scorched-earth policy that dismantled the Marlins after the 1997 World Series. The 1998 Marlins plummeted in the standings to finish 54-108 and would not contend again until 2003, when they won another World Series.
Aggregate WAR: 87.8
5. LA-California Angels, 1961 to 1970, 152 pts
As one of the two initial expansion teams, the Los Angeles Angels were not even expected to win 50 games in 1961. Instead they won 70, setting a record among first-year expansion teams that still stands. A year later, they breached the .500 barrier with a record of 86-76. The Angels were inconsistent in their first decade, posting four winning records but never two consecutively. What helped the Angels in this analysis were the wins above replacement contributed by two players. Jim Fregosi, selected in the expansion draft from Boston, provided a WAR of 45.2 between 1961 and 1970. Meanwhile, an expansion-day trade landed Dean Chance from the Washington Senators. In six seasons with the Halos, Chance posted a WAR of 20.5. The selection of Fregosi continued to pay dividends for the Angels in the 1970s. A 1971 trade sending him to the New York Mets brought Nolan Ryan to Orange County for eight seasons, from 1972 to 1979.
Aggregate WAR: 129.3
4. Toronto Blue Jays, 1977 to 1986, 167 pts
The Blue Jays started slowly in the American League East, averaging 58 wins a season between 1977 and 1980. By 1983, they entered their first pennant race and soon became the most consistent team in baseball, averaging 91 wins through 1993. As stated earlier, expansion draft picks Jim Clancy, Garth Iorg, and Ernie Whitt all remained Blue Jays in 1986, combining for 31.8 wins above replacement for the decade. The Blue Jays under Pat Gillick became adept in the trading department, generating Roy Howell, Damaso Garcia, and Alfredo Griffin in deals for expansion draft selections. The Blue Jays probably would have ranked higher were it not for the contributions of the farm system and the Rule 5 draft that augmented the team’s success in the 1980s.
Aggregate WAR: 116.4
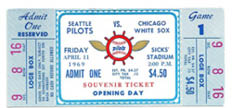
Full ticket to Opening Day with the Seattle Pilots, April 11, 1969. While the Pilots defeated the Chicago White Sox, their next Opening day in 1970 would be played in Milwaukee as the Brewers. (Courtesy of David S. Eskenazi)
3. Seattle Pilots-Milwaukee Brewers, 1969 to 1978, 188 pts
Ironically, two of the more successful drafts belonged to teams that posted only one winning season in their first 10 years. The expansion Senators perpetuated Washington’s legacy as “first in war, first in peace, and last in the American League” until a sudden 86-win season in 1969 under new manager Ted Williams. The Milwaukee Brewers, having moved from Seattle in 1970, remained in their divisional doldrums until 1978. That is the year general manager Harry Dalton and manager George Bamberger imported “the Oriole Way” from Baltimore to reinvigorate “Bambi’s Bombers” into a contender.
As stated earlier, when Frank Lane was appointed general manager of the Milwaukee Brewers in 1970, he inherited a franchise in disarray. True to his reputation, Lane concocted a series of mammoth trades to overhaul the roster by 1972. The deals brought a number of talented players to “Suds City,” even if the Brewers’ success as a team was not felt immediately. After five years of hitting “taters” over the fence at County Stadium, the Brewers traded George Scott back to Boston in 1976 for Cecil Cooper. “Coop” starred at first base for Milwaukee well into the 1980s, rapping 44 doubles in 1979 and batting .352 in 1980. The Brewers remained contenders in the American League East through 1983, winning the pennant in 1982.
Aggregate WAR: 151.1
2. Washington Senators, 1961 to 1970, 190 points
Both Milwaukee and Washington scored high points largely because of the acumen of their general managers in assessing the expansion players in trades. Late in the 1961 season, the Senators traded Dave Sisler to the Cincinnati Reds for Claude Osteen. The left-handed Osteen contributed nine wins above replacement before he was packaged to the Los Angeles Dodgers in 1964. Washington was able to negotiate for Frank Howard, Ken McMullen, Dick Nen, Phil Ortega, and Pete Richert in exchange for Osteen. The quintet of ex-Angelenos combined for 54.2 wins above replacement between 1965 and 1970. The Claude Osteen trade continued to generate quality players for the franchise long after it moved to Texas in 1971.
Aggregate WAR: 149.4
1. Kansas City Royals, 1969 to 1978, 249 points
True to hypothesis, the most successful expansion draft belonged to the Kansas City Royals. It was not even close, as they finished 59 points ahead of their nearest competitor. The explanation for the Royals’ successful draft has already been analyzed. They contended as early as 1971, remained competitive for the remainder of the 1970s and all of the 1980s, while generating talented players from their draft choices who made positive contributions to the team.
No account on the early success of the Kansas City Royals would be complete without acknowledging Ewing M. Kauffman. Mr. K was not even a baseball fan, just a billionaire pharmaceutical magnate with fierce pride in his adopted hometown of Kansas City. He knew the psychological malaise associated with the Athletics moving to Oakland in 1967. The threat of an antitrust lawsuit followed and when the Royals came to town in 1969, Mr. K was happy to finance whatever was required to build a winner for Kansas City and keep them competitive.
Aggregate WAR: 184.8
CONCLUSION
Using the criteria of won-lost analysis, the longevity of the careers of the expansion players, and the wins above replacement contributed by these players, it was determined that the Kansas City Royals conducted the most successful expansion draft of any team. While the Toronto Blue Jays and Milwaukee Brewers also became perennial contenders, the Senators slipped back to last place in 1970 before abandoning Washington a year later. Economic misfortunes were a main hindrance for many of the other teams. Some were underfunded while others were tight on money. Others still had the funds but spent profligately. Even the Brewers, despite their later successes, were born out of the bankruptcy of the Seattle Pilots in 1970.
Expansion has demonstrated to be a successful experiment for the National and American Leagues. As the nexus of gravity of American commerce and industry has shifted from the American Northeast to the Sun Belt, the Pacific Coast, and across the 49th Parallel, the population has migrated, bringing with its interest in baseball. No doubt Gordon Cobbledick would have marveled at how baseball has evolved as a truly national pastime with 30 franchises from coast to coast. It was time for expansion baseball.
MAXWELL KATES is a CPA who lives and works in Toronto. He has worked in commercial radio and he writes a monthly column for the Houston-based Pecan Park Eagle. Maxwell’s articles and essays have appeared in The National Pastime along with several SABR BioProjects. He served as Director of Marketing for the Hanlan’s Point Chapter for 12 years and has spoken at SABR meetings and conventions in Seattle, Montreal, and Houston. His baseball highlights include to have witnessed Magglio Ordonez’s home run to win the 2006 American League Championship Series for the Detroit Tigers, along with the final out of the 2017 World Series. This is his first SABR project in an editorial capacity.
Disclaimer
All figures for wins above replacement (WAR) are based on the statistics per Baseball-Reference. These figures have been rounded for presentation purposes. The reader should be aware that if one were to look up these wins-above-replacement figures on Baseball-Reference, the actual results may vary slightly.
Acknowledgements
Scott Crawford, Pat Gillick, Jim Kreuz, Len Levin, Barbara Mantegani, Bill Nowlin, Jacob Pomrenke, David Raglin, and Carl Riechers.
In addition to the undernoted source, the author relied on Retrosheet.org and Baseball-Reference.com to access information for this paper.


