
Who Threw the Greatest Regular-Season No-Hitter since 1901?
This article was written by Gary Belleville
This article was published in Spring 2021 Baseball Research Journal
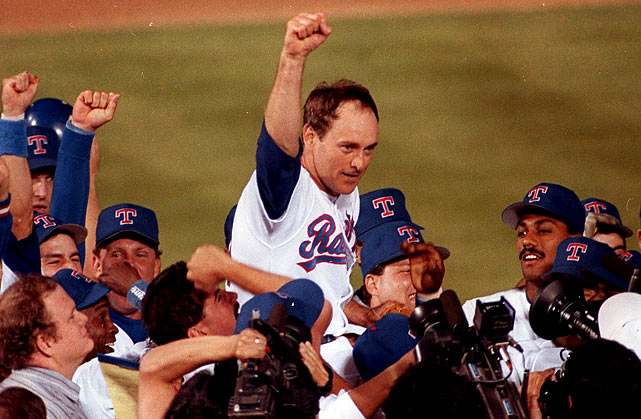
Nolan Ryan celebrates his 7th no-hitter on May 1, 1991. (MLB.COM)
A pitcher usually needs good command and quality stuff to toss a no-hitter.1 Stellar fielding and a dollop of good luck doesn’t hurt, either. A bad-hop single or a flare off the end of the bat that falls for a hit is all it takes to break one up. Between 1901 and 2020, a no-hitter was thrown in the American, National, or Federal League 263 times.2 It has been done just once in every 769 regular-season games.3
Although joining this exclusive club is a significant accomplishment, some no-hitters are more impressive than others. The two no-hitters thrown under postseason pressure, Don Larsen’s perfect game in the 1956 World Series and Roy Halladay’s no-no in the 2010 NLDS, are truly remarkable. At the other end of the scale are the no-hitters thrown in the dying days of the season against a weak-hitting, second-division club. In extreme cases, a pitcher may have the dubious honor of tossing a no-hitter in a losing cause, which is exactly what happened to Baltimore’s Steve Barber when he walked 10 batters in his combined no-hitter with Stu Miller in 1967.
Setting aside the two postseason no-hitters, an interesting question comes to mind: Who threw the greatest regular-season no-hitter since 1901?4 Some might suggest Max Scherzer’s 17-strikeout, zero-walk performance against the New York Mets on October 3, 2015, was the best of them all. I’d argue it may be the most dominant no-hitter of all time, but it’s not the greatest. It’s probably not even the most commendable no-hitter that Scherzer threw in 2015. Less than four months before his no-no at Citi Field, he no-hit a much stronger Pittsburgh lineup, striking out 10 without walking a single batter.
Rather than focusing on who threw the most dominant no-hitter, this paper will identify a short list of the greatest no-hitters thrown since 1901 based on their difficulty. An objective, quantitative method will be used. The results are not intended to be a definitive list, because different methodologies may lead to different results.
This article will also highlight the particularly noteworthy no-hitters identified and list some of the more interesting bits of trivia uncovered during the data analysis.
METHODOLOGY
The key factor when assessing the difficulty of each no-hitter is the batting average of the hitters in the opposing lineup. Statistics that measure speed, on-base ability, and power are important in generating runs, yet they are less relevant when it comes to breaking up a no-hitter.
The end-of-season batting average will be used for each player instead of the batting average at the time of the no-hitter. This will provide a better measurement of a hitter’s ability, since batting averages in early-season no-hitters can be misleading. For example, all Chicago White Sox batters had a .000 batting average immediately after Bob Feller’s Opening Day gem in 1940.
Neutralized batting averages (BAn) will be used instead of regular batting averages to eliminate the impact of a player’s home ballpark. This will allow, for instance, the batting averages of the 1996 Colorado Rockies to be compared fairly to those of the 1905 Chicago White Sox.5
A weighted neutralized batting average (BAwn) will be calculated for each no-hit lineup. This figure will be weighted based on the number of official at-bats in the game by each batter. For example, the BAn of a pinch-hitter who had one at-bat in the game will have one-third of the impact on BAwn as the BAn of a player who had three at-bats. One of the benefits of weighting by at-bats instead of plate appearances is that a pitcher will not get credit for walking a dangerous hitter, which may be done to help preserve the no-hitter.
A composite batting average (BAc) of the no-hit lineup will be calculated by adjusting the weighted neutralized batting average by the one-year park factor for hits (divided by 100) of the ballpark in which the no-hitter occurred. This composite batting average will approximate the combined season batting average of the opposing lineup had they played all their regular-season games in that ballpark, with each player having the same proportion of at-bats during the season as in the no-hitter.
The park factor for hits is not to be confused with the much more common park factor for runs, which is less relevant to no-hitters. The one-year park factor is used instead of the three-year version, since many ballparks, such as Braves Field in Boston, have undergone frequent modifications.6
DATA
A list of no-hitters was downloaded from Retrosheet. All 263 no-hitters thrown between 1901 and 2020 in the National, American, and Federal Leagues were included in the analysis.
Batting data for each of the 263 no-hitters were downloaded from the Regular Season Box Score Event Files, Regular Season Event Files, and Post-Season Event Files on the Retrosheet web site. The neutralized season batting averages for the players in the no-hit lineups were obtained from the Baseball-Reference.com web site, as were the yearly league-wide batting averages. The one-year park factors for hits were gleaned from the Ballparks Database on the Seamheads.com web site.7 The Retrosheet and Baseball-Reference.com player and team identifiers were cross-referenced using the Teams and People tables in the Lahman Baseball Database, which is available at SeanLahman.com.
No-hitters thrown in the Negro Leagues and the All-American Girls Professional Baseball League were not included because the required (structured) data are not currently available.
All data were loaded into an Oracle 18c database. SQL queries were used to generate the results.
DISCUSSION
Historical Trends
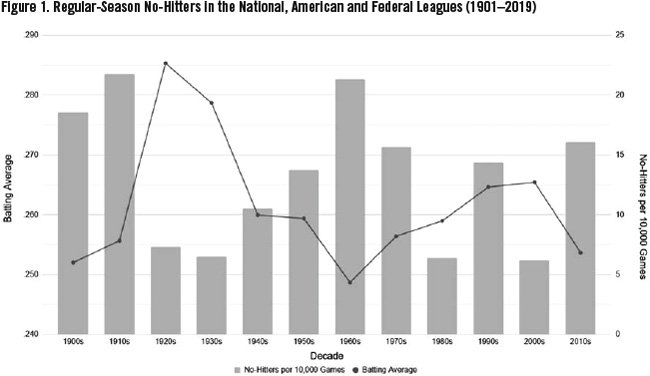
As the chart in Figure 1 shows, there is a strong negative correlation between the major-league batting average and the frequency of no-hitters in a decade.8 It’s no surprise the 2010s saw the highest frequency of no-hitters since the 1960s given that the batting average in the big leagues plummeted from .269 in 2006 to just .252 in 2019. If batting averages continue to decline, no-hitters may soon be as frequent as they were in the Deadball Era and the 1960s.
(Click image to enlarge)
Summary Data by No-Hitter Type
Of the 263 no-hitters thrown between 1901 and 2020, there were 238 nine-inning no-hitters with baserunner(s), four 10-inning no-hitters with baserunner(s), and 21 (nine-inning) perfect games.9 Because of their varying degrees of difficulty, this article will treat each category of no-hitter separately. Refer to Table 1 for summary statistics on each type of no-hitter.
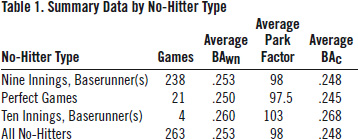
As one would expect, most no-hitters are thrown in pitchers’ parks. That is, those with a one-year park factor for hits below 100. Only 25.5 percent of no-hitters (67 of 263) have been thrown in hitters’ parks.10
The data also show that the weighted neutralized batting average of the opposing lineup in perfect games is on average 2.8 points lower than in nine-inning no-hitters with baserunner(s). Likewise, the composite batting average is 3.5 points lower.
The summary data for ten-inning no-hitters suffer from a small sample size and are skewed by one particularly difficult 10-inning no-hitter, which will be highlighted later in the paper.
Top 20 Nine-Inning No-Hitters with Baserunner(s)
The Top 20 nine-inning no-hitters with baserunner(s) ranked by composite batting average can be found in Table 2. At the top of the list is the unlikely no-hitter thrown by Hideo Nomo at Coors Field on September 17, 1996.
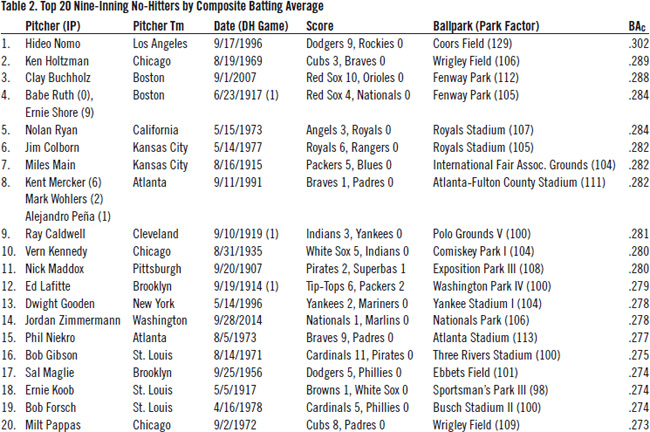
(Click image to enlarge)
This notoriously extreme hitters’ park hosted 2,047 regular-season games between 1995 and 2020. Nomo’s no-hitter was the only one thrown at “Coors Canaveral” during that time. Amazingly, he turned the trick against the Rockies in 1996, the year in which the Denver ballpark was at its most severe for hits.11 Its one-year park factor for hits was a stunning 129 that season. Nomo’s extraordinary accomplishment was as much a conquest of Coors Field as it was the Rockies, since the Colorado club hit .343 at home and a paltry .228 on the road in 1996.
The lineup Nomo faced included five hitters who finished in the National League Top 20 in batting average: Ellis Burks, Eric Young Sr., Dante Bichette, Vinny Castilla, and Andrés Galarraga. Future Hall of Famer Larry Walker, a key member of the Blake Street Bombers, was out of action that evening because of lingering pain from a broken collarbone suffered three months earlier.12
Nomo used his fastball and a devastating split-fingered pitch to shut down the Rockies, who hit just three balls sharply all game.13 Not a single spectacular play was required in the field.14 Because of the wet conditions, Nomo abandoned his deceptive, whirling delivery in the later innings to stabilize his footing.15 The Rockies still struggled against him. Nomo ended the night by striking out Burks, a .344 hitter, on a filthy split-fingered fastball. He struck out eight and walked four Colorado batters.
One notable aspect of the Top 20 nine-inning no-hitters is that six of them occurred in the Deadball Era. This shouldn’t be too much of a surprise, since the first two decades of the twentieth century still featured a fair number of teams with solid batting averages. For example, Ernie Koob of the St. Louis Browns no-hit the 1917 White Sox, a 100-win team that went on to defeat the New York Giants in the World Series. Koob faced a Chicago lineup containing four players with a neutralized batting average greater than .300: Happy Felsch (.325), Shoeless Joe Jackson (.318), Eddie Collins (.306), and Buck Weaver (.301). In a bizarre twist, the game ended with Koob having been credited with a one-hitter. Following the game, the official scorer changed a first-inning hit by Buck Weaver to an error. The next day’s headline in the Chicago Tribune erroneously read “Koob Tames Sox in One Hit Game, 1-0.”16
The entry in Table 2 for the combined no-hitter by Babe Ruth and Ernie Shore does not contain a misprint; Ruth did in fact pitch zero innings in that 1917 game. After he walked the Nationals leadoff hitter, Ray Morgan, a heated argument ensued over two alleged missed strike calls by home plate umpire Brick Owens. Ruth punched Owens during the altercation and was ejected from the game, forcing Ernie Shore to come on in relief. After Morgan was caught stealing, Shore retired the next 26 batters in order.17
The first of Nolan Ryan’s record seven no-hitters ranks fifth. The 26-year-old fireballer completely shut down Kansas City at Royals Stadium on May 15, 1973, which was no easy feat. The Royals finished second in runs scored in the American League that year, fueled by a .277 team batting average in their new, spacious ballpark.
In the introduction, Max Scherzer’s two no-hitters in 2015 were used as an example of a common pitfall in evaluating no-nos. Scherzer’s 17-strikeout performance at Citi Field ranks 196th out of the 238 nine-inning no-hitters with baserunner(s) using the methodology outlined in this article. The Mets lineup had a composite batting average of only .232, roughly 16 points less than an average no-hitter of that type. However, his no-hitter against the Pirates at Nationals Park less than four months earlier ranked 37th all-time with a solid .269 composite batting average.
Ten-Inning No-Hitters
A list of the four 10-inning no-hitters tossed between 1901 and 2020 can be found in Table 3. George “Hooks” Wiltse of the New York Giants threw the most difficult of the four by an exceedingly wide margin. His 1908 masterpiece came against a Phillies lineup that had a robust composite batting average of .293. Even more impressively, Wiltse would have thrown a 10-inning perfect game were it not for circumstances reminiscent of Armando Galarraga’s lost perfect game more than a century later.18
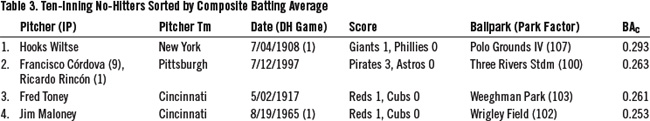
(Click image to enlarge)
Wiltse had overtaken a fading “Iron Man” Joe McGinnity as the Giants’ number two starter that season, forming a dominant lefty-righty combination with Christy Mathewson. Together, the duo combined to pitch 720 2/3 innings and record the win in 60 of the Giants’ 98 victories.19
The heart of the Philadelphia lineup facing Wiltse consisted of John Titus, Sherry Magee, and Kitty Bransfield, all of whom finished in the Top 10 in the NL batting race in 1908. Bransfield was one of just five .300 hitters in the entire National League that season.
Wiltse twirled his gem on Independence Day morning at the Polo Grounds, the wooden ballpark that opened in 1890 for the New York team that played in the Players’ League.20 With its distinctive horseshoe shape, the Polo Grounds was the most extreme hitters’ park (for hits) in the National League in 1908.21 In theory, the Phillies hitters were far more dangerous there than they were in their home park, the Baker Bowl, which played as a pitchers’ park in 1908.22 However, the ballpark in Coogan’s Hollow proved to be of no help to the Phillies that game.23
Wiltse breezed through the Philadelphia lineup, retiring the first 26 men in order. The fielders behind him weren’t required to make any outstanding plays, although right fielder “Turkey” Mike Donlin made a nice running catch in the fourth inning.24 Wiltse, one of the best-fielding pitchers of his era, took care of two other difficult chances himself.25
With two outs in the top of the ninth inning and the game still scoreless, Wiltse faced his mound opponent, George McQuillan. On a 1-and-2 count, the Giants hurler threw a curveball that started outside and broke sharply to “cut the heart out of the plate.”26 Home plate umpire Cy Rigler, normally an excellent judge of balls and strikes, called it a ball.27 Even the Philadelphia Inquirer admitted Wiltse had “fanned” McQuillan.28 The plate appearance continued. The very next pitch from Wiltse hit McQuillan in the shoulder, and the perfect game was no more. The next batter, Eddie Grant, grounded out to end the inning.
After the Giants failed to score in the bottom of the ninth, Wiltse returned to the mound and retired Otto Knabe, Titus, and Magee in order. New York finally scored a run in the bottom of the 10th inning, giving Wiltse the first extra-inning no-hitter in the National or American League.29 The 28-year-old moundsman retired 30 of 31 batters, with the only runner reaching base on a hit-by-pitch immediately following a missed strikeout call by Rigler. The respected umpire later acknowledged he made the wrong call. “Every time I saw Charlie Rigler after that he gave me a cigar,” Wiltse recalled in 1953. “He admits (the disputed ball) was one of the pitches he missed.”30
Top 10 Perfect Games
A list of the Top 10 perfect games by composite batting average can be found in Table 4. Charlie Robertson’s immaculate outing against the 1922 Detroit Tigers leads the way with a .291 composite batting average, almost 19 percentage points better than the second-ranked perfect game, which was thrown by Catfish Hunter in 1968.
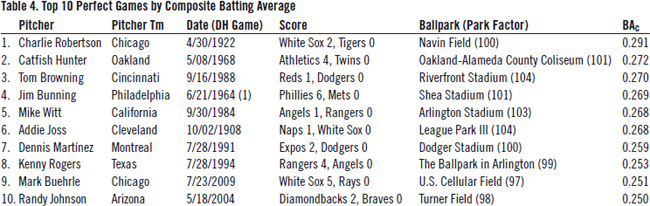
(Click image to enlarge)
One day after being shut out by future Hall of Famer Red Faber and his grandfathered spitball, the mighty Tigers expected to maul Robertson, an unheralded 26-year-old righthander making his fifth big league appearance. The Detroit lineup featured three sluggers who finished in the Top 10 in the American League batting race: Ty Cobb (.401), Harry Heilmann (.356), and Bobby Veach (.327).
Navin Field had a neutral park factor of 100 in 1922, although it was potentially more hitter-friendly during Robertson’s outing considering there was a large overflow crowd standing in the outfield. As it turned out, the fans in the outfield didn’t have a significant impact on the game. When Veach led off the second inning by sharply hitting a ball towards the roped-off area in left field, the Detroit crowd graciously gave way to allow Johnny Mostil to make an easy grab.31 The only standout defensive play of the game came two batters later when Harry Hooper made a “splendid running catch” on a ball hit by Bob Jones.32
The frustrated Tigers began to lose their cool once Robertson’s perfect game lasted into the middle innings. During his fifth-inning at-bat, Heilmann complained to home plate umpire Frank Nallin that the White Sox hurler was discoloring the ball. He continued to carp about it for the remainder of the game, as did Cobb, the Detroit player-manager.33 Cobb had first baseman Earl Sheely’s glove checked for evidence in the eighth inning, and in the ninth he had Robertson’s clothing inspected.34 Nothing untoward was uncovered. The unfazed Robertson retired the side in the final frame, including two left-handed-hitting pinch-hitters, to seal the perfect game.
“Had any student of baseball even dared to suggest that any pitcher could qualify to keep the Tigers away from first base and retire 27 men in order he would have been carted away to some state institution for the mentally unbalanced,” opined the Detroit Free Press.35 The writer’s hyperbole could be forgiven, because almost a century later those Tigers still possessed the highest weighted neutralized batting average (.291) of any lineup victimized by a perfect game—or any no-hitter for that matter.36
Hunter’s perfect game in 1968 is also noteworthy, considering the weighted neutralized batting average of the Twins lineup he faced was almost 40 points higher than the league-wide batting average (.230) in the “Year of the Pitcher.” Not only is it the largest such differential for any of the 21 perfect games, but it’s also the largest in all 263 no-hitters.
Bottom 10 No-Hitters
Although throwing a no-hitter is never easy, let’s turn our attention to those that were the least difficult to achieve according to the methodology outlined in this paper. A list of the 10 no-hitters with the lowest composite batting average can be found in Table 5. Two no-hitters stand apart from the others: Sandy Koufax’s perfect game against the Cubs in 1965 and Jimmy “Nixey” Callahan’s no-hitter against the 1902 Tigers.
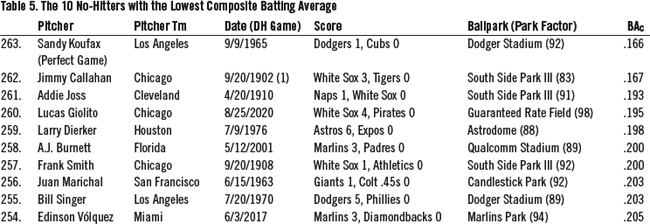
(Click image to enlarge)
The September 9, 1965, game between the Dodgers and Cubs was one of the most memorable regular-season games in baseball history. Koufax struck out 14 Chicago batters en route to becoming the first pitcher to record four no-hitters in the American, National, or Federal League.37 His mound opponent, Bob Hendley, limited the Dodgers to just one unearned run on one hit and one walk. As of the end of the 2020 season, this thrilling contest still held the big-league record for the fewest combined hits (1) and baserunners (2).
The Cubs lineup, sporting a composite batting average of .166, was incredibly weak. Five of their starters were rookies, including 19-year-old Don Young and 22-year-old Byron Browne, who were both playing in their first major league game.38 Browne had spent most of the season playing single-A ball, and to make his debut even more challenging, he had only arrived in Los Angeles earlier that afternoon.39
The Chicago batting order had three easy outs, as Young and Browne combined to go 2-for-41 with the Cubs in 1965, and Hendley came into the game with a career .093 batting average. Only three batters in the starting lineup finished the season with a batting average over .239. To Koufax’s credit, he was dominant enough that day to throw a perfect game against any team. The heart of the Chicago lineup—Billy Williams, Ron Santo, and Ernie Banks—combined to go 0-for-9 with six strikeouts.
Callahan threw his no-hitter for the White Sox at South Side Park III, the most extreme pitchers’ park in American League history.40 Although the ballpark hosted only 721 White Sox games between 1901 and 1910, four of those games featured a no-hitter.41
Callahan easily handled a feeble Detroit lineup that had only three hitters with a neutralized batting average above .227. Tigers manager Frank Dwyer even let his weak-hitting starting pitcher, Wish Egan, bat for himself with the team trailing by three runs in the eighth inning, a move that was not uncommon in the early twentieth century.42 Egan struck out to end the inning.
Miscellaneous Observations on No-Hit Lineups
During the data analysis for this research paper, several interesting observations were made while inspecting the batting data of no-hit lineups.
Even casual baseball fans know that Nolan Ryan holds the record for tossing the most no-hitters (seven). But which batter has been the victim of the most no-hitters? That distinction is shared by three individuals, two of whom were teammates on the Philadelphia Phillies. Between 1960 and 1969, Johnny Callison and Tony Taylor played together in the same six no-hit lineups.43 Callison, a fine-hitting outfielder, went 0-for-18 with two walks and four strikeouts in the six no-hitters, while Taylor went 0-for-16 with three walks and five strikeouts. Their record was tied in 1977 when Bert Campaneris was no-hit for the sixth time.44 Campy went 0-for-19 with three walks and four strikeouts in the six no-hitters.
As of January 2021, the Internet was teeming with web pages that listed the record for the most walks in a no-hitter as 10. Yes, Jim Maloney did walk 10 batters in his 10-inning no-no against the Cubs in 1965, as did Steve Barber in his nine-inning combined no-hitter with Stu Miller in 1967. However, the record for walks in a no-hitter is 11, set in 1976 by Chicago’s Blue Moon Odom and Francisco Barrios in their combined no-hitter against the Oakland Athletics. Odom walked eight batters in the first five innings. When he issued his ninth free pass to open the bottom of the sixth, White Sox manager Paul Richards summoned Barrios from the bullpen. He walked two more over the final four innings. Odom earned the win and Barrios picked up the save in a 2-1 White Sox victory. Although the no-hitter may have been messy, the Oakland lineup had a respectable composite batting average of .256, which ranks 87th out of the 238 nine-inning no-hitters with baserunner(s).
The single-game record for walks by a batter in a no-hit lineup is three, held by seven players. The hitters (and pitchers) are: Earl Torgeson (Cliff Chambers) in 1951, Dale Long (Sam Jones) in 1955, Mickey Stanley (Steve Barber) in 1967, Reggie Jackson (Jim Palmer) in 1969, Steve Huntz (Dock Ellis) in 1970, Bill Hall (Justin Verlander) in 2007, and Juan Pierre (Francisco Liriano) in 2011.
The single-game record for strikeouts by a batter in a no-hit lineup is four, held by Tony Graffanino of the Milwaukee Brewers. He donned the Golden Sombrero in Justin Verlander’s 2007 no-hitter. Verlander struck out 12 and walked four in the game.
No batter in a no-hit lineup has ever reached base on a hit-by-pitch (HBP) more than once in a game. The only batter with two career HBP in a no-hit lineup is Bill Freehan, who was plunked on April 30, 1967, by Barber and again just over four months later in Joel Horlen’s no-no. The two hit-by-pitches weren’t out of the ordinary for Freehan, as the Tigers catcher led the major leagues with 20 HBPs that season.
For additional information on no-hitters, the reader is invited to visit NoNoHitters.com, an excellent website created by journalist and SABR member Dirk Lammers.
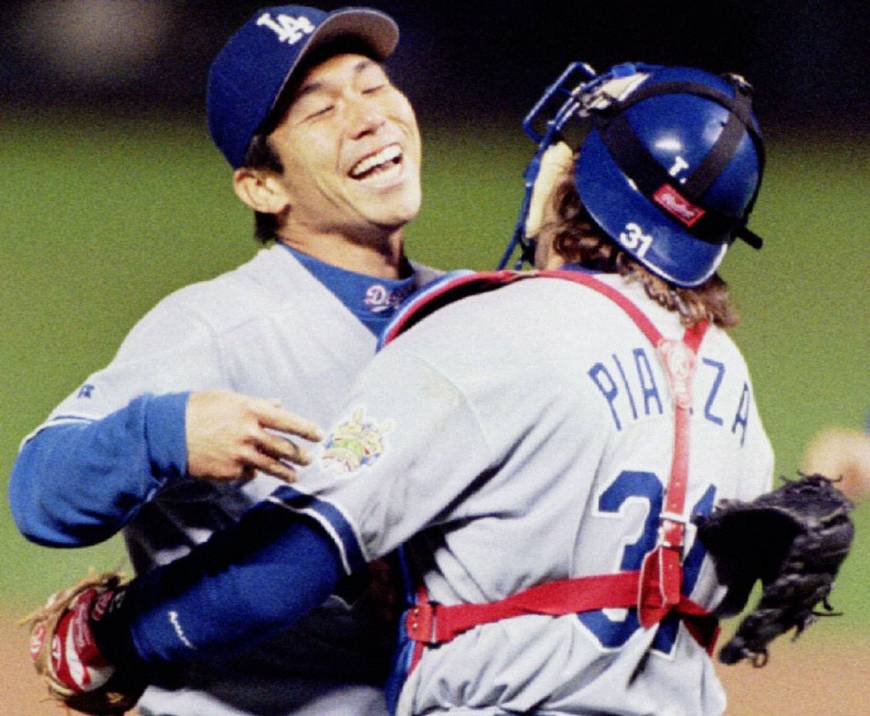
Hideo Nomo celebrates his no-hitter at Coors Field in 1996 (LOS ANGELES DODGERS)
CONCLUSIONS
This paper introduced a methodology for objectively comparing the difficulty of each no-hitter thrown in the American, National, or Federal League between 1901 and 2020. This mathematical model produced a short list of the most impressive no-hitters in that period.
Hideo Nomo’s nine-inning no-hitter at Coors Field in 1996 was one of the greatest pitching accomplishments in baseball history. The Rockies lineup that he no-hit had a composite batting average of .302. No other pitcher was able to throw a no-hitter in the 2,047 regular-season games played at Coors Field between 1995 and 2020.
Charlie Robertson threw the greatest regular-season perfect game in 1922 when he waltzed through a powerful Detroit lineup that included Ty Cobb, Harry Heilmann, and Bobby Veach. As of the end of the 2020 season, those Tigers still had the highest weighted neutralized batting average (.291) of any lineup victimized by a perfect game—or any no-hitter for that matter.
But who threw the greatest regular-season no-hitter since 1901? The author believes that distinction belongs to Hooks Wiltse for his incomparable 10-inning no-hitter and near-perfect game against a tough Phillies lineup at the Polo Grounds in 1908. In 31 Philadelphia plate appearances, the sole batter to reach base did so on a hit-by-pitch immediately following a missed strike-three call, an error later acknowledged by the home-plate umpire, Cy Rigler. Many believe that Armando Galarraga, the victim of another unfortunate umpiring error over a century later, deserves to be recognized for throwing a perfect game. So, too, does George “Hooks” Wiltse.
GARY BELLEVILLE is a retired Information Technology professional living in Victoria, British Columbia. He has written articles for both the SABR Games Project and the Baseball Biography Project, in addition to contributing to several SABR books. Gary grew up in Ottawa, Ontario and graduated from the University of Waterloo with a Bachelor of Mathematics (Computer Science) degree. He patiently awaits the return of his beloved Montreal Expos.
Author’s note
Shortly after beginning the data analysis for this article, I noticed that Retrosheet and Baseball-Reference.com listed one more nohitter than I was expecting—the 1901 Pete Dowling no-hitter. As luck would have it, this was mere days after Retrosheet posted the box score for it. This started me on my quest to solve the case of the lost Dowling no-hitter, and it culminated with the publication of the SABR Games Project article titled “June 30, 1901: Cleveland’s Pete Dowling tosses the American League’s first no-hitter — or does he?”
A spreadsheet containing the ranking of no-hitters based on this research paper’s methodology can be found here. Please note that new no-hitters will be added to this spreadsheet after the completion of each season. Gary can be reached at gbelleville@gmail.com.
Acknowledgments
Thanks to fellow SABR member Kevin Johnson for generating park factors for 1901-05 and for answering my questions about the Ballparks Database at Seamheads.com.
Notes
1. The pitching term “stuff” is not easily defined. However, the following definition is as good as any: “Stuff is a pitcher’s pitches, judged by how inherently hard those pitches are to hit.” Tom Scocca, “Here Is What “Stuff” Means in Baseball,” Deadspin, October 7, 2015, http://deadspin.com/here-is-what-stuff-means-inbaseball-1734592813, accessed January 29, 2021.
2. As of December 2020, Retrosheet and Baseball-Reference.com recognized 263 major-league no-hitters thrown between 1901 and 2020. However, Major League Baseball only recognized 262. The one discrepancy is the June 30, 1901, outing by Pete Dowling of Cleveland against the Milwaukee Brewers. This paper will include all 263 no-hitters. Gary Belleville, “June 30, 1901: Cleveland’s Pete Dowling tosses the American League’s first no-hitter—or does he?,” SABR Games Project, 2020, http://sabr.org/gamesproj/game/june-30-1901-clevelands-petedowling-tosses-the-american-leagues-first-no-hitter-or-does-he, accessed January 26, 2021.
3. There were 261 no-hitters thrown in the 401,330 regular-season team-games in the National, American, and Federal Leagues between 1901 and 2020. Two no-hitters were thrown in the postseason (a perfect game in 1956 and a no-hitter in 2010).
4. This paper will only consider no-hitters thrown since 1901, the year the American League was first designated as a major league. As of December 2020, the Retrosheet.org web site didn’t provide box scores or event data files for the 1900 season.
5. The neutralized batting averages of the 1996 Colorado Rockies can be found at http://baseballreference.com/teams/COL/1996-batting.shtml#all_players_neutral_batting, accessed January 26, 2021.
6. It is not possible to generate meaningful one-year park factors for ballparks hosting a small number of games in a season. The San Diego Padres played three home games in Estadio Monterrey in 2018; an estimated park factor of 100 was used. The Houston Astros played two home games in Miller Park in 2008 because of Hurricane Ike; the Brewers’ 2008 park factor for Miller Park (98) was used for those games. The Braves played 29 home games in Fenway Park in 1914; the Red Sox’s 1914 park factor for Fenway Park (94) was used for those games. The White Sox played 28 home games at South Side Park III in 1910 before moving to Comiskey Park I; the 1909 park factor for South Side Park III (91) was used for the games played there in 1910.
7. Unlike some other websites, the park factors at Seamheads.com are not automatically divided by two to account for the fact that half of all regular-season games are played at home. For instance, a park factor for hits of 108 on Seamheads is equivalent to a Fangraphs park factor of 104. In this example, eight percent more hits were recorded at that ballpark than a league-average park. Likewise, a Seamheads one-year park factor for hits of 94 is equivalent to a Fangraphs park factor of 97.
8. The data used to generate the chart in Figure 1 (batting average by decade and number of no-hitters per decade) have a correlation of -0.73.
9. An extra-innings perfect game has never been thrown. Pittsburgh’s Harvey Haddix threw 12 perfect innings against the Milwaukee Braves on May 26, 1959, before the perfect game, no-hitter, and shutout were broken up in the 13th inning. He lost the game 1-0. Although he was initially credited with throwing a no-hitter, that decision was reversed in 1991 by Major League Baseball’s Committee for Statistical Accuracy. Their revised definition of a no-hitter (“a game in which a pitcher or pitchers complete a game of nine innings or more without allowing a hit”) resulted in the elimination of 50 no-hitters from the record books, dating back to the 1890 season.
10. No-hitters were thrown in pitchers’ parks 67.7 percent of the time (178 of 263) and in neutral parks 6.8 percent of the time (18 of 263).
11. There were three seasons (1995, 1999, and 2000) in which Coors Field was more extreme for home runs than 1996. However, 1996 was peak Coors Field in terms of the one-year park factor for hits.
12. Quinton McCracken substituted for Larry Walker in the lineup Hideo Nomo faced. Walker had broken his collarbone on June 9, 1996, crashing into the fence at Coors Field. He returned to action on August 15. Walker left a September 7 game against the Astros because of pain in his left clavicle, and he made his final plate appearance of the year on September 12. He was limited to use as a pinch-runner and defensive replacement for the remainder of the year. A healthy Walker won the NL MVP award the following season.
13. Bill Staples Jr., “September 17, 1996: Hideo Nomo No-Hits Colorado Rockies at Hitter-Friendly Coors Field,” SABR Games Project, 2017, http://sabr.org/gamesproj/game/september-17-1996-hideo-nomo-no-hitscolorado-rockies-at-hitter-friendly-coors-field, accessed January 26, 2021.
14. Bob Nightengale, “NoooooooooMo,” Los Angeles Times, September 18, 1996, p35.
15. Associated Press, “Nomo Gets No-No,” The Daily Sentinel (Grand Junction, Colorado), September 18, 1996, 23.
16. Gregory H. Wolf, “May 5, 1917: On Second Thought, It’s a No-Hitter for Ernie Koob,” SABR Games Project, 2017, http://sabr.org/gamesproj/game/may-5-1917-on-second-thought-its-a-no-hitter-for-ernie-koob, accessed January 26, 2021.
17. Michael Clair, “Ernie Shore Once Threw a Quasi-Perfect Game…after Babe Ruth Punched an Umpire,” CUT4, June 23, 2015, http://mlb.com/cut4/ernie-shore-threw-quasi-perfect-game-after-babe-ruth-ejection/c-132245176, accessed January 26, 2021.
18. On June 2, 2010, Armando Galarraga of the Detroit Tigers retired the first 26 Cleveland batters he faced. The 27th batter of the game, Jason Donald, hit a groundball in the hole to first baseman Miguel Cabrera, who threw to Galarraga covering first. Video replays showed that Donald was clearly out, but first base umpire Jim Joyce called him safe. It was ruled an infield single, breaking up the perfect game and no-hitter. The next batter, Trevor Crowe, grounded out to end the game.
19. Hooks Wiltse went 23-14 with a 2.24 ERA in 330 innings pitched in 1908, while Christy Mathewson went 37-11 with a 1.43 ERA in 390)3 innings on the hill.
20. This facility, known precisely as “Polo Grounds IV,” was originally named Brotherhood Park. It burnt down in April 1911 and was replaced later in the season by the steel-and-concrete version of the Polo Grounds (“Polo Grounds V”) that served as the Giants’ home until they moved to San Francisco following the 1957 season.
21. The Polo Grounds had a one-year park factor for hits of 107 in 1908. Its dimensions were 258 feet to right field, 277 feet to left, and 500 feet to straightaway center field. South End Grounds III, home of the Boston Braves, was the most extreme hitters park in the National League for runs in 1908.
22. Over its history, the Baker Bowl was generally considered a hitters’ park, especially for left-handed batters. While it greatly inflated home run numbers beginning in 1911, the Baker Bowl had a one-year park factor for hits of 96 in 1908. The Phillies hit .243 at home and .245 on the road that season. Not a single Phillies batter hit a home run at the Baker Bowl in 1908.
23. The Polo Grounds were built on farmland known as Coogan’s Hollow.
24. Joe Cox, Almost Perfect: The Heartbreaking Pursuit of Pitching’s Holy Grail (Guilford, CT: Lyons Press, 2017).
25. “Wiltse’s No-Hit Game,” Sporting Life, July 11, 1908, 6.
26. “Giants Win Two Games,” Brooklyn Citizen, July 5, 1908, 6.
27. David Cicotello, “Cy Rigler,” SABR Bio Project, 2004, http://sabr.org/bioproj/person/cy-rigler, accessed January 26, 2021.
28. “Wiltse Too Much for the Phillies,”Philadelphia Inquirer, July 5, 1908, 24.
29. As of December 2020, the only previous extra-inning no-hitter in the big leagues (recognized by Retrosheet and Baseball Reference) was thrown in the American Association by Sam Kimber of Brooklyn against Toledo on October 4, 1884. The game ended in a scoreless tie when it was called on account of darkness.
30. Cox.
31. David Fleitz, “April 30, 1922: Charlie Robertson’s Perfect Game,” SABR Games Project, 2016, http://sabr.org/gamesproj/game/april-30-1922-charlie-robertsons-perfect-game/, accessed January 26, 2021.
32. Jacob Pomrenke, “Charlie Robertson,” SABR BioProject, http://sabr.org/bioproj/person/charlierobertson, accessed January 26, 2021.
33. Irving Vaughan, “Kid Robertson Flings Perfect Game for Sox,” Chicago Tribune, May 1, 1922, 23.
34. “Tigers Helpless before Robertson Who Pitches Perfect Game and Wins 2-0,” Detroit Free Press, May 1, 1922, 12.
35. “Tigers Helpless before Robertson Who Pitches Perfect Game and Wins 2-0.”
36. The second-highest weighted neutralized batting average (.287) of a no-hit lineup was in 36-year-old Hoyt Wilhelm’s nine-inning no-hitter of the 1958 Yankees at Baltimore’s Memorial Stadium. However, that ballpark’s one-year park factor for hits was a mere 94, so Wilhelm’s no-no ranks 35th in composite batting average (.270) out of 238 nine-inning no-hitters with baserunner(s). Memorial Stadium had a massive amount of foul territory. According to the Ballparks Database at Seamheads.com, its dimensions in 1958 were 309 feet down the lines, 405 feet to each power alley, and 410 feet to straightaway center field. Center field was even deeper during Memorial Stadium’s first four years (1954-57).
37. Koufax’s three other no-hitters ranked 48th (May 11, 1963, versus the San Francisco Giants), 118th (June 4, 1964, versus the Philadelphia Phillies), and 218th (June 30, 1962, versus the New York Mets) out of the 238 nineinning no-hitters with baserunner(s).
38. The three other rookies in the Chicago lineup were 25-year-old Chris Krug (playing in his 50th majorleague game), 23-year-old Don Kessinger (92nd major-league game), and 24-year-old Glenn Beckert (134th majorleague game).
39. Jane Leavy, Sandy Koufax: A Lefty’s Legacy (New York: HarperCollins, 2002), 22.
40. Eric Enders, “Exploring Extreme Ballparks Past,” The Hardball Times, November 16, 2018, http://tht.fangraphs.com/exploring-extreme-ballparks, accessed January 26, 2021.
41. The White Sox played 718 regular-season games and three World Series contests at South Side Park III. It was the home of the Chicago White Sox from 1900 until June 27, 1910, when the team moved into Comiskey Park I. The other three no-hitters thrown at South Side Park III between 1901 and 1910 were by Jesse Tannehill of the Boston Americans (August 17, 1904 versus the White Sox), Chicago’s Frank Smith (September 20, 1908 versus the Athletics), and Cleveland’s Addie Joss (April 20, 1910 versus the White Sox). The ballpark was renamed Schorling’s Park in 1911 and it served as the home of the Chicago American Giants until 1940. Several no-hitters were thrown there during that period, including a near-perfect game by Frank Wickware of the Chicago American Giants against the Indianapolis ABCs on August 26, 1914. Both teams were part of the Western Independent Clubs circuit in 1914.
42. James Elfers, “September 20, 1902: Chicago’s Nixey Callahan throws American League’s first no-hitter,” SABR Games Project, 2017, http://sabr.org/gamesproj/game/september-20-1902-chicagos-nixey-callahan-throwsamerican-leagues-first-no-hitter, accessed January 26, 2021.
43. The six no-hitters against lineups that included Johnny Callison and Tony Taylor were pitched by Lew Burdette of the Milwaukee Braves (August 18, 1960), Warren Spahn of the Milwaukee Braves (September 16, 1960), Don Nottebart of the Houston Colt .45s (May 17, 1963), Sandy Koufax of the Los Angeles Dodgers (June 4, 1964), George Culver of the Cincinnati Reds (July 29, 1968 – Game 2), and Bill Stoneman of the Montreal Expos (April 17, 1969).
44. Bert Campaneris was victimized by no-hitters thrown by Jim Palmer of the Baltimore Orioles (August 13, 1969), Clyde Wright of the California Angels (July 3, 1970), Jim Bibby of the Texas Rangers (July 30, 1973), Dick Bosman of the Cleveland Indians (July 19, 1974), Blue Moon Odom and Francisco Barrios of the Chicago White Sox (July 28, 1976), and Jim Colborn of the Kansas City Royals (May 14, 1977).