

Why It’s So Hard to Hit .400: New Insights into an Old Statistic
This article was written by J. Eric Bickel
This article was published in 2003 Baseball Research Journal
Batting average measures the batter’s ability to avoid striking out and his ability to “hit ’em where they ain’t.” However, the relative importance of these two skills is blurred by the traditional way in which we write AVG (H/AB). By rewriting AVG as a function of strikeouts per at-bat and hits per ball put in play, we gain greater insight into what has driven AVG over the last 100 years, why hitting .400 is so difficult, and whether or not batters can really place base hits.
To see the impact of strikeouts and putting the ball in play, let’s write AVG in terms of these effects, as shown in Equations 1 and 2. BIP is the number of times the batter put the ball in play – not including strikeouts.
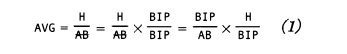
From Equation 1 we see that AVG is equal to the fraction of at-bats where the ball was put in play (BIP/AB) multiplied by the fraction of balls put in play that went for hits (H/BIP). This is intuitive-first the batter must put the ball in play and then it has to “become” a hit
Since there are only two possible ways to have an at-bat: (1) the ball is put in play or (2) the batter strikes out, BIP/AB = 1 – K/AB, where K/AB is the fraction of at-bats where the batter struck out. Let’s call the term K/AB the batter’s “strike out average” or KAVG and H/BIP his “in-play average” or IPAVG. We can then write Equation 1 as
Several other authors have referred to IPAVG as hits per ball in play (HPBP) or batting average per batted ball.[1] I prefer IPAVG because it more closely ties with “AVG”, where it plays a major role, and yet is not really a “batting average” because it rules out the possibility of a strikeout.[2]
To prove that Equation 2 works, we can calculate Ted Williams’ 1941 batting average, which was .406. In 1941, Ted Williams had 456 at-bats, struck out 27 times, and tallied 185 hits. He put the ball in play 429 times (456- 27), not including sacrifices. Therefore, his KAVG = K/AB = 27/456 = .059 and his IPAVG = H/BIP = 185/429 = .431. According to Equation 2, his AVG was (1 – .059) X .431 = .941 X .431 = .406.
Before moving on, we should note that Equation 2 makes it clear why batting average by count is misleading. If batting average is calculated for all counts with less than two strikes, then KAVG = O because no at-bat ends in a strikeout with less than two strikes. Therefore, AVG with less than two strikes is simply equal to IPAVG. Consider the following two situations: (1) Barry Bonds had an at-bat with less than two strikes and (2) Barry Bonds had an at-bat with two strikes. In which case is it more likely Bonds got a hit? When he had less than two strikes because we are sure he did not strike out. Comparing AVG across two-strike and non-two-strike counts is meaningless! Yet, STATs Inc continues to publish AVG by count.[3] For more detail, please see Bickel and Stotz (2002).[4]
The same reasoning that we used to develop Equation 2 can be applied to SLG. In this case, SLG measures the batter’s ability to avoid striking out and the number of bases he obtains when he puts the ball in play. This is shown in Equation 3.

In Equation 3 we have called Bases/BIP the “In-Play Slugging Average” or IPSLG.
Equations 2 and 3 suggest many interesting questions. What are the average KAVG, IPAVG, and IPSLG for major league hitters? Has this changed over time? Has the change in AVG over the last 100 years been driven by changes in KAVG, IPAVG, or both?
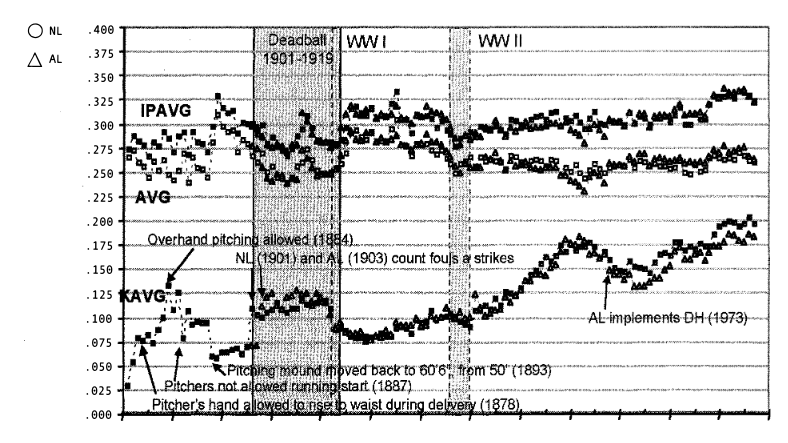
Figure 1. KAVG, IPAVG, and AVG for the AL and NL since 1876.[5]
What does it take to hit .400? Did Ted Williams hit .406 by avoiding strikeouts, or was he better at hitting them where they ain’t KAVG seems to be more under the control of the batter than IPAVG, in that IPAVG is driven by the structure of the game (e.g., the number and location of fielders, field dimensions, etc.) and, to some degree, just plain luck. Do some batters really have the ability to “place” the ball so that they get more hits when they put the ball in play? Can a major league hitter improve his AVG more by improving his KAVG or IPAVG? Do pitchers differ in the IPAVG and IPSLG that they allow?
In baseballprospectus.com, Voros McCracken reported that pitchers differ very little in their ability to prevent hits once the ball is put in play. In our words, they differ little in the IPAVG that they allow. Many other researchers have confirmed this effect
KAVG AND IPAVG: A HISTORICAL PERSPECTIVE
Figure 1 displays KAVG, IPAVG, and AVG for the AL and NL since 1876. The lowest data set is KAVG. The circles represent the NL and the diamonds the AL. The middle data set is AVG for the NL and AL. And, finally, the top dataset is IPAVG for the NL and AL. The Deadball Era (1901-1919) is clearly visible in the IPAVG data, with two dramatic declines-which would not be matched until World War II (WW II). It is interesting to note that strikeouts were relatively high during this era. The KAVGs recorded during this time, would not be seen again until the mid-1950s. It is generally agreed that Deadball Era ended in 1920 with the banishment of the spitball and other “freak” pitches.6
However, KAVGs began to collapse as early as 1917, and IPAVGs began their dramatic increase in 1919 (mostly in the AL). These years coincide with America’s involvement in WW I, but we are unsure as to the relative significance of WW I (e.g., loss of key players), the banishment of the spitball, and other factors. IPAVG has generally been above .300 since the 1950s. NL and AL IPAVG data sets are similar because the rules governing balls put in play have been consistent between the two leagues. The AL gained a slight advantage over the NL with the introduction of the DH in 1973.
The trend of IPAVG has been generally upward since 1977 and is currently around .322 or almost 33%, with a dramatic increase starting in 1993. An IPAVG of about 33% means that the average MLB batter has about a one-third chance of getting a hit if he puts the ball in play. In a statistical sense, about two-thirds of the field is covered by the defense. Interestingly, 0.333 is very close to the IPAVG that Dean Stotz and I found in college baseball.7 Clearly, IPAVG is driven to a very large degree by the structure of the game (e.g., the shape of the field, the number of fielders, the distance to the outfield wall).
KAVG has been more variable and swung wildly between 1876 and 1901, as the NL tinkered with the number of balls allowed before a walk, the distance from the pitcher’s mound to home, and whether or not foul balls counted as strikes.
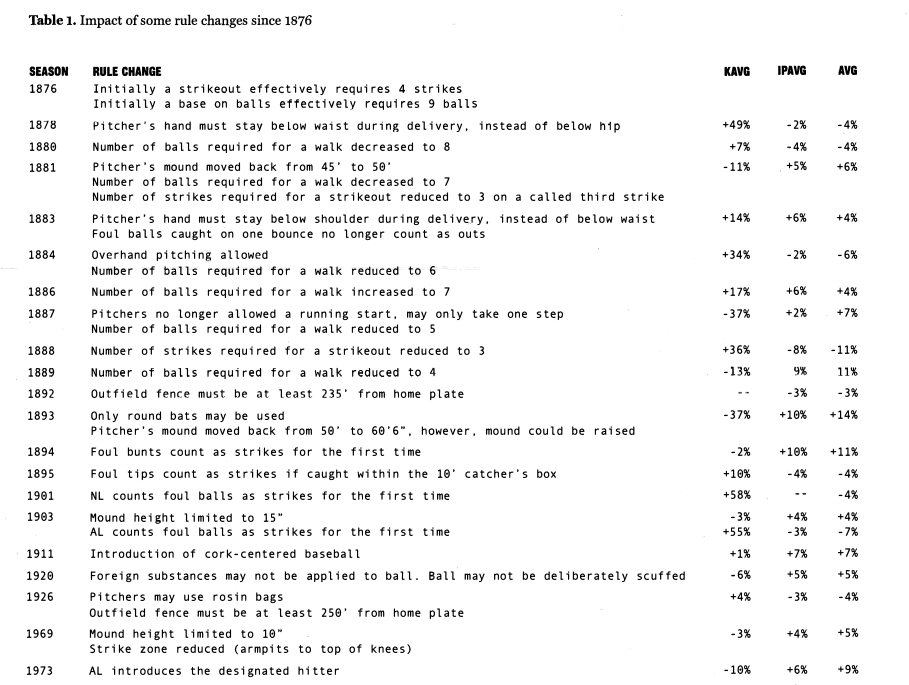
Figure 1 highlights some of the rule changes. Table 1 presents a more exhaustive list of rule changes and what happened to KAVG,
IPAVG and AVG.[8] Changes to the pitcher’s delivery, reducing the number of strikes required for a strikeout and counting foul balls as strikes had dramatic effects on strikeouts. We also see that IPAVG increased by 7% after the introduction of cork-centered baseball in 1911. However, the Deadball Era resumed after this increase. It is interesting that KAVG has doubled during the last 50 years; batters are twice as likely to have their AB end in a strikeout now than they were in 1945. This increase in KAVG has tended to hold batting averages in check
HITTING .400
What does it take to hit .400? Equation 2 shows that at a minimum the batter must get a hit 40% of the time he puts the ball in play (IPAVG = .400). In this case, he will hit .400 ifhe never strikes out. If he strikes out in 10% of his ABs (KAVG = .100), he would need to have an IPAVG of .444 (.4+[1-.9])-or he would have to get a hit 44.4% of the time he put the ball in play. A KAVG of .100 is quite low by today’s standards, being about half of the current 0.190 average. Furthermore, an IPAVG of .444 is astronomical by any historical measure. Table 2 presents the top 20 IPAVGs since 1913 (note: we have not included seasons prior to 1913 because individual strikeout data is unavailable in the AL until this time).[9]
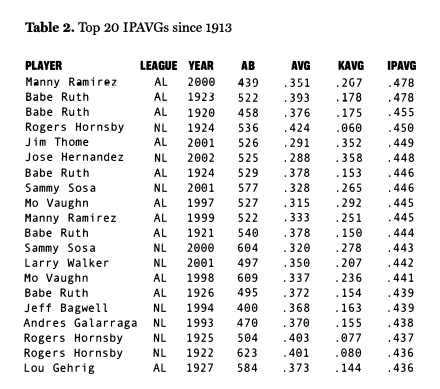
Table 2 shows that IPAVG has been over .444 in only 11 player seasons since 1913 (about .12%). We also see that home run hitters have generated most of the top IPAVGs. This is understandable given that balls hit into the stands do not have the possibility of being caught. The record IPAVG of .478 belongs to Manny Ramirez. However, he “only” hit .351 because almost 27% of his ABs ended in strikeouts. Babe Ruth compiled five of the top 20 IPAVG seasons. Only three of the top 20 IPAVGs have resulted in AVGs over .400 – all of them by Rogers Hornsby.
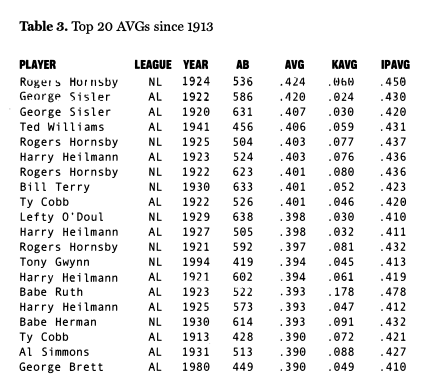
Table 3 runs down the top 20 batting averages since 1913. No batter has hit .400 or higher with an IPAVG below .420 (Ty Cobb, 1922). Furthermore, no .400 AVG has ever been accompanied by KAVG of greater than .080 (Rogers Hornsby, 1922). T his is about one third the current MLB average.
A COMPARISON OF WILLIAMS, BRETT, AND GWYNN
Before leaving this historical look at IPAVGs and KAVGs, let’s look at four more incredible player-seasons: Ted Williams 1941, Ted Williams 1957, George Brett 1980, and Tony Gwynn 1994. In 1941, Ted Williams’ KAVG was 42% lower and his IPAVG 45% greater than the league average (see Table 4).
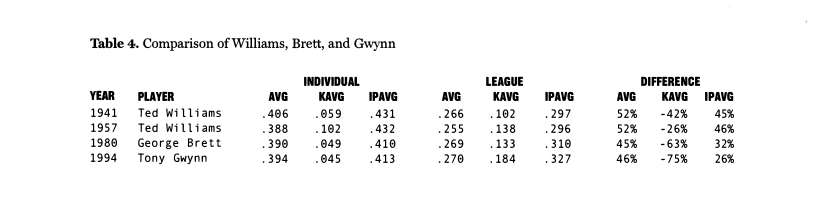
In 1957 his IPAVG was even higher than 1941, but he struck out almost twice as often as 1941. George Brett and Tony Gwynn had incredibly low KAVGs-less than .050, or about 70% lower than the league average (much better than Ted Williams). However, their IPAVGs were too low to break the .400 barrier.
AN EXPLOSION IN OFFENSE
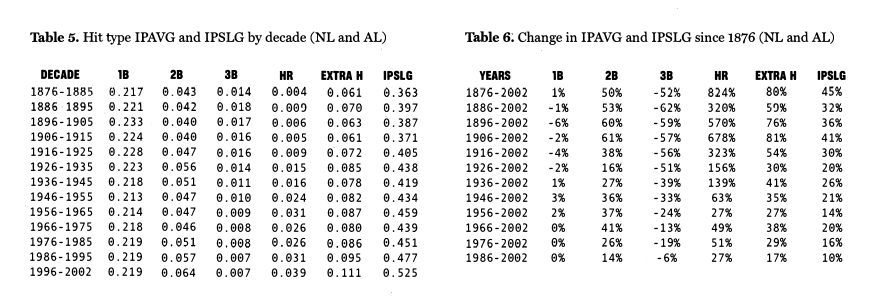
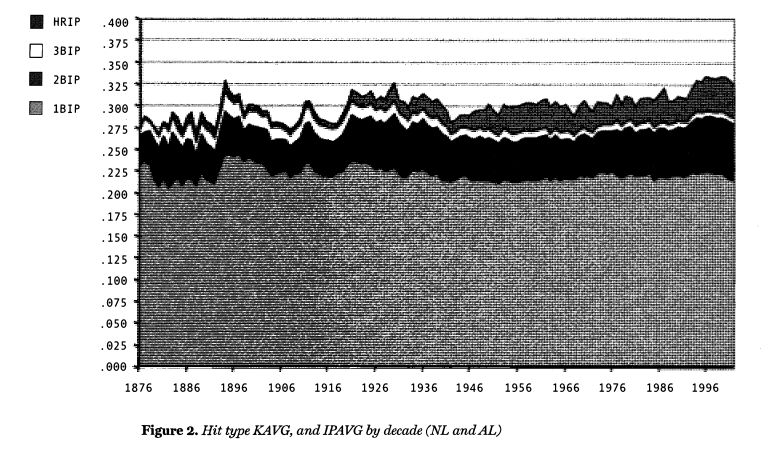
IPAVG has increased dramatically since 1993. As we know, this increase has been driven by a major increase in home runs. Figure 2 makes this abundantly clear. Several interesting trends appear in Figure 2. First, the fraction of balls put in play that have become singles (IBIP) has remained quite stable since 1946. Next, the likelihood of a triple (3BIP) has decreased substantially since 1876. This must be driven in large part to changes in field dimensions. And, most strikingly, the likelihood that a ball put in play becomes a home run (HRIP) increased dramatically since the middle of the century and has exploded since 1993Many of these trends become apparent by looking at averages over several decades, as shown in Table 5. Table 6 presents the change in the average to 2002.
The chance of a single, given the ball has been put in play, has only increased by 1% from the 1876-1886 average (.217 vs .219). This should not be surprising given that• the factors that determine whether a ball put in play becomes a single (field dimensions, location of fielders, speed of batted ball) have not changed appreciably, if at all, since 1876. On the other hand, the likelihood of doubles, triples, home runs, and all extra-base hits (Extra H) has changed dramatically over the years. Likewise, IPSLG has seen significant increases.
(Click image to enlarge)
PLACING BASE HITS
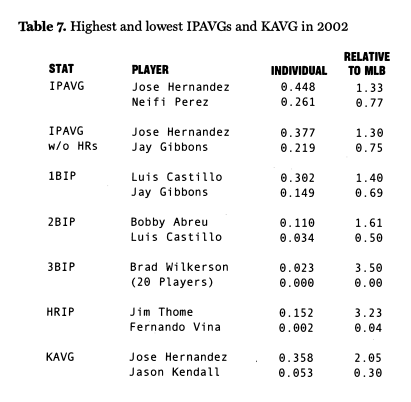
Do batters have the ability to place base hits? This is a question worthy of more space than we can provide here. However, a quick look suggests that, yes, the ability to place base hits is a skill. Table 7 presents the highest and lowest IPAVGs (in total and by hit type) and KAVG for the 2002 season (only players eligible for a batting title were considered).
Jose Hernandez led the majors with a .448 IPAVG (1.33 times the league average), while Neifi Perez’s IPAVG was only .261 (0.77 times the league average). Even if we exclude home runs, and thereby do not include power hitters, we find a significant difference between player performance-Jose Hernandez’s .377 versus Jay Gibbons’ .219. Not surprisingly, the difference between the best and the worst is even greater for other hit types.
We also see a significant difference in terms of KAVG. Jose Hernandez led the majors with a .358 KAVG in 2002. That’s right, the same Jose Hernandez that led the league in IPAVG! 35.8% of Jose’s at-bats resulted in strikeouts, but if he put the ball in play he got a hit 44.8% of the time. That is the sixth-highest IPAVG since 1913 (see Table 2). Jason Kendall had the lowest KAVG with only 5.3% (.053) of his ABs ending in strikeouts.
As you can see, batters appear to differ to a significant degree· in their ability to get a hit once they put the ball in play and their ability to avoid strikeouts. However, the spread among players is greater for KAVG than it is for IPAVG. That is, players differ to
a greater degree in their ability to avoid striking out than in their ability to get a hit once they put the ball in play.
Further research should focus on whether or not a player’s performance is consistent over time.
CONCLUSION
Batting average measures the batter’s ability to avoid striking out and his ability to “hit ’em where they ain’t.” By rewriting AVG as a function of these two effects, we gain greater insight into what has driven changes in AVG over the last hundred years, why hitting .400 is so difficult, and whether batters can really place hits.
J. ERIC BICKEL is President of Competitive Edge Decision Systems, which provides pitch/hit-charting software to amateur and professional baseball teams.
Acknowledgments
The author thanks Jim Charlton and three anonymous reviewers for many helpful suggestions.
Notes
1. Dean Stotz and I referred to this as IPA in our 2002 BRJ article (Bickel, J. Eric, and Dean Stotz, “Batting Average by Count and Pitch type: Fact and Fallacy,” The Baseball Research Journal, No. 31, 2003, pp. 29-34). In that same issue, Dick Cramer referred to this concept as “batting average per batted ball” (Cramer, Dick, “Preventing Base Hits: Evidence That Fielders Are More Important Than Pitchers,” The Baseball Research Journal, No. 31, 2003, pp. 88-92). See also, Birnbaum, Phil, “Factors Affecting Pitcher Ball-in-Play Average,” By the Numbers, May 2001, pp. 8-11.
2. John Burnson developed equation 1 independently in Ron Shandler’s 2003 Baseball Forecaster (pp. 7-8). Stanford Baseball has been calculating IPAVG since 1998, and this stat has been publicly available since 2000.
3. In addition, Jim Albert and Jay Bennett analyze AVG by count in their book Curve Ball (see pp. 87-107). They note, “Players who have small pitch count effects are relatively unlikely to strike out.” This is expected because AVG for batters that do not strike out a lot is almost equal to IPAVG, which is not as dependent on the count as KAVG.
4. Bickel, J. Eric and Dean Stotz, op cit.
5. This data was obtained from the Lahman Baseball Database (www.baseballl.com). Individual player data on strikeouts is unavailable from 1897 to 1909 in the NL and 1901 to 1912 in the AL, However, league total strikeout data was obtained from Total Baseball.
6. Steinberg, Steve L.,. “The Spitball and the End of the Deadball Era,” The National Pastime, No. 23, 2003, pp. 7-17.
7. Bickel, J. Eric, and Dean Stotz, op cit.
8. These rule changes were obtained from David Nemec’s outstanding book The Rules of Baseball (1994, Lyons and Burford Publishers) and Total Baseball.
9. Only player seasons for which the batter had enough plate appearances to be considered for a batting championship were included.