

2019 SABR Analytics: Listen to highlights from the Statcast Year Five: Where Are We Now? panel
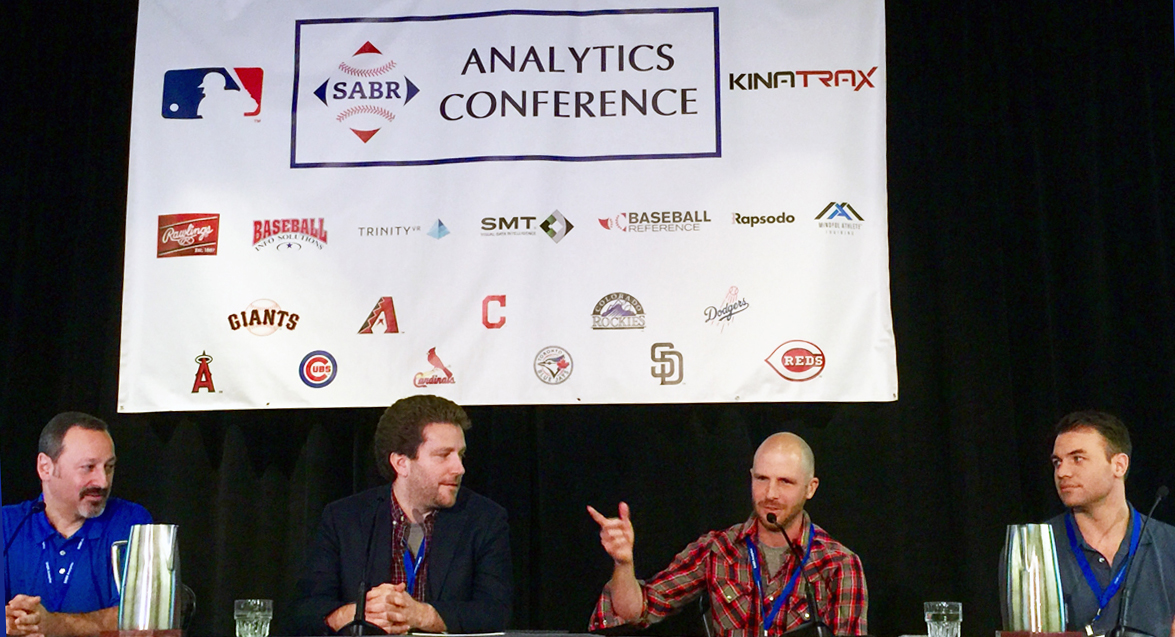
The Statcast Year Five: Where Are We Now? panel at the 2019 SABR Analytics Conference, presented by MLB and KinaTrax, focused on the first five seasons of the MLB Statcast system, how it has evolved, what we’ve learned from all the new data in baseball, and what we might see in the upcoming season.
The panel on March 9, 2019, included Greg Cain, Vice President of Baseball Data for Major League Baseball; Travis Petersen, MLB’s Senior Data Scientist; Cory Schwartz, MLB’s Vice President of Data Operations; and Daren Willman, MLB’s Director of Baseball Research and Development.
- Audio: Listen to highlights from the Statcast Year Five: Where Are We Now? panel at the 2019 SABR Analytics Conference (MP3; 57:43)
 Here are some highlights:
ON THE PREDICTIVE MEASURE OF EXIT VELOCITY
- Schwartz: “In 2014, just looking at exit velocity, we’d see these weird spikes in player performance. Ryan Zimmerman is one that jumps out in my mind. He was really sort of the first poster boy for the value of this data. His exit velocity just went down and down and down all year long. Eventually, he went on the DL. He had a foot problem, I believe. [Then he] came off the DL and was still hitting .219 into early mid-August, but his exit velocity was going straight up from that point forward. I remember looking at the chart and being like, ‘Wow, he is really making great contact. I think the results are going to follow.’ … And I think over the last six weeks of the season, he hit .390 with 13 home runs or something like that. Even though when he first came off the DL the production wasn’t there, the exit velocity had rebounded. So that opened our eyes a little bit to some degree, the predictive measure of the data, but also how the data speaks to specific skills. Maybe in the future, [it] will help with injury detection, injury prevention, the holy grail of sports.”
ON USING STATCAST DATA TO EXTRAPOLATE INFORMATION ABOUT PLAYERS’ BASEBALL IQ
- Schwartz: “The mental aspect of the game is something we can start to extract a little from the data. Everything that happens on the field is a probability. There is a probability of getting a hit, making an out, being safe. … If we look at what players do, to the [likely] probabilities of the play, we can understand a little bit who has the best comprehension of the game relative with their skills. … If we look at probability of every play and various outcomes and see how often players’ performance and the things they did match up with probabilities, we can start to see who the smartest players are. … We can start to understand the mental aspect a little bit with the physical performance data. ”
 ON HOW STATCAST CAN BE USED TO ENHANCE TV BROADCASTS
- Schwartz: “[TV] broadcasts are a critical part of reaching fans. We can use Statcast data to automatically direct a game. If we know where the ball is going to be hit and where the players are going to run, and have the probability of what the outcome is going to be on the play, we can automatically direct the cameras, turn up the audio in certain microphones in certain parts of the field.”
ON MEASURING OUTFIELDERS’ ROUTE EFFICIENCY
- Willman: “One of the interesting guys is [Atlanta Braves center fielder Ender] Inciarte. We noticed that he is not the fastest outfielders by any means, but he is one of the best. Why is that? Going back to route efficiency, we are kind of working on a new metric called Jump. Its basically taking all the components of a route, reaction, the actual route, and some other things. We are able to break it down by components.”
- Cain: “Catch probability only uses two elements. How long do they have to get there and how far do they have to go? It is difficult to answer on a player basis. To understand a player’s quality in the outfield, [we] need to understand how fast they are. How fast do they accelerate? How well are they using their speed? Lots of different components that go into this. The key challenge is, ‘How do I know that guy is that fast? When are they using their top speed?’ Baseball is a nuance game. There is no flag saying he is using his max effort there. … That’s one of the key challenges of extracting those skills from an outfield player, for example, to get really good insight to make anything specific to a player.”
 ON THE VISION OF A THREE-DIMENSIONAL VIEW
- Willman: “One of the things we have been pushing is 3D Gameday. You can watch the game in 3D dimensional space. Let’s say you want to view the play from Mike Trout’s eyes. You would be able to, in 3D [view], click on him, show from his eyes where the ball goes. We have the trajectory, we have all the players, things like that. Using things like pose, limb tracking. Being able to know where all the players’ limbs are. It would be a cohesive environment.”
ON USING FOOT SPEED TO ESTIMATE STOLEN BASES
- Petersen: “Something we looked at last year in the playoffs was stolen base probability. We have a graph that shows based on a runner’s lead, how successful can we expect him to be to steal second? Those are some broadcast components that make it more fun for the fans. How far should the runner be off the bag before they try and steal?”
For more coverage of the 2019 SABR Analytics Conference, visit SABR.org/analytics.
Originally published: March 14, 2019. Last Updated: July 27, 2020.