

Watch highlights from the MLB Statcast Update at 2020 SABR Analytics Conference
At the SABR Analytics Conference on March 13, 2020, the MLB Statcast team gave an update on new developments with the celebrated tracking system.
Panelists included Jason Bernard, a Baseball Research Analyst at Major League Baseball; Greg Cain, Vice President of Baseball Data for MLB; Clay Nunnally, a Baseball Scientist at MLB; and Daren Willman, Director of Baseball Research and Development for MLB.
- Video: Watch a replay of the MLB Statcast Update at the 2020 SABR Analytics Conference (YouTube)
- Audio: Listen to highlights from the MLB Statcast Update at the 2020 SABR Analytics Conference (MP3)
Here are some highlights:
ON THE FIRST-GENERATION STATCAST SYSTEM
- Cain: “Both from a radar perspective and from a camera player tracking perspective, we have learned a lot since [we launched Statcast in 2014]. As we went into this system, we didn’t have a specific accuracy or a requirement baked into the platform. In 2018, we added a camera system as we wanted to get more accuracy out of the system. We had limited coverage of pop-ups, grounders and balls down the line. Throws across the field from third to first or pickoff attempts, these were limitations of the system that we knew going into it. … We did a lot of work to make sure the system and the data we provided looked as complete as we possibly could. Still, we had those limitations. Somebody told me long ago that one of the key elements of tracking systems, of using the data at scale, is that we need a completeness in accuracy across all fronts in order to use all the data in certain ways. We had some tricks that we put in place to compensate for some of that but the limitations were still present.”
ON OBJECTIVES FOR THE NEW STATCAST SYSTEM
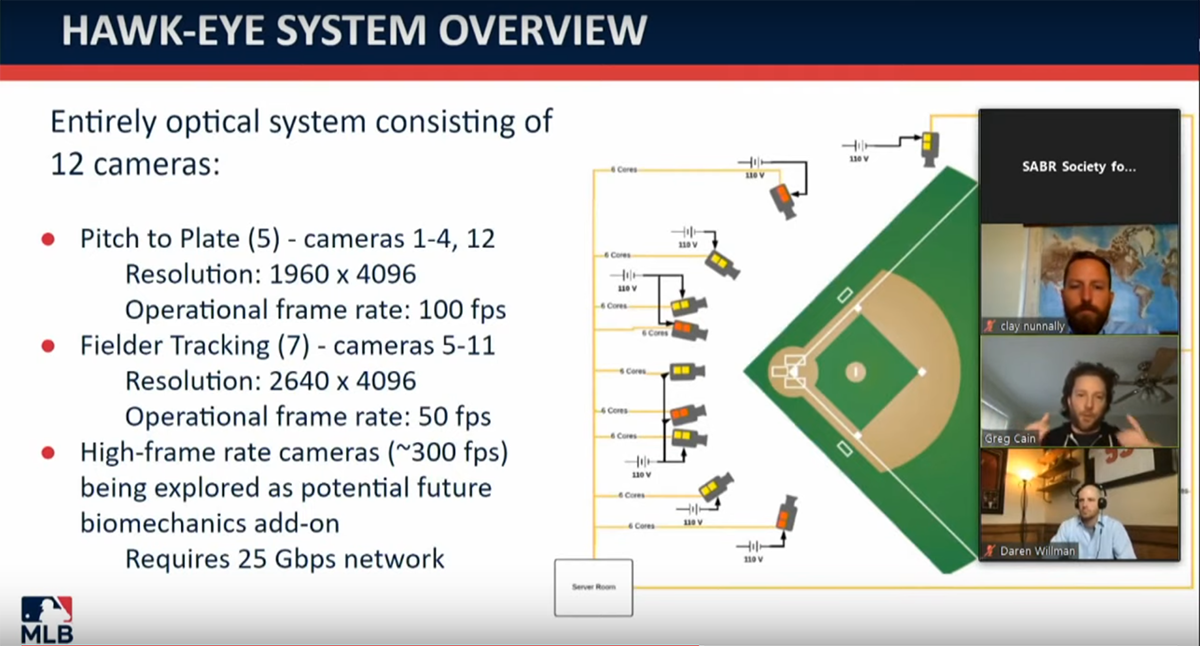
- Cain: “For the next generation system, Clay and I and a handful of others sat down to start thinking about what we learned in the first system. … The more we learned about machine vision and machine learning, we realized that the camera system was a good area to focus on, specifically with the advances of some of the things we’ve seen. … We wanted to increase the automation, as well. So other elements around this to identify the players automatically through jersey number detection or through other means. … We wanted to build a foundation for the future of tracking systems that we could make it extendable, adding in additional elements so we could augment what we were seeing to keep the baseline of what we had from 2015-2019. We wanted to make sure those data points were present. … You’ll see some things around player tracking, bat tracking and some high frame rate stuff that we’re considering in the future. We worked with a few vendors, did some testing in the offseason between 2018 and 2019. We ended up choosing Hawk-Eye as our vendor through some of the demos that they showed us. … We also chose a new cloud provider as well for all our computing storage as well.”
ON THE ACCURACY OF PLAYER TRACKING
- Nunnally: “One of the best things about Statcast is the context it provides to all of these measurements. … The first result here is ground truth testing of the strike zone accuracy. This is not something we think is hard, but we think it’s very important. We can see there’s some examples here of ground truth test from 2016 and 2017 that indicate not great accuracy. Then we’ll have some tests from 2018 and 2019 I think with very, very good accuracy. Then you’ll see the Hawk-Eye test here in the middle which is our accuracy going forward. This chart can be thought of as our true chart. It’s accurate if all the error clusters are centered around zero. It’s precise if that cluster is small. So whenever we do a strike zone ground truth test, we want to come back with a small grouping. We want that cloud of error to be centered on zero. This test is just examples from some of the technologies that Statcast has used in the past. It gives us confidence that were going to have some very accurate ball-strike calls.”
ON HIT TRACKING
- Nunnally: “Another thing that we care about a lot is being able to track hits and to access how well our legacy system in Hawk-Eye tracks hits, using a live-hour survey station and survey crew to actually mark where the ball landed. Then we can how well these systems calibrated and how well they tracked hit trajectories that we think are pretty difficult. This test was done at Chase Field and we tried to re-create hit trajectories that are difficult to track. Ones that are really high up, really straight up, and ones that are down the line and really fast. Those are typically Doppler transverse and they are hard for the radar to see. When they go down the lines and then when they go really high, they have a really low velocity component in the direction of the radar. That’s just a natural outcome of the technology. But we wanted to re-create some trajectories that were hard and see if Hawk-Eye could measure them. So we did that and we found that Hawk-Eye could measure these trajectories, any of these difficult ones, within a foot anywhere on the field. The nice benefit of having a vision system here is once the ball leaves the field of view of the cameras, it can also re-acquire that trajectory when it re-enters the field. So reacquisition trajectories are a big thing for us to be able to track and understand these very long home run trajectories. Hit tracking is really good, that’s the takeaway from this!”
ON NEW LEADERBOARD METRICS
- Willman: “In 2019, we started off by adding catcher framing, basically taking what we call attack zones, we look at ball and strikes in those attacks zones called the shadow zone. Basically anything that can be in between a ball or a strike, and we came up with a metric based off that. Tom Tango has done a lot of work with all these metrics. That was one of the key pieces that we added last year. Another one we added last year was outfielder jump. It is basically a component to outs above average. It goes hand in hand. It breaks down any individual play based off their reaction, their burst and their route. What we defined a reaction was the first 0 to 1.5 seconds of a play. The burst is when they really have to start running, the first 1½ seconds to 3 seconds. Then we generalized the whole thing as “Route,” which is 3 seconds.”
ON NEW PITCHING METRICS
- Willman: “We also added pitch movement last season. We have been — me, Mike Petriello, and Tom [Tango] — have been going back and forth for a long time about how we wanted to approach pitch movement. What we decided at the end of the day was we were going to add reported gravity, which makes our numbers a little larger than the ones that other people put out. We’re really happy with the way it turned out. Another thing that we released last year was active spin — basically, the spin that contributes to the movement. We introduced a rolling leaderboard which is basically windows into various breakdowns of plate appearances to show who’s hot and who’s not. We can break it down through xwOBA, exit velocity, expected batting average, a bunch of various metrics.”
ON CUSTOM LEADERBOARDS
- Willman: “We also introduced a custom leaderboard, so basically you can go to one of the leaderboards on Baseball Savant and you can create a leaderboard of anything you want. All these Statcast metrics — front speed, pop time, outs above average — You can create your own leaderboard and you can share it on Twitter or wherever. It allows the user to create whatever they want. Another thing we started testing last year with Savant was ways to start supplementing Statcast data into traditional box scores and scoreboards. Not trying to take away from the traditional box scores but there are things that we might be able to add to help out the user’s experiences. What we experimented with last year was adding pitch types like a simple pie chart that shows what pitches a pitcher used in a game. We toyed around with adding the hard hit with an emoji or something like that, so you could tell at a quick glance which pitchers are being hit in this game. We supplemented the scoreboard with adding average pitch velocities. We added win probability last season. You can pull up any game and it will tell you the win probability of any team. It will tell you who the leaders are for various Statcast metrics such as exit velocity, the WPA leaders, and it’ll show you fastest pitches of the game. We’re just trying to supplement the user experience. We’re testing all this out on Savant for the hope of maybe one day adding it to MLB.com.”
ON INFIELD OUTS ABOVE AVERAGE
- Bernard: “Earlier this year we were able to release our highly anticipated Infield Outs Above Average metric. As a testament to the entire community, we made strides in terms of defensive research. We started from non-contextual based events with putouts and assists and moved toward zone ratings with batted ball locations. The first iteration of UZR and DRS, which focused mostly on putting an average field location, to where we are today with Statcast putting in per play fielding location. With infield outs above average, we’re able to assign responsible fielders by their position and by their role. We’re able to access difficulty of the play on a per play basis based on the fielders starting position rather than average.”
ON STATCAST ERA
- Bernard: “As breaking news for our highly anticipated — two years of waiting, announced here at SABR Analytics back in 2018 — we are releasing Statcast ERA today. It is live. It currently live in the expected stats leaderboard for pitchers. As you can see, there are some very good names at the top. Emilio Pagán and Tyler Glasnow had seasons last year and deservedly so lead the leaderboard in xERA. The way we calculated that was we translated xwOBA to the ERA scale. It allows you to see how the pitcher ERA compares to expected value based on the batted ball profile.”
For more coverage of the 2020 SABR Analytics Conference, visit SABR.org/analytics/2020.
Transcription assistance by Nicholas Digrispino.
Originally published: March 13, 2020. Last Updated: November 4, 2020.