MLB’s annual salary leaders since 1874
Editor’s note: This article was first published in the Fall 2012 edition of “Outside The Lines,” SABR’s Business of Baseball Research Committee newsletter. The salary chart at the bottom has been updated since the original article was published.
Perusing the list of annual leaders in various statistical categories is a favorite pastime of baseball fans. So why should the list of salary leaders be any different? For fans of the business of baseball, that list is likely to prove fascinating. And now, thanks to the recent availability of new financial data, such a list is possible.
 The salary leaders data is drawn from several primary sources: the New York Yankee ledgers, the Philadelphia Phillies ledgers, the Spalding Guides, the MLBPA, the Long papers, and the contract and transaction card files housed at the Hall of Fame Library. When considering financial data, a primary source would be the originating source for those data, which in the case of a contract would be the two parties signing the contract: player and team. Thus, salary data that has been released each year since 1985 by the MLBPA is considered primary data. The MLBPA salary figures are available from a wide variety of sources on the internet.
Salary data since 1985 are certainly not scarce. It is salary data before this date that are hard to come by. Over the years numerous sources have reported player salaries, but in small quantities, and with little reliability. Most often the sources for these salary figures are unattributed, or another secondary source is cited. The reason for this proliferation of secondary source data has been the heretofore lack of reliable data. That scarcity has changed in recent years.
Over the past decade several sources of primary salary data have become available. The financial ledgers of the New York Yankees (Hall of Fame Library) and Philadelphia Phillies (Hagley Library) have provided researchers with salary data as well as information on every aspect of the finances of these two professional baseball teams for a limited time period. The Long papers (Hall of Fame Library) provide snapshots of the finances for a few years of Boston franchises in the 1870s, and the transaction cards at the Hall of Fame are an enormous collection of player contract data. These cards were compiled by the league offices for the period 1911-1987. All contracts between player and team must be approved by the league, and these files contain records of the approved contracts.
The Spalding Guide is the source for most of the available 19th century salary observations. While it is not data emanating from the players or owners per se, it was reported by the guide at a time when its publisher, Albert Spalding, was the owner of the Chicago franchise, thus it is reasonable to assume he had access to salary data. In addition, in those few instances where I have been able to obtain actual player contracts from this period, they confirm the salaries reported in the Spalding Guide.
The data in the salary leader chart below are all from one of these primary sources. No secondary source data were used to compile this list, which has resulted in a few years of missing observations. Though I have come across secondary references to salaries for some of the missing years, I do not use any of them because I have not been able to verify the source of those salary quotes.
(Click image to enlarge)
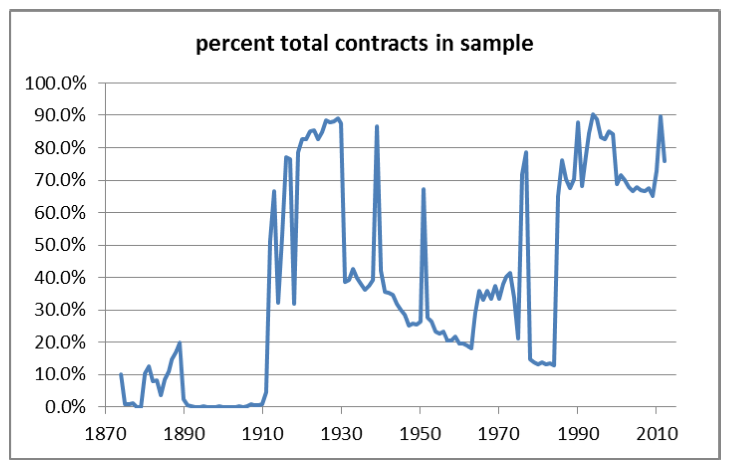
The salary observations I have gathered to date account for just under 50% of all of the players who have appeared in at least one MLB game since 1874. 50% is a substantial sample size, and yields quite reasonable figures for average salaries, but when attempting to build a list of annual salary leaders, the logical question is whether the missing observations are likely to have any salaries higher than those included in my list. Of course, there is no way I can know. This is especially problematic for those years for which I have only a handful of observations. The likelihood that I am missing the true maximum salary for any given year increases as the percentage of players for which I have observations decreases. The following graph illustrates the percentage of players for whom I have contracts each year.
A quick glance reveals that the distribution of contract observations is anything but constant, ranging from a low of zero percent for several years prior to 1906 up to 90.3% in 1994. In fifty of the years in the sample I have salary observations of more than 50% of the players, and for another 22 seasons I have more than one-third of the player contracts. All in all, the coverage since 1912 is very high, and since the sample includes every Hall of Famer who played after 1910, the likelihood of having the highest paid player in the sample set is biased somewhat upward. Still, there is the possibility that this list may be updated in the future, especially for the period before 1910, for which primary salary data is particularly scarce. The good news on this front is that I still have several thousand more observations that I have gathered, but not yet had time to add to the database. The size of the database will only grow over time, and with it the confidence in the accuracy of the annual salary leaders list.
In previous presentations and articles on player salaries I have encountered some issues concerning the definition of player earnings. Salary and earnings are not always the same thing. Salary here is defined simply. It is the contracted level of payment the team and the player agree upon. Only recently has the concept of guaranteed pay become commonplace in MLB contracts. During the era of the reserve clause the contracted salary was only guaranteed as long as the player remained with the team. The standard player contract had a ten day clause that gave the team the right to sell a player’s contract to another team, major or minor league, or simply void the contract, with the obligation of only ten days salary due to the player. Hence, the contracted salary and the actual salary earned by a player were only the same if the player remained on the roster the entire season.
Other issues driving a wedge between contracted salary and earned income included the presence of bonus clauses in some contracts and the imposition of fines by the team or suspensions by the league. Without access to team ledgers, for which we have only a small number of years, it is impossible to determine the actual amount paid to a player net of bonuses, fines, and suspensions. As a result, I only measure the contracted pay. That is, the annual pay due a player if he played the entire season. I do not subtract anything for fines (which are unknown in most cases) nor do I adjust for days on the roster for players sent to the minors. For this list of annual leaders, days on roster doesn’t really matter, since the players on this list were among the best in the league each year, and only missed time during the season if they were injured, not sent to the minors.
These salary figures do not contain bonus earnings either. While I do have the information on bonus clauses, I do not include it for two reasons. First of all, it is not always clear if it was earned. It is easy to determine if a player earned a performance bonus (e.g. $500 for hitting .300) but not if it was a “good effort” bonus ($500 if in the opinion of the manager the player gave his best effort). Besides, these are not salaries, but bonuses, only to be paid if some extraordinary circumstance were achieved. I only consider the contracted salary amount in this research.
 Having settled the boundaries of my definition of salary, let me make a few observations about the data. The first thing to notice is the impact of inflation, free agency, and television revenues on maximum salaries over time. In 1874 the highest paid player in major league baseball was Ross Barnes, who earned the princely sum of $2000. Today, the minimum salary for a MLB player is more than 200 times that level, and this season Alex Rodriguez earned more than $56,000 per plate appearance. If he saw 28 pitches during each trip to the plate, he would have earned as much per pitch as Barnes earned in an entire season.
Not to feel sorry for Ross Barnes though. In 1874 he was earning 2.3 times what the average American earned. And he earned it over just a few months working time, whereas the average American worked 60 hours a week for the entire year to bring in his $864.
Not surprisingly, the Yankees are the leaders when it comes to crowning earnings champs. Thirty four times since 1874 the Yankees have had the highest paid player in MLB on their roster, more than the next two franchises combined. And the franchise didn’t even exist until 1901! Two players account for 21 of those 34 salary leaders. Babe Ruth is the all-time salary leader champion with 13, followed by Alex Rodriguez, who has been the top salary earner 11 times – eight with the Yankees and three when he was a Ranger. Willie Mays is the only other player to have led the league in salary ten or more times. He ties A-Rod with eleven appearances atop the leaderboard.
Ruth also holds the records for dominance over time and over the rest of the league. He was the highest paid player in the game for 13 consecutive years, beginning with his $52,000 salary in 1922 and ending with $35,000 in 1934. Of course in between his salary ballooned to $70,000 and then $80,000. In 1930 his $80,000 was 2.4 times greater than the second highest salary earned that year (Rogers Hornsby), a record that has never been broken. In 2009 and 2010, when Rodriguez was earning the highest salary in MLB history ($33 million each year) he was earning barely 38% more than the second highest paid player (Manny Ramirez in 2009 and fellow Yankee C.C. Sabathia in 2010).
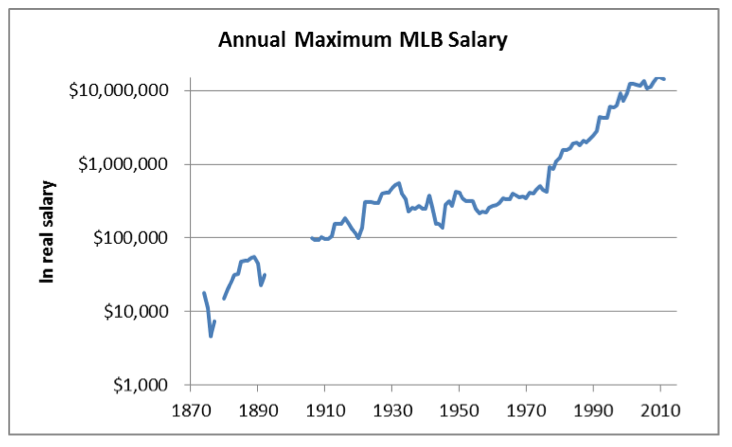
Salaries have skyrocketed in the past generation due first to the opening of the market with the end of the reserve clause, and then further with the glut of revenue from broadcast fees. The Angels signed Albert Pujols to a 10-year, $240 million contract prior to the 2012 season, an amount almost exactly equal to the value of the cable television package they had just negotiated. The growth of maximum salaries over time is illustrated in the graph below.
(Click image to enlarge)
This look at maximum salaries over time gives us a glimpse at the changing fortunes of baseball’s best players since the first days of professional baseball. It is not comprehensive, as data for the 19th century remains elusive, and some of the early leader figures are tenuous, given the paucity of data for some years, but it is instructive none-the-less. Over time we should be able to add to this list and increase our confidence in the names on it.
MLB Annual Salary Leaders since 1874
| Year | Salary | Player(s) |
|---|---|---|
| 1874 | $2,800 | Fergus Malone (Chi NA) |
| 1875 | $2,200 | Rich Higham (Chi NL) |
| 1876 | $4,000 | Al Spalding (Chi NL) |
| 1877 | $2,900 | Al Spalding (Chi NL) |
| 1878 | $3,700 | Bob Ferguson (Chi NL) |
| 1879 | $1,800 | Frank Flint (Chi NL) |
| 1880 | $1,800 | Adrian Anson (Chi NL) |
| 1881 | $2,000 | Jim O’Rourke (Buf NL) |
| 1882 | $2,400 | Monte Ward (Prov NL) |
| 1883 | $3,100 | Buck Ewing (NY NL) |
| 1884 | $3,100 | Buck Ewing (NY NL) |
| 1885 | $4,500 | Jim O’Rourke (NY NL) |
| 1886 | $4,500 | Fred Dunlap (StL/Det NL) |
| 1887 | $4,500 | Fred Dunlap (Det NL) |
| Charles Radbourne (Bos NL) | ||
| 1888 | $5,000 | Fred Dunlap (Pit NL) |
| Buck Ewing (NY NL) | ||
| 1889 | $5,000 | Fred Dunlap (Pit NL) |
| Buck Ewing (NY NL) | ||
| 1890 | $4,000 | Hardy Richardson (Bos PL) |
| 1891 | $2,000 | Paul Cook (Lou/StL AA) |
| 1892 | $2,800 | Joe Gunson (Bal NL) |
| 1893 | no data | |
| 1894 | no data | |
| 1895 | $2,400 | Jack Glasscock (Lou/Was NL) |
| 1896 | no data | |
| 1897 | no data | |
| 1898 | no data | |
| 1899 | $1,800 | Victor Willis (Bos NL) |
| 1900 | no data | |
| 1901 | no data | |
| 1902 | no data | |
| 1903 | no data | |
| 1904 | $5,000 | Joe McGinnity (NY NL) |
| 1905 | no data | |
| 1906 | $8,500 | Nap Lajoie (Cle AL) |
| 1907 | $8,500 | Nap Lajoie (Cle AL) |
| 1908 | $8,500 | Nap Lajoie (Cle AL) |
| 1909 | $9,000 | Nap Lajoie (Cle AL) |
| 1910 | $9,000 | Ty Cobb (Det AL) |
| Nap Lajoie (Cle AL) | ||
| 1911 | $9,000 | Ty Cobb (Det AL) |
| Nap Lajoie (Cle AL) | ||
| 1912 | $10,000 | Roger Bresnahan (StL NL) |
| Jimmy Callahan (Chi AL) | ||
| Hugh Jennings (Det AL) | ||
| Honus Wagner (Pit NL) | ||
| 1913 | $15,000 | Fred Clarke (Pit NL) |
| 1914 | $15,000 | Ty Cobb (Det AL) |
| Tris Speaker (Bos AL) | ||
| 1915 | $15,050 | Fred Clarke (Pit NL) |
| 1916 | $20,000 | Ty Cobb (Det AL) |
| 1917 | $20,000 | Ty Cobb (Det AL) |
| 1918 | $20,000 | Ty Cobb (Det AL) |
| 1919 | $20,000 | Ty Cobb (Det AL) |
| 1920 | $20,000 | Ty Cobb (Det AL) |
| Babe Ruth (NY AL) | ||
| Tris Speaker (Cle AL) | ||
| 1921 | $25,000 | Ty Cobb (Det AL) |
| 1922 | $52,000 | Babe Ruth (NY AL) |
| 1923 | $52,000 | Babe Ruth (NY AL) |
| 1924 | $52,000 | Babe Ruth (NY AL) |
| 1925 | $52,000 | Babe Ruth (NY AL) |
| 1926 | $52,000 | Babe Ruth (NY AL) |
| 1927 | $70,000 | Babe Ruth (NY AL) |
| 1928 | $70,000 | Babe Ruth (NY AL) |
| 1929 | $70,000 | Babe Ruth (NY AL) |
| 1930 | $80,000 | Babe Ruth (NY AL) |
| 1931 | $80,000 | Babe Ruth (NY AL) |
| 1932 | $75,000 | Babe Ruth (NY AL) |
| 1933 | $52,000 | Babe Ruth (NY AL) |
| 1934 | $35,000 | Babe Ruth (NY AL) |
| 1935 | $31,000 | Lou Gehrig (NY AL) |
| 1936 | $36,000 | Mickey Cochrane (Det AL) |
| 1937 | $36,000 | Mickey Cochrane (Det AL) |
| Lou Gehrig (NY AL) | ||
| 1938 | $39,000 | Lou Gehrig (NY AL) |
| 1939 | $35,000 | Lou Gehrig (NY AL) |
| Hank Greenberg (Det AL) | ||
| 1940 | $35,000 | Hank Greenberg (Det AL) |
| 1941 | $55,000 | Hank Greenberg (Det AL) |
| 1942 | $43,750 | Joe DiMaggio (NY AL) |
| 1943 | $27,000 | Joe Cronin (Bos AL) |
| 1944 | $27,000 | Joe Cronin (Bos AL) |
| 1945 | $25,000 | Lou Boudreau (Cle AL) |
| Joe Cronin (Bos AL) | ||
| 1946 | $55,000 | Hank Greenberg (Det AL) |
| 1947 | $70,000 | Hal Newhouser (Det AL) |
| 1948 | $65,000 | Joe DiMaggio (NY AL) |
| Ted Williams (Bos AL) | ||
| 1949 | $100,000 | Joe DiMaggio (NY AL) |
| 1950 | $100,000 | Joe DiMaggio (NY AL) |
| 1951 | $90,000 | Joe DiMaggio (NY AL) |
| Ted Williams (Bos AL) | ||
| 1952 | $85,000 | Ted Williams (Bos AL) |
| 1953 | $85,000 | Ted Williams (Bos AL) |
| 1954 | $85,000 | Ted Williams (Bos AL) |
| 1955 | $67,500 | Ted Williams (Bos AL) |
| 1956 | $58,000 | Yogi Berra (NY AL) |
| 1957 | $65,000 | Yogi Berra (NY AL) |
| 1958 | $65,000 | Mickey Mantle (NY AL) |
| 1959 | $75,000 | Willie Mays (SF NL) |
| 1960 | $80,000 | Willie Mays (SF NL) |
| 1961 | $85,000 | Willie Mays (SF NL) |
| 1962 | $90,000 | Mickey Mantle (NY AL) |
| Willie Mays (SF NL) | ||
| 1963 | $105,000 | Willie Mays (SF NL) |
| 1964 | $105,000 | Willie Mays (SF NL) |
| 1965 | $105,000 | Willie Mays (SF NL) |
| 1966 | $130,000 | Sandy Koufax (LA NL) |
| 1967 | $125,000 | Willie Mays (SF NL) |
| 1968 | $125,000 | Willie Mays (SF NL) |
| 1969 | $135,000 | Willie Mays (SF NL) |
| 1970 | $135,000 | Willie Mays (SF NL) |
| 1971 | $167,000 | Carl Yastrzemski (Bos AL) |
| 1972 | $167,000 | Carl Yastrzemski (Bos AL) |
| 1973 | $200,000 | Dick Allen (Chi AL) |
| 1974 | $250,000 | Dick Allen (Chi AL) |
| 1975 | $240,000 | Hank Aaron (Mil AL) |
| 1976 | $240,000 | Hank Aaron (Mil AL) |
| 1977 | $560,000 | Mike Schmidt (Ph NL) |
| 1978 | $560,000 | Mike Schmidt (Ph NL) |
| 1979 | $800,000 | Rod Carew (Cal AL) |
| 1980 | $1,000,000 | Nolan Ryan (Hou NL) |
| 1981 | $1,400,000 | Dave Winfield (NY AL) |
| 1982 | $1,500,000 | Mike Schmidt (Ph NL) |
| 1983 | $1,652,333 | Mike Schmidt (Ph NL) |
| 1984 | $1,989,875 | Mike Schmidt (Ph NL) |
| 1985 | $2,096,967 | Mike Schmidt (Ph NL) |
| 1986 | $1,964,423 | Jim Rice (Bos AL) |
| 1987 | $2,412,500 | Jim Rice (Bos AL) |
| 1988 | $2,340,000 | Ozzie Smith (StL NL) |
| 1989 | $2,766,667 | Orel Hershiser (LA NL) |
| Frank Viola (Min/NY AL/NL) | ||
| 1990 | $3,200,000 | Robin Yount (Mil AL) |
| 1991 | $3,800,000 | Darryl Stawberry (LA NL) |
| 1992 | $6,100,000 | Bobby Bonilla (NY NL) |
| 1993 | $6,200,000 | Bobby Bonilla (NY NL) |
| 1994 | $6,300,000 | Bobby Bonilla (NY NL) |
| 1995 | $9,237,500 | Cecil Fielder (Det AL) |
| 1996 | $9,237,500 | Cecil Fielder (Det AL) |
| 1997 | $10,000,000 | Albert Belle (Chi AL) |
| 1998 | $14,936,667 | Gary Sheffield (Fla/LA NL) |
| 1999 | $11,949,794 | Albert Belle (Bal AL) |
| 2000 | $15,714,286 | Kevin Brown (LA NL) |
| 2001 | $22,000,000 | Alex Rodriguez (Tex AL) |
| 2002 | $22,000,000 | Alex Rodriguez (Tex AL) |
| 2003 | $22,000,000 | Alex Rodriguez (Tex AL) |
| 2004 | $21,726,881 | Alex Rodriguez (NY AL) |
| 2005 | $26,000,000 | Alex Rodriguez (NY AL) |
| 2006 | $21,680,727 | Alex Rodriguez (NY AL) |
| 2007 | $23,428,571 | Jason Giambi (NY AL) |
| 2008 | $28,000,000 | Alex Rodriguez (NY AL) |
| 2009 | $33,000,000 | Alex Rodriguez (NY AL) |
| 2010 | $33,000,000 | Alex Rodriguez (NY AL) |
| 2011 | $32,000,000 | Alex Rodriguez (NY AL) |
| 2012 | $30,000,000 | Alex Rodriguez (NY AL) |
| 2013 | $29,000,000 | Alex Rodriguez (NY AL) |
| 2014 | $28,000,000 | Zack Greinke (LA NL) |
| 2015 | $31,000,000 | Clayton Kershaw (LA NL) |
| 2016 | $33,000,000 | Clayton Kershaw (LA NL) |
| 2017 | $33,000,000 | Clayton Kershaw (LA NL) |
| 2018 | $34,083,333 | Mike Trout (LA AL) |
| 2019 | $38,333,333 | Stephen Strasburg (Was NL) |
MICHAEL HAUPERT is Professor of Economics at the University of Wisconsin–La Crosse. He is fortunate to be able to combine his work with his love of baseball. He is unfortunate to be a lifelong Cubs fan.
- Read more: “Baseball’s major salary milestones,” by Michael Haupert (Fall 2011 Baseball Research Journal)


