

The Chances of a Drafted Baseball Player Making the Major Leagues: A Quantitative Study
This article was written by Richard T. Karcher
This article was published in Spring 2017 Baseball Research Journal
In June of each year, Major League Baseball conducts its amateur draft. The purpose of this study is to determine a drafted baseball player’s chances of making the major leagues based upon the round a player is drafted, age when drafted and signed, and position. Historical data were compiled for all players drafted and signed through the twentieth round from 1996 through 2011.
INTRODUCTION
In June of each year, Major League Baseball conducts its amateur draft (known as the “First-Year Player Draft” or the “Rule 4 Draft”). The MLB amateur draft, which was first held in 1965, consists of forty rounds (under the current collective bargaining agreement) plus the supplemental rounds for compensatory picks earned by teams based on departing free agents who reject qualifying offers, plus competitive balance picks. In general, the following players are eligible to be drafted and sign a professional contract: (i) high school players who have graduated and have not attended college, (ii) four-year college players three years after first enrolling at the institution, or after their twenty-first birthdays (whichever occurs first), and (iii) junior college players at any time.
The purpose of this study is to determine a drafted baseball player’s chances of making the major leagues based upon the round a player is drafted, age when drafted and signed (high school or college player), and position (pitcher or other position player). Historical data were compiled for all players drafted and signed through the twentieth round from 1996 through 2011. In each round for the 16 drafts combined, calculations were made to determine the sum and percentage of signed high school pitchers, high school position players, college pitchers, and college position players who made it to the major leagues and who played in the major leagues more than three years. Players drafted after 2011 were not included within this study in order to give all drafted and signed players an ample opportunity to reach the major leagues.1 Allan Simpson conducted a similar study on players drafted and signed from 1965 to 1995 based solely on the round a player is drafted (not categorized by the four player groupings used in this study).2 The results of this study are compared against the results of Simpson’s study to identify evolving draft patterns and trends.
The results of this study can assist scouts and front office personnel concerning appropriate allocation of resources in the acquisition of talent through the draft, as well as agents and coaches when giving career advice to players and their parents. However, a few limitations should be noted. Because this study entails descriptive (as opposed to explanatory) research, the data analyses do not proffer explanations for why the results are what they are. This study therefore provides empirical evidence for future explanatory research. It should also be noted that the results of this study do not take into account either the number of years it takes for players to make it to the major leagues (based on round, age, or position) nor the kind of impact the players will have when they make the major leagues (based on round, age, or position).3
METHOD
Historical data for this study were collected from two Internet sources, The Baseball Cube and Baseball-Reference.com.4,5 A master spreadsheet was created with separate tabs for each draft year from 1996 to 2011. For each round in each draft year, four separate player categories were created: high school pitchers, high school position players, college pitchers, and college position players.6 The data collection process first entailed searching the draft database on The Baseball Cube, round by round, each year from 1996 to 2011. For each round in a particular draft year, The Baseball Cube database provided data on the drafted players who signed in that round and whether they were high school pitchers, high school position players, college pitchers, or college position players. The number of players drafted and signed in that round, with respect to each of the four categories, was recorded in the master spreadsheet. The Baseball Cube also provided the drafted players in that round who played in the major leagues (for any length of time), and this number was also recorded in the spreadsheet, for each of the four categories. Then, for each player in that round who played in the major leagues, Baseball Reference was used to determine the number of years that the player played in the major leagues, and the number of players in that round who played in the major leagues more than three years was recorded in the spreadsheet, for each of the four categories. This process was repeated for each round for each draft year from 1996 to 2011. For purposes of this study, “played in the major leagues” means a player had at least one appearance or at-bat prior to August 1, 2016, and “played in the major leagues more than three years” means a player had at least one appearance or at-bat in more than three seasons. “More than three seasons” was used as the criterion because, once a player is added to the 40-man roster, he is typically eligible for optional assignment to the minor leagues in three different seasons.7
For rounds 1-5, calculations were made to determine for each round for the 16 drafts combined: (1) the sum and percentage of players drafted, proportioned by player category; (2) the sum and percentage of drafted players who signed, proportioned by player category; (3) of all players signed, the sum and percentage of players who played in the major leagues, proportioned by player category; and (4) of all players signed, the sum and percentage of players who played in the major leagues more than three years, proportioned by player category. For rounds 6-10, the same calculations were made but uncategorized. Rounds 11-15 were combined and rounds 16-20 were combined, and the same calculations were made uncategorized for each of the two cohorts.
RESULTS
Tables 1 through 12 set forth the sum and percentage totals by round (1-10) and combined rounds (11-15 and 16-20):
Table 1: First Round and Supplemental First
| Number | Percent | |
|---|---|---|
| Players drafted | 745 | —- |
| High school pitchers | 172 | 23.1 |
| High school position players |
184 | 24.7 |
| College pitchers | 231 | 31.0 |
| College position players | 158 | 21.2 |
| Players signed | 724 | 97.2 |
| High school pitchers | 162 | 21.7 |
| High school position players |
180 | 24.2 |
| College pitchers | 226 | 30.3 |
| College position players | 156 | 20.9 |
| Played in the major leagues |
483 | 66.7 (of players signed) |
| High school pitchers | 97 | 13.4 |
| High school position players |
102 | 14.1 |
| College pitchers | 162 | 22.4 |
| College position players | 122 | 16.9 |
| Played in the majors 3+ yrs |
339 | 46.8 (of players signed) |
| High school pitchers | 55 | 7.6 |
| High school position players |
76 | 10.5 |
| College pitchers | 113 | 15.6 |
| College position players | 95 | 13.1 |
Table 2: Second Round and Supplemental Second
| Number | Percent | |
|---|---|---|
| Players drafted | 496 | —- |
| High school pitchers | 120 | 24.2 |
| High school position players |
136 | 27.4 |
| College pitchers | 134 | 27.0 |
| College position players | 106 | 21.4 |
| Players signed | 470 | 94.8 |
| High school pitchers | 113 | 22.8 |
| High school position players |
125 | 25.2 |
| College pitchers | 128 | 25.8 |
| College position players | 104 | 21.0 |
| Played in the major leagues |
232 | 49.4 (of players signed) |
| High school pitchers | 52 | 11.1 |
| High school position players |
43 | 9.1 |
| College pitchers | 67 | 14.3 |
| College position players | 70 | 14.9 |
| Played in the majors 3+ yrs |
148 | 31.5 (of players signed) |
| High school pitchers | 26 | 5.5 |
| High school position players |
32 | 6.8 |
| College pitchers | 44 | 9.4 |
| College position players | 46 | 9.8 |
Table 3: Third Round and Supplemental Third
| Number | Percent | |
|---|---|---|
| Players drafted | 490 | —- |
| High school pitchers | 94 | 19.2 |
| High school position players |
119 | 24.3 |
| College pitchers | 142 | 29.0 |
| College position players | 135 | 27.5 |
| Players signed | 458 | 93.5 |
| High school pitchers | 80 | 16.3 |
| High school position players |
108 | 22.0 |
| College pitchers | 136 | 27.8 |
| College position players | 134 | 27.3 |
| Played in the major leagues |
182 | 39.7 (of players signed) |
| High school pitchers | 33 | 7.2 |
| High school position players |
34 | 7.4 |
| College pitchers | 57 | 12.4 |
| College position players | 58 | 12.7 |
| Played in the majors 3+ yrs |
99 | 21.6 (of players signed) |
| High school pitchers | 20 | 4.4 |
| High school position players |
19 | 4.1 |
| College pitchers | 25 | 5.5 |
| College position players | 35 | 7.6 |
Table 4: Fourth Round
| Number | Percent | |
|---|---|---|
| Players drafted | 480 | —- |
| High school pitchers | 98 | 20.4 |
| High school position players |
101 | 21.0 |
| College pitchers | 161 | 33.5 |
| College position players | 120 | 25.0 |
| Players signed | 446 | 92.9 |
| High school pitchers | 88 | 18.3 |
| High school position players |
90 | 18.8 |
| College pitchers | 155 | 32.3 |
| College position players | 113 | 23.5 |
| Played in the major leagues |
156 | 35.0 (of players signed) |
| High school pitchers | 28 | 6.3 |
| High school position players |
27 | 6.1 |
| College pitchers | 54 | 12.1 |
| College position players | 47 | 10.5 |
| Played in the majors 3+ yrs |
83 | 18.6 (of players signed) |
| High school pitchers | 18 | 4.0 |
| High school position players |
13 | 2.9 |
| College pitchers | 27 | 6.1 |
| College position players | 25 | 5.6 |
Table 5: Fifth Round
| Number | Percent | |
|---|---|---|
| Players drafted | 480 | —- |
| High school pitchers | 78 | 16.3 |
| High school position players |
91 | 19.0 |
| College pitchers | 169 | 35.2 |
| College position players | 142 | 29.6 |
| Players signed | 442 | 92.1 |
| High school pitchers | 62 | 12.9 |
| High school position players |
75 | 15.6 |
| College pitchers | 165 | 34.4 |
| College position players | 140 | 29.2 |
| Played in the major leagues |
147 | 33.3 (of players signed) |
| High school pitchers | 24 | 5.4 |
| High school position players |
20 | 4.5 |
| College pitchers | 50 | 11.3 |
| College position players | 53 | 12.0 |
| Played in the majors 3+ yrs |
82 | 18.6 (of players signed) |
| High school pitchers | 13 | 2.9 |
| High school position players |
8 | 1.8 |
| College pitchers | 28 | 6.3 |
| College position players | 33 | 7.5 |
Table 6: Sixth Round
| Number | Percent | |
|---|---|---|
| Players drafted | 480 | —- |
| Players signed | 443 | 92.3 |
| Played in the major leagues |
108 | 24.4 (of players signed) |
| Played in the majors 3+ years |
47 | 10.6 (of players signed) |
Table 7: Seventh Round
| Number | Percent | |
|---|---|---|
| Players drafted | 480 | —- |
| Players signed | 445 | 92.7 |
| Played in the major leagues |
91 | 20.4 (of players signed) |
| Played in the majors 3+ years |
40 | 9.0 (of players signed) |
Table 8: Eighth Round
| Number | Percent | |
|---|---|---|
| Players drafted | 480 | —- |
| Players signed | 443 | 92.3 |
| Played in the major leagues |
108 | 24.4 (of players signed) |
| Played in the majors 3+ years |
47 | 10.6 (of players signed) |
Table 9: Ninth Round
| Number | Percent | |
|---|---|---|
| Players drafted | 480 | —- |
| Players signed | 437 | 91.0 |
| Played in the major leagues |
78 | 17.8 (of players signed) |
| Played in the majors 3+ years |
34 | 7.8 (of players signed) |
Table 10: Tenth Round
| Number | Percent | |
|---|---|---|
| Players drafted | 480 | —- |
| Players signed | 422 | 87.9 |
| Played in the major leagues |
74 | 17.5 (of players signed) |
| Played in the majors 3+ years |
35 | 8.3 (of players signed) |
Table 11: 11th-15th Rounds
| Number | Percent | |
|---|---|---|
| Players drafted | 2,400 | —- |
| Players signed | 2,066 | 86.1 |
| Played in the major leagues |
262 | 12.7 (of players signed) |
| Played in the majors 3+ years |
108 | 5.2 (of players signed) |
Table 12: 12th-20th Rounds
| Number | Percent | |
|---|---|---|
| Players drafted | 2,400 | —- |
| Players signed | 1,958 | 81.6 |
| Played in the major leagues |
194 | 9.9 (of players signed) |
| Played in the majors 3+ years |
86 | 4.4 (of players signed) |
DATA ANALYSES
- Figure 1 shows that a higher percentage of drafted players in all rounds signed from 1996 to 2011 than from 1965 to 1995. In Simpson’s study of drafted players from 1965 to 1995, the percentages of players who signed were 95.8% in the first round, 89.4% in the second round, 86% in the third round, 84.1% in the fourth round, 81.3% in the fifth round, 76.1% in rounds 6-10 combined, 70.7% in rounds 11-15 combined, and 65.8% in rounds 16-20 combined. In this study of drafted players from 1996 to 2011, the percentages of players who signed in those rounds were 97.2%, 94.8%, 93.5%, 92.9%, 92.1%, 91.25%, 86.1%, and 81.6%, respectively.
Figure 1. Comparison of Percentage of Players Who Signed Between 1965–95 and 1996–2011

(Click image to enlarge) - In each of the first five rounds, more college players sign in proportion to high school players. Figure 2 compares the percentage of drafted players in each cohort who signed in each round from 1996 to 2011.
Figure 2. Percentage Who Signed in First Five Rounds from 1996–2011
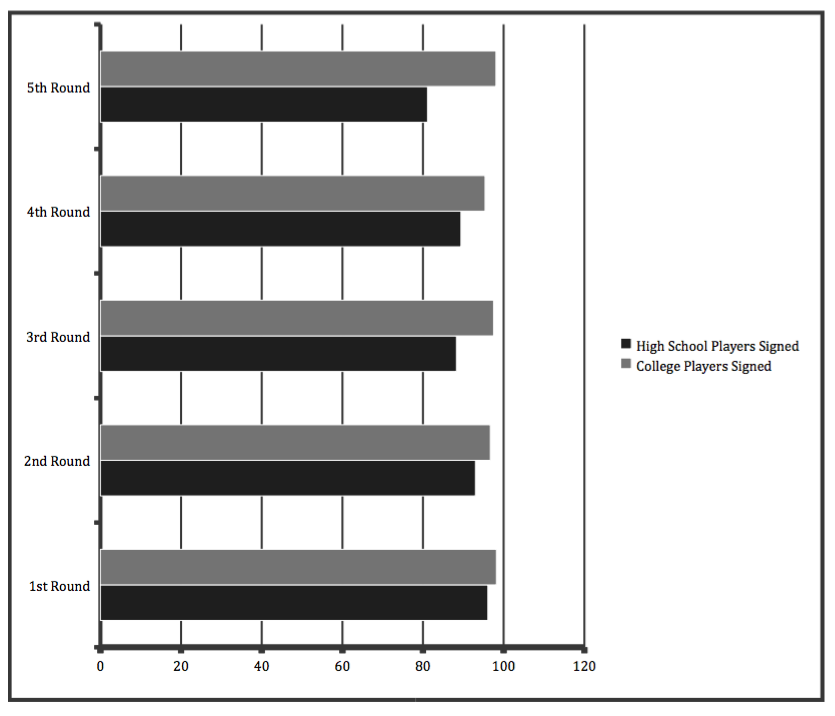
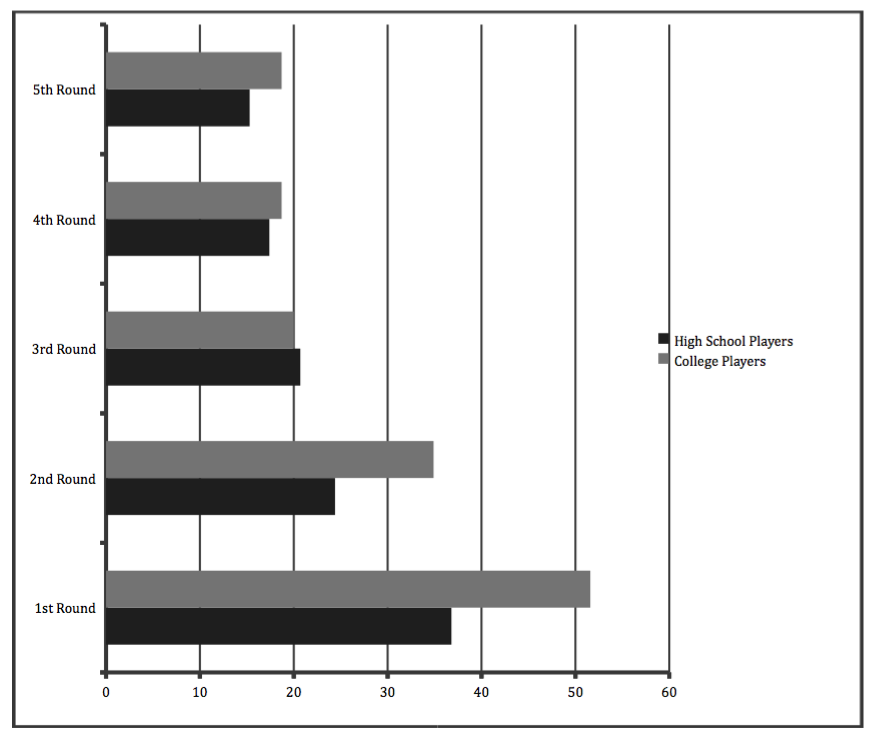
(Click image to enlarge) - College players drafted in the first five rounds had a greater chance of both playing in the major leagues and playing in the major leagues more than three years than high school players, with the greatest percentage difference in the first and second rounds. This is partly due to the fact that a higher percentage of drafted college players sign in proportion to drafted high school players (as explained in No. 2 above), which results in college players making up a much higher percentage of all players signed who make it to the major leagues (as reflected in the results section above). But even when separate percentage calculations are made within each cohort, a greater percentage of college players than high school players played in the major leagues and (with the exception of the third round) played in the major leagues more than three years. Figure 3.1 compares the percentage of signed college players and signed high school players in each of the first five rounds from 1996 to 2011 who played in the major leagues, and Figure 3.2 compares the percentage of those who played in the major leagues more than three years. Because high school players drafted in 2010 and 2011 were much less likely (due to their age) than college players drafted in 2010 and 2011 to have played in the major leagues more than three years as of August 1, 2016, players drafted in 2010 and 2011 (although included in the results section as having played in the major leagues more than three years) were not counted in the calculations in Figure 3.2.
Figure 3.1. Percentage Who Played in Major Leagues in First Five Rounds from 1996–2011

(Click image to enlarge)Figure 3.2. Percentage Who Played in Majors 3+ Years in First Five Rounds from 1996–2011
(Click image to enlarge) - College pitchers are the most drafted players in the first five rounds; they made up 31.1% of all players drafted in rounds 1-5 combined from 1996 to 2011. However, their chances of making it to the major leagues, and playing more than three years, were not as good as college position players drafted in the first five rounds. Signed college position players had a 6-7% greater chance than signed college pitchers: 350 of the 647 position players (54.1%) compared to 390 of the 810 pitchers (48.1%) played in the major leagues, and 234 of the 647 position players (36.2%) compared to 237 of the 810 pitchers (29.3%) played in the major leagues more than three years.
- Players drafted in the first three rounds from 1996 to 2011 had close to the same chance of making the major leagues, and playing for a few years, as the players who were drafted in the same round from 1965 to 1995. Compared against the results of Simpson’s study, there was a differential in the range of ±0-4% with respect to the percentage of signed players drafted in those rounds who played in the major leagues and who played in the major leagues more than three years.
a. Of the signed players drafted in the first round from 1996 to 2011, 66.7% played in the major leagues (compared to 67.0% from 1965-95) and 46.8% played in the major leagues more than three years (compared to 49.5% from 1965-95).
b. Of the signed players drafted in the second round from 1996 to 2011, 49.4% played in the major leagues (compared to 46.5% from 1965-95) and 31.5% played in the major leagues more than three years (compared to 28.8% from 1965-95).
c. Of the signed players drafted in the third round from 1996 to 2011, 39.7% played in the major leagues (compared to 36.2% from 1965-95) and 21.6% played in the major leagues more than three years (compared to 23.9% from 1965-95). - However, players drafted in the fourth and fifth rounds from 1996 to 2011 had a significantly greater chance of making the major leagues, and playing for a few years, than the players who were drafted in the same round from 1965 to 1995.
a. Of the signed players drafted in the fourth round from 1996 to 2011, 35% played in the major leagues (compared to 28.3% from 1965-95) and 18.6% played in the major leagues more than three years (compared to 17.3% from 1965-95).
b. Of the signed players drafted in the fifth round from 1996 to 2011, 33.3% played in the major leagues (compared to 28.5% from 1965-95) and 18.6% played in the major leagues more than three years (compared to 14.8% from 1965-95). - Players drafted and signed beyond the first five rounds from 1996 to 2011 had the same chances of playing in the major leagues as the players drafted and signed in the same round from 1965 to 1995 (a differential in the range of ±0-1%).
a. In rounds 6-10 combined from 1996 to 2011, 20% played in the major leagues (compared to 20.4% from 1965-95).
b. In rounds 11-15 combined from 1996 to 2011, 12.7% played in the major leagues (compared to 12.1% from 1965-958).
c. In rounds 16-20 combined from 1996 to 2011, 9.9% played in the major leagues (compared to 9.8% from 1965-95). - However, players drafted and signed beyond the first five rounds from 1996 to 2011 had a slightly lesser chance of playing in the major leagues more than three years than the players drafted and signed in the same round from 1965 to 1995 (a differential in the range of -(minus) .9%-2.4%). The percentage of players in the three cohorts from 1996 to 2011 who played in the major leagues more than three years was 9% for rounds 6-10 combined (compared to 11.4% from 1965-95), 5.2% for rounds 11-15 combined (compared to 6.1% from 1965-95), and 4.4% for rounds 16-20 combined (compared to 5.6% from 1965-95).
CONCLUSION
The overall takeaway from this study is that, in the top five rounds, generally college players are much more valuable picks than high school players and college position players are more valuable than college pitchers. In the top five rounds, college players not only have a greater chance than high school players of making the major leagues and playing in the major leagues more than three years, but also more college players sign in proportion to high school players.
RICHARD T. KARCHER is a sport management professor at Eastern Michigan University where he teaches sport governance and regulation, sport ethics, NCAA compliance, and introduction to research in sport management. Karcher has provided expert testimony in numerous lawsuits on the lost earning capacity damages of amateur and professional baseball players. He serves on the editorial board for the “Journal of Legal Aspects of Sport.” Karcher also played three seasons in the Atlanta Braves farm system and is a lifetime member of the Association of Professional Ball Players of America.
Acknowledgments
I want to especially thank my research assistant, Joseph Barroso Jr., for his countless hours and attention to detail collecting the necessary data to make this study possible.
Notes
1 There were no revisions to the collective bargaining agreement during the time period covered by this study that would have any significant impact on the results. All players drafted and signed during the time period covered by this study were not subject to the revised collective bargaining agreement that brought significant changes to the draft in 2012. Starting with the 2012 draft, each team is allocated a “bonus pool” which establishes an amount it can spend in the aggregate on players drafted in the first ten rounds and a team is penalized if it goes over its threshold.
2 Allan Simpson, “Will he play in the big leagues?,” Baseball America, 2002, http://www.baseballamerica.com/online/draft/chances051002.html.
3 In a 2011 study on players drafted since 1965, Rany Jazayerli concluded that “very young players” (defined as those who are younger than 17 years and 296 days on draft day) return more value than expected by their draft slots. The study categorized draftees into five distinctive groups based on their age and being drafted in the early rounds. See Jazayerli, Rany, “Doctoring The Numbers Starting Them Young, Part One,” Baseball Prospectus, October 13, 2011, http://www.baseballprospectus.com/article.php?articleid=15295. See also Jazayerli, Rany, “Doctoring The Numbers Starting Them Young, Part Two,” Baseball Prospectus, October 14, 2011, http://www.baseballprospectus.com/article.php?articleid=15306.
4 www.thebaseballcube.com.
5 www.baseball-reference.com.
6 The two college player categories include junior college players.
7 See Major League Rule (MLR) 11.
8 N.B. the Baseball America study incorrectly calculated 333 out of 2,749 (12.1%) as 8.3%.