

The Growth of ‘Three True Outcomes’: From Usenet Joke to Baseball Flashpoint
This article was written by David Firstman
This article was published in Spring 2018 Baseball Research Journal
This article was selected for inclusion in SABR 50 at 50: The Society for American Baseball Research’s Fifty Most Essential Contributions to the Game.
 It all started as a lark. Back in the mid-1990s, during the Internet’s infancy, Usenet bulletin boards were the virtual water coolers we all gathered around to discuss our favorite topics. Over on the rec.sport.baseball board, Christina Kahrl and a bunch of like-minded individuals were marveling over the statistical quirks of Rob Deer. Deer had the unusual ability to not put the ball in play. At a time when about a-quarter of all plate appearances ended in a walk, home run, or strikeout, Deer managed that outcome nearly half the time.1
The members of the Usenet board organized a “Rob Deer Fan Club” and, as Kahrl says:
We basically trolled people over how this was a guy playing the game the right way, because he was generating runs and avoiding double plays. I wrote a silly Conan/Robert E. Howard sort of backstory about how “The Deer” was inspired by the “ur-Deer” (Gorman Thomas, of course), and since we were already steeping it in our semi-ridiculous absolute faith in our hero, I referred to his delivering “the Three True Outcomes.2
Baseball Prospectus was the first major website to note the Three True Outcomes (TTO). In August 2000 on that site, Rany Jazayerli whimsically proclaimed:
The Revolution that will spread the Gospel of the Three True Outcomes to every man, woman and child on Earth.
What are the Three True Outcomes, you ask? They are:
- The Home Run, the weapon with which we fight the evil legions of Little Ball.
- The Strikeout, a symbol of our refusal to compromise.
- The Base on Balls, which brings balance to our cause.
Together, the Three True Outcomes distill the game to its essence, the battle of pitcher against hitter, free from the distractions of the defense, the distortion of foot speed or the corruption of managerial tactics like the bunt and his wicked brother, the hit-and-run.3
The next year, TTO got a further boost in prominence and an actual air of legitimacy when BP’s Voros McCracken wrote about seeking to determine what impact fielding had on pitching. His work referenced aspects of TTO, as components that the fielders had no control over:
The first thing I did was create something called “Defense Independent Pitching Stats.” DIPS are the representation of a pitcher’s stat line without any possible influence from the defense behind the pitcher. I calculated the various rates for walks, strikeouts, home runs, hit batsmen, etc. as a function of batters faced, and inserted them into the pitcher’s line.4
In the following years, BP’s Keith Woolner reported on the annual leaders in TTO percentage and noted when a player broke the record for highest percentage in a season. In 2004, Woolner introduced an update to those calculations, normalizing individual player rates based on major league averages.5
With each passing year, additional baseball websites dipped their toes into the TTO waters, reporting on the yearly leaders and/or trailers (most times without normalization to major league average for that season). This author applied TTO analysis on the team level in a post to her own baseball blog in 2012, providing a look at the teams from 1973 through 2011 with the highest and lowest TTO percentages relative to major league average. In so doing, it was discovered that a team’s TTO rate had very little impact on its overall record. There had been winning and losing teams on both sides of the TTO spectrum.6
In August 2017, during a season in which the TTO rate in the majors would ultimately hit a record 33.5 percent, Michael Baumann of the Ringer offered up an immersive run-through of TTO’s ever-increasing footprint on the game. The article was ominously titled “The End of Baseball As We Know It” and it proclaimed: “With the march of three true outcomes — walks, strikeouts, and home runs — the sport has been pushed to its efficient extreme. MLB has undergone a quiet revolution without anyone stopping to ask the question: Is this what we really want?” Baumann placed the TTO explosion within the context of the steroid era, the increasing height and weight of players, and the increasing velocity of pitchers.7
In this paper TTO growth will be examined and possible explanations for the upward trend will be presented.
HISTORICAL GROWTH IN TTO CATEGORIES
Babe Ruth set an incredible standard as a TTO leader during his career, compiling the ten highest all-time TTO rates relative to major league average, as shown in Table 1. For example, in 1920 the big-league TTO rate was 15.5 percent. Ruth’s 46.1 figure nearly tripled that, and the nine other marks were also at least double the standard for the corresponding season.
Table 1: Top Ten TTO Percentage Differences (all by Babe Ruth), By Season
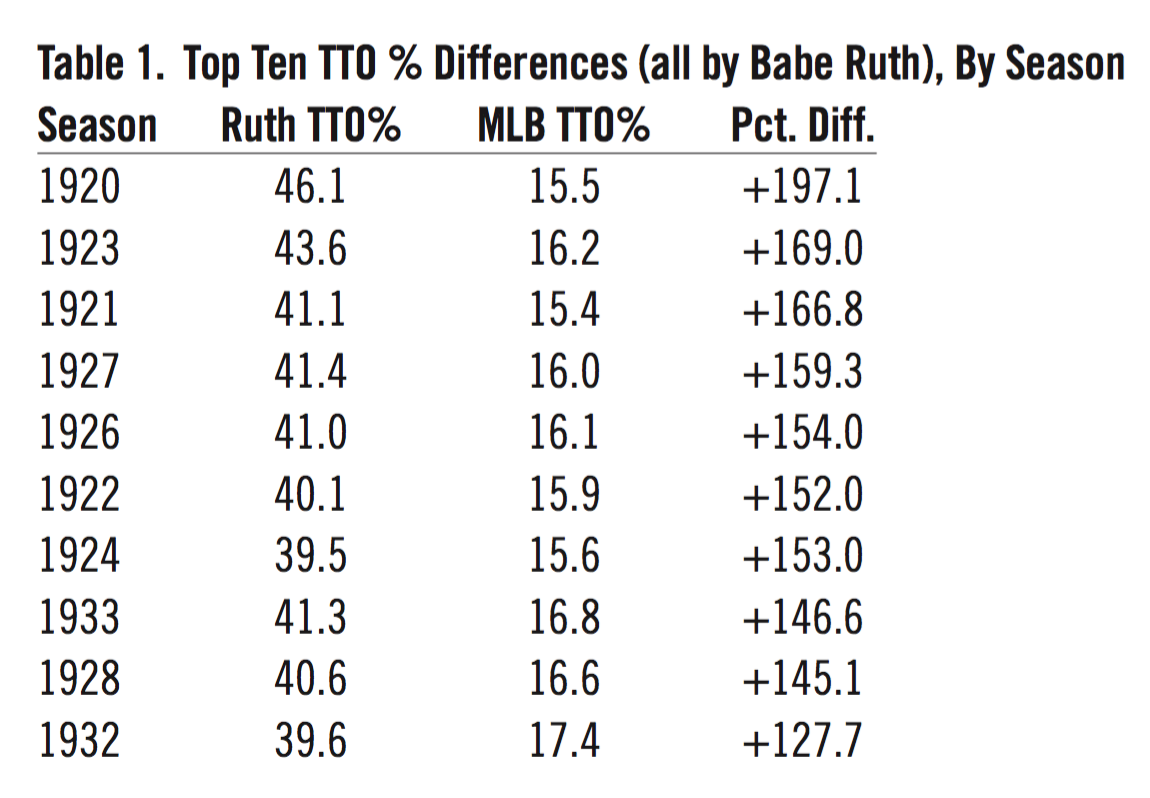
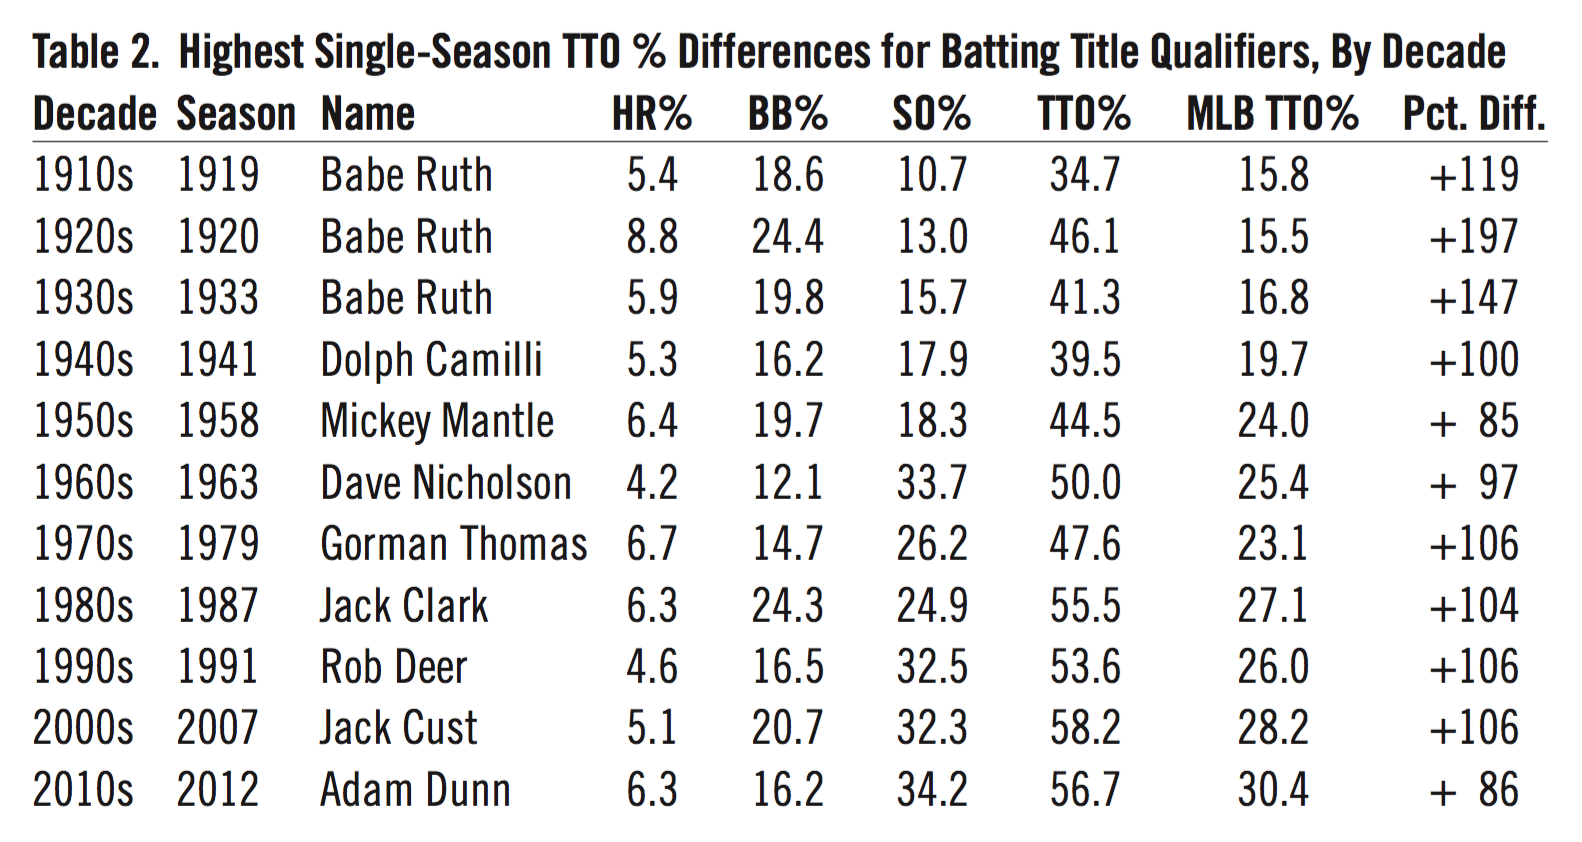
Table 2 shows the highest single-season TTO percentage difference for each decade. Ruth of course dominates the list, and we see the aforementioned Deer and Thomas. Dave Nicholson set a then-major league record with 175 strikeouts in 1963 as a part of his TTO stats.
Table 2: Highest Single-Season TTO Percentage Differences for Batting Title Qualifiers, By Decade
(Click image to enlarge.)
As shown in Figure 1 below, Three True Outcomes made up no more than 20 percent of all plate appearances from 1913 through 1945. The one-quarter threshold was broken in 1961, and the 30 percent mark was eclipsed for the first time in 2012. The rate jumped considerably in each of the last three seasons, from 30.3 percent to 30.7 percent in 2015, 32.3 percent in 2016, and finally the record of 33.5 percent this past year.
Figure 1: MLB Three True Outcome Percentage, 1913-2017
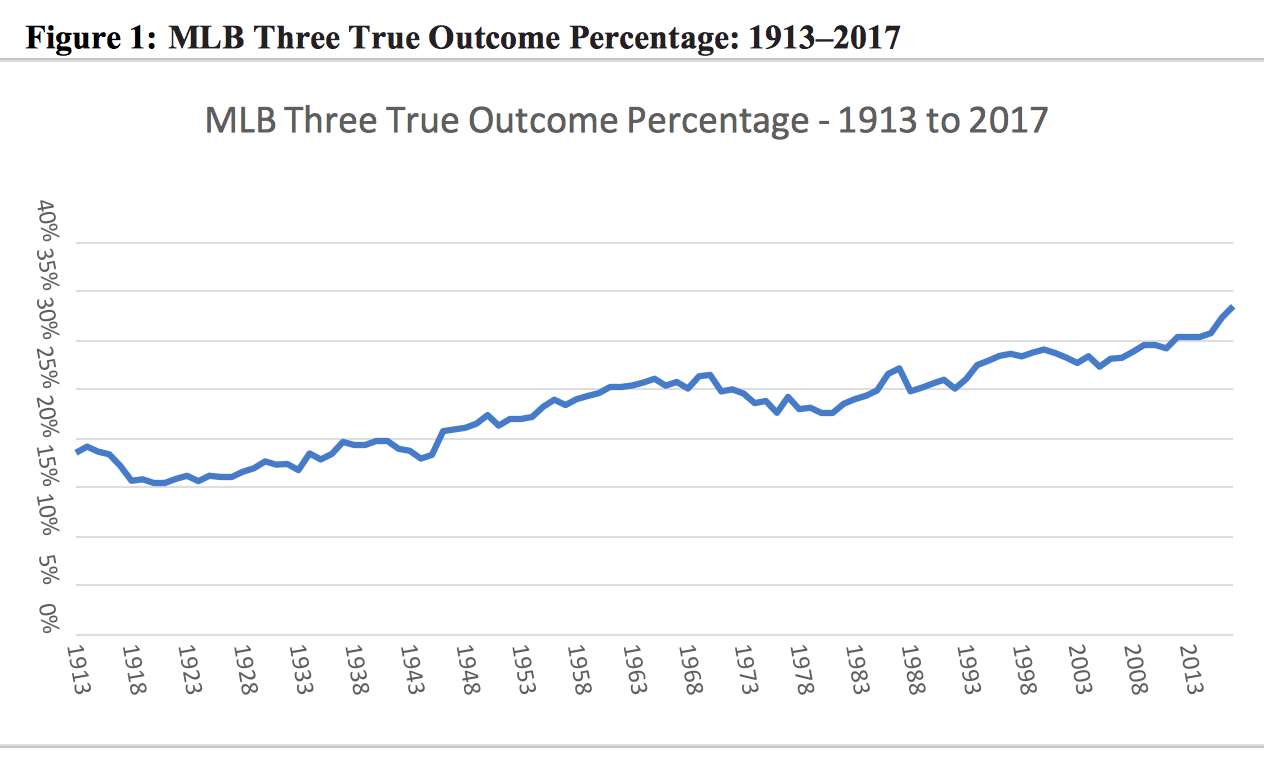
Three True Outcome rates have been rising steadily, especially in the last 25 years.
Walk rates have remained relatively static over time, and while home run rates did hit a record 3.3 percent of plate appearances in 2017.8 They remain the smallest component of TTO. Figure 2 shows the rapid increase in strikeout rate across the majors, especially since the early 1990s. It is the increase in strikeouts that is driving the TTO explosion.
Figure 2: MLB Homer, Walk and Strikeout Rates, 1913-2017
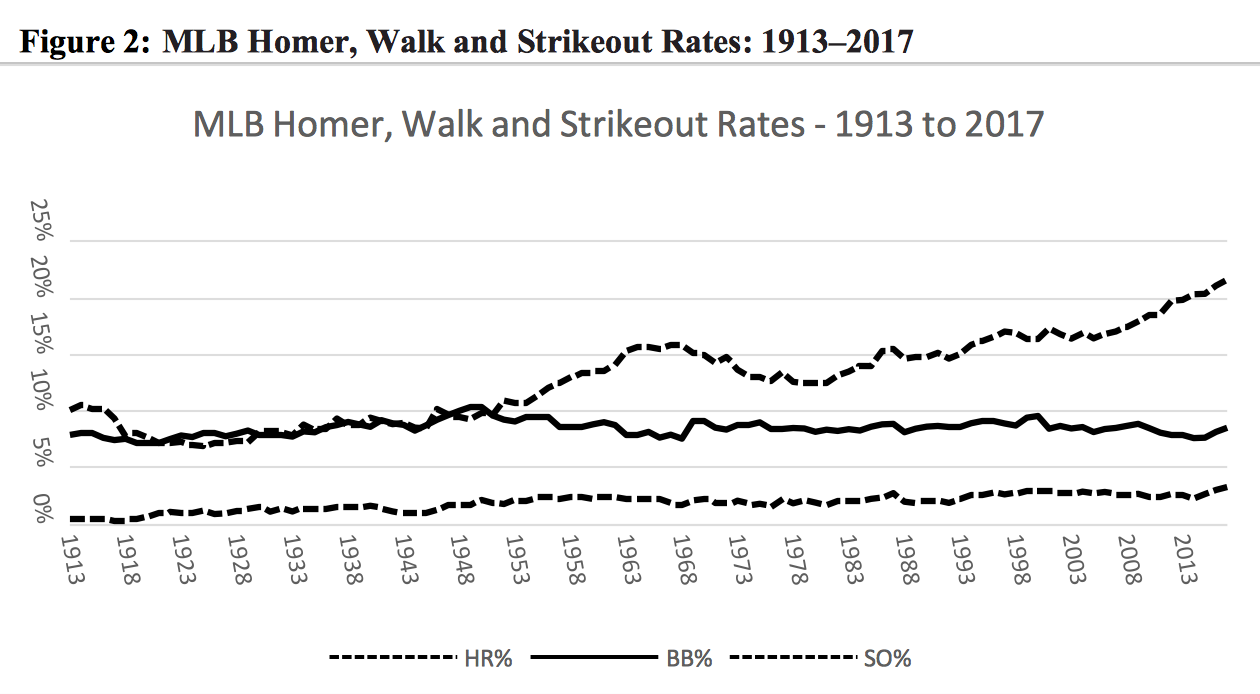
Strikeout-rate growth has outpaced the other two components in the Three True Outcomes, especially since the early 1990s.
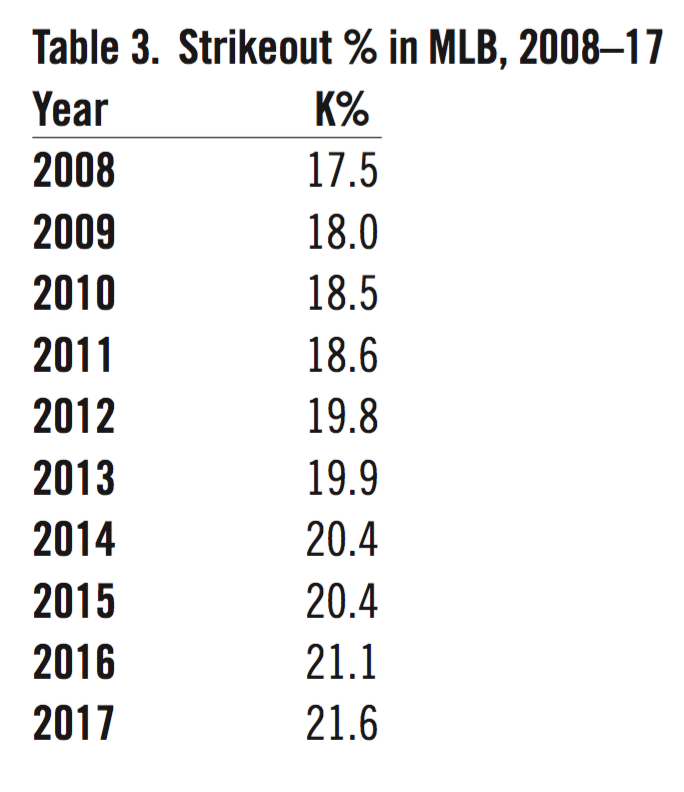
Major league baseball set a record with 21.6 percent of all plate appearances ending in a strikeout in 2017, and as Table 3 shows, the last ten years have seen a nearly 25 percent increase in the overall strikeout rate.
Table 3: Strikeout Percentage in MLB, 2008-2017
REASONS FOR TTO GROWTH
With strikeouts being the largest component of TTO, it would make sense to examine the reasons for the increasing strikeout (and therefore TTO) rate. There are five main reasons:
REASON 1: MARCH OF THE RELIEVERS
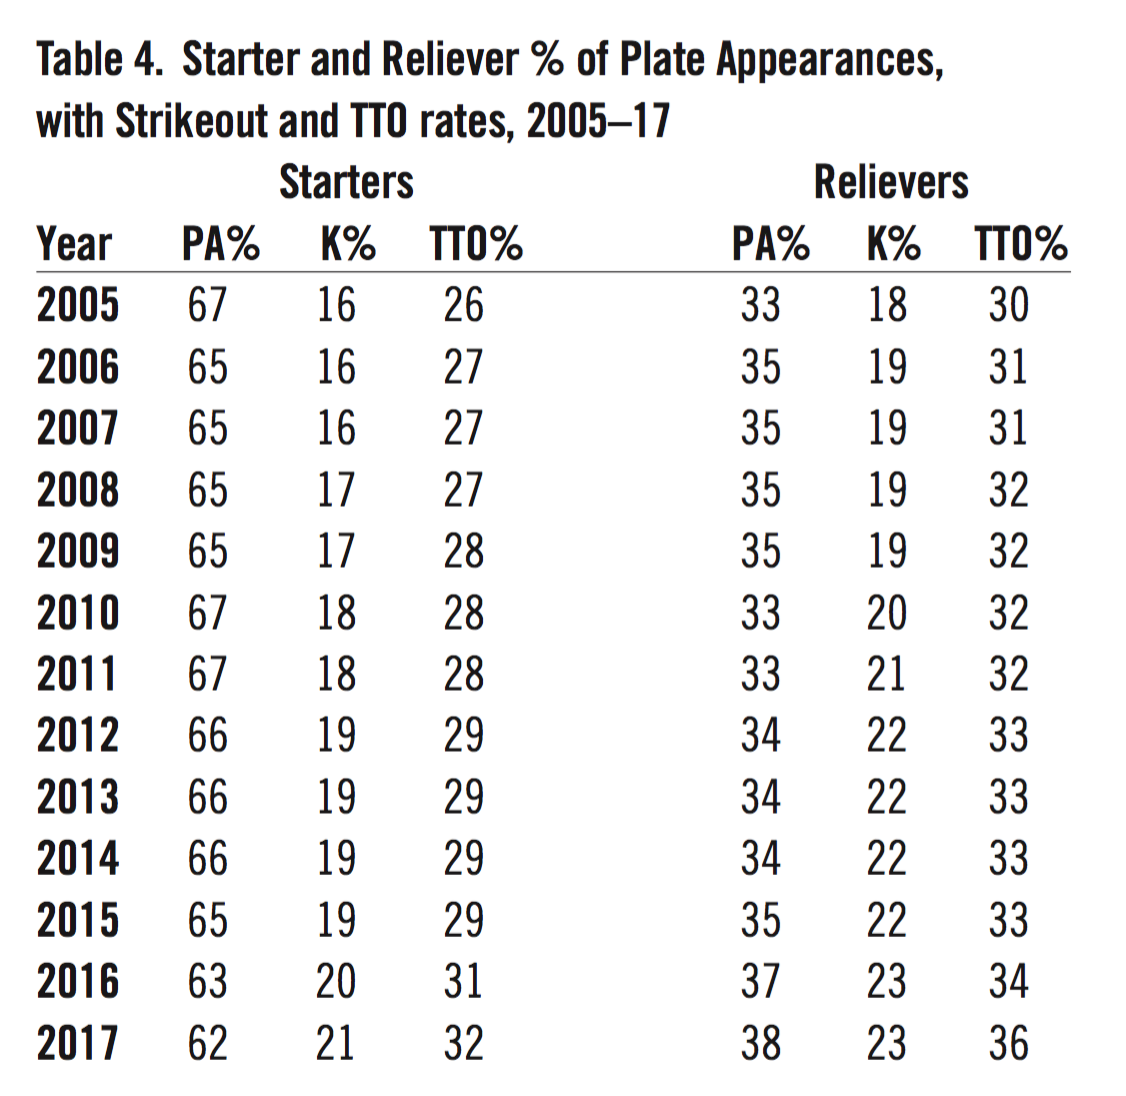
The frequency of managers employing the strategy of “shortening” games—using seventh-inning relievers, setup men, lefty and righty specialists and the like to get the game to the closer—has risen sharply in the past decade. As shown in Table 4, relievers took part in 38 percent of all plate appearances (PA%) in 2017, compared to only 33 percent back in 2005.9
Table 4: Starter and Reliever Percentage of Plate Appearances, with Strikeout and TTO rates, 2005-2017
(Click image to enlarge.)
This is important to the TTO discussion because relievers have higher strikeout rates than starters, going as far back as 1969.
REASON 2: INFUSION OF YOUTH IN GAME BROUGHT WITH IT A FREE-SWINGING ATTITUDE
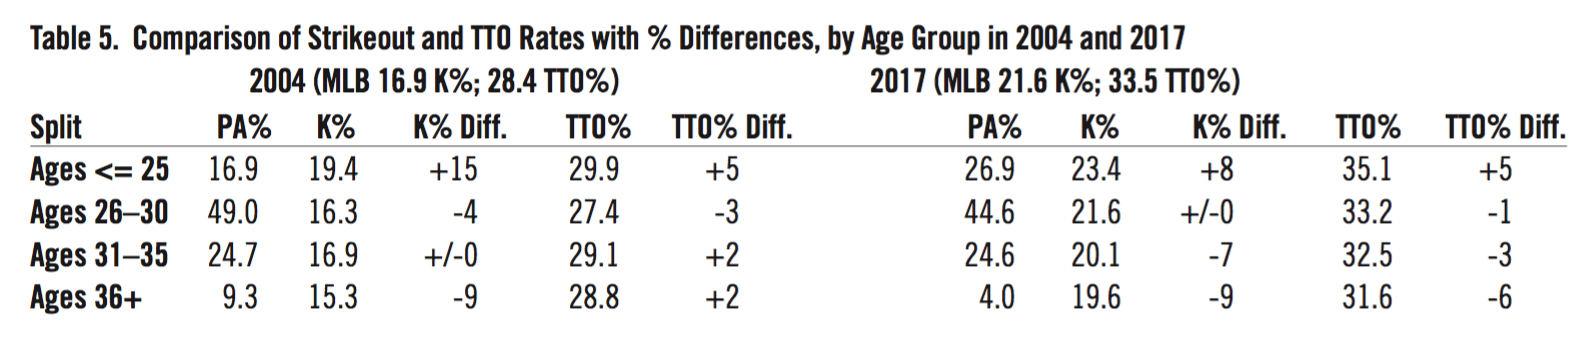
Table 5 shows the percentage of plate appearances given to each of four distinct age groups in the major leagues. The year 2004 was chosen as that was the most recent nadir in terms of the youngest group’s percentage of all plate appearances. “K Pct. Diff.” is the difference between each group’s strikeout rate and the majors as a whole that season. For example, in 2004 the “Ages <= 25” group had a strikeout rate of 19.4 percent against a major league average of 16.9, for a “K Pct. Diff” of 15 percent above average. Similarly, “TTO Pct. Diff” is the difference between the group’s TTO percentage and the majors as a whole that season. In 2004 the “Ages <= 25” group had a 29.9 TTO percentage against a major league average of 28.4, and was therefore 5 percent higher (29.9/28.4 = 105 percent).
Since 2004, the percentage of plate appearances given to “youngsters” has risen by ten full points, offsetting a drop in that group’s strikeout-percentage difference from 15 percent above average to 8 above average. Notice that in 2017, the younger the group was, the higher the strikeout rate and TTO percentage. The prospects and/or youngest players coming into the big leagues are driving the rising strikeout rate, which in turn raises the current TTO rate.10
Table 5: Comparison of Strikeout and TTO Rates with Percentage Differences, by Age Group in 2004 and 2017
(Click image to enlarge.)
REASON 3: “SMALL BALL” IS WANING
In 2011, there were 1,667 sacrifice bunts. In 2017, that number was down 45 percent to 925. There were 4,540 stolen base attempts and 1,274 sacrifice flies in 2011. Six years later, those numbers were 3,461 and 1,168 respectively.11 It appears teams no longer play for one run unless absolutely necessary. The “Earl Weaver special” of a three-run homer is the weapon of choice nowadays, and TTO is taking over.12
One look at an “expected runs matrix” should show why. Table 6 shows the 24 base-out states possible in an inning, along with the expected runs scored in each circumstance during 2017.13
Table 6: Expected Runs Matrix for MLB, 2017

For example, with no outs and a runner on first, one should expect to score 0.89 runs. That expectancy actually drops to 0.69 runs if you sacrifice bunt or otherwise “productively” move the runner to second while making an out.
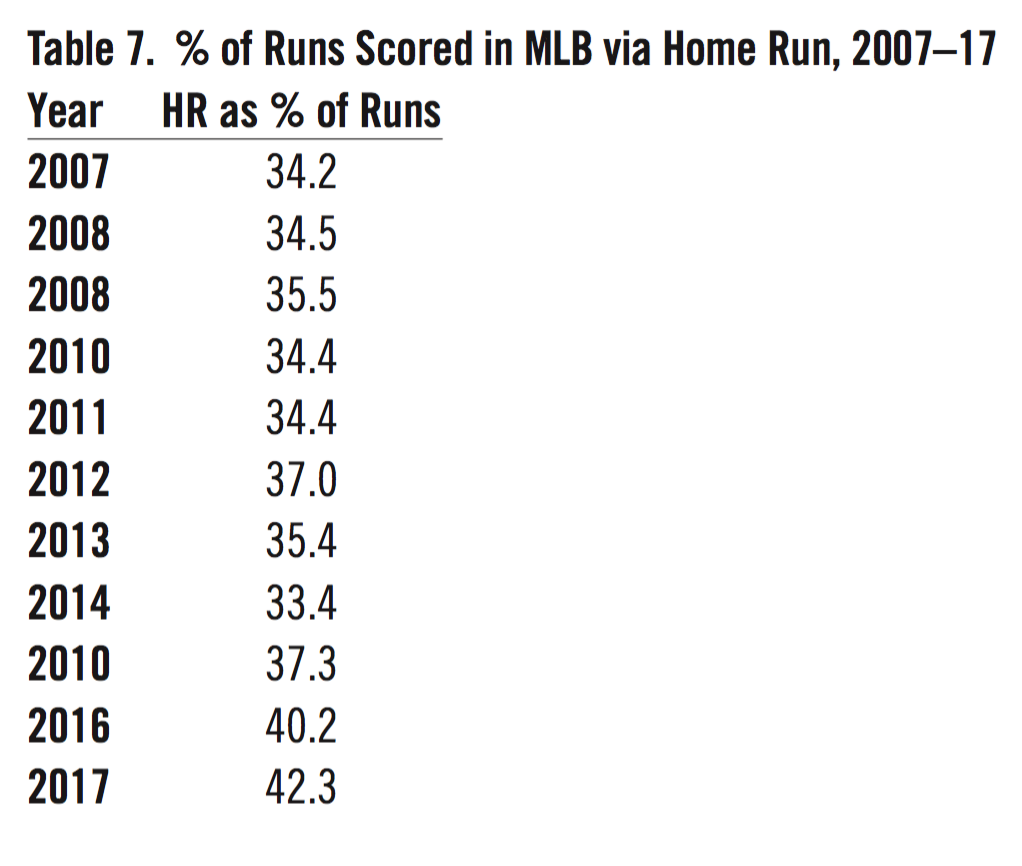
More and more, teams are forsaking small ball and relying upon the long ball. Table 7 shows the percentage of runs scored via the home run since 2007. The 42.3 percent figure in 2017 is an all-time record.14
Table 7: Percentage of Runs Scored in MLB via Home Run, 2007-2017
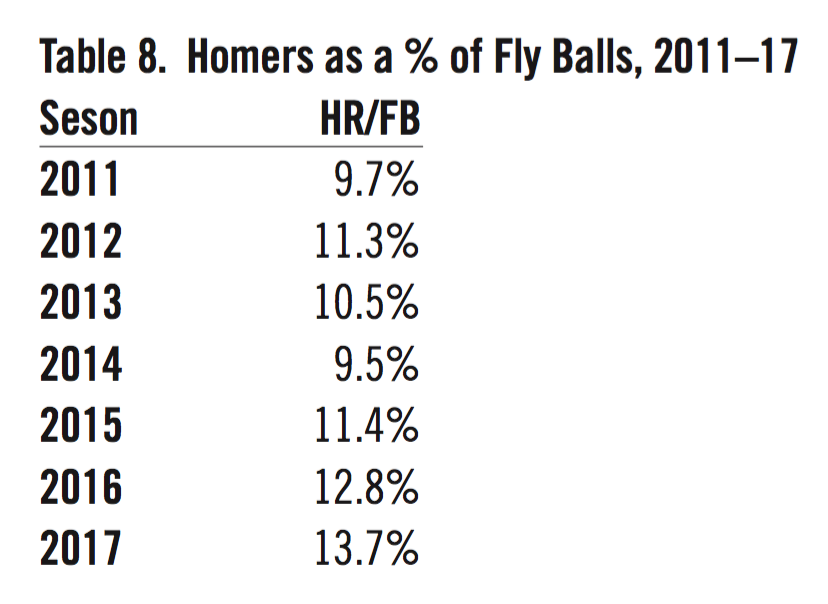
This homer-happy thinking has been fueled by a dramatic increase in the percentage of fly balls that resulted in homers over the past few seasons. Table 8 shows that nearly 14 percent of all fly balls left the yard in 2017, a record since these data became available.15
Table 8: Homers as a Percentage of Fly Balls, 2011-2017
Fly balls traveled an average of 316 feet in 2015. For whatever reason (batters changing their launch angle, which will be discussed shortly, or baseballs being more lively, are two possibilities), that average jumped to 319 feet in 2016 and 321 feet in 2017.16 Those five additional feet turn some routine outs into hits or even homers. Even if the fly ball doesn’t go out, it has become less of a pox on batters. In 2014 batters hit .212 on fly balls. That average grew to .251 in 2017.17 This leads into our next reason.
REASON 4: ADVANCED ANALYTICS HAVE MADE LAUNCH ANGLE THE “IN” THING
The 2015 introduction and growing use by teams of Statcast data, which tracks the movement of every ball and fielder in each park/game, has changed the way some players have approached hitting.18 Where once hitters were limited to video review and advanced scouting of pitcher tendencies, now they have almost instantaneous access to the exit velocity and launch angle of their batted balls.19,20
A June 2017 article in the Washington Post went into great detail on this: “More batters are focusing not only on hitting the ball hard, but hitting the ball high into the air. The average launch angle—the angle at which the ball flies after being hit—rose from 10.5 degrees in 2015 to 11.5 degrees in 2016.” By May 21, 2017, the average launch angle was up to 12.8. Those two degrees may not sound like much, but they can make the difference between a ground ball and a line drive. “Balls hit with a high launch angle are more likely to result in a hit. Hit fast enough and at the right angle [generally over 95 miles per hour at an angle between 25 and 35 degrees], they become home runs.”21
The Post made Washington hometown hitter Daniel Murphy their example of a batter who adjusted his swing to hit the ball higher, noting that his “launch angle rose from 11.1 degrees in 2015 to 16.6 degrees in 2016″ and “his batting average rose from .281 in 2015 to .347 in 2016. He also hit eleven more home runs.”22
But when one swings hard and tries to hit the bottom half of the ball to generate loft, there will be an increased tendency to swing and miss, which leads brings us to the last reason.
 REASON 5: THE STRIKEOUT HAS BEEN DESTIGMATIZED
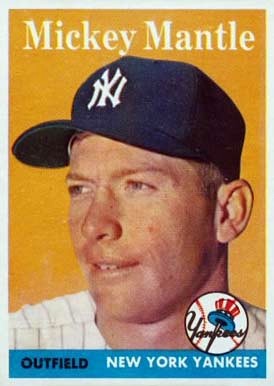
“I’ve quit trying to hit home runs every time I go to bat. … From now on I’m just trying to keep from striking out. All I want to do is meet the ball. If I do that I’ll have a good year.” — Mickey Mantle in April of 195623
“Ralph Houk … has advised me to try choking up the bat when I’m up there left-handed and the pitcher has two strikes against me. I’m going to try it.” — Mantle in January of 196124
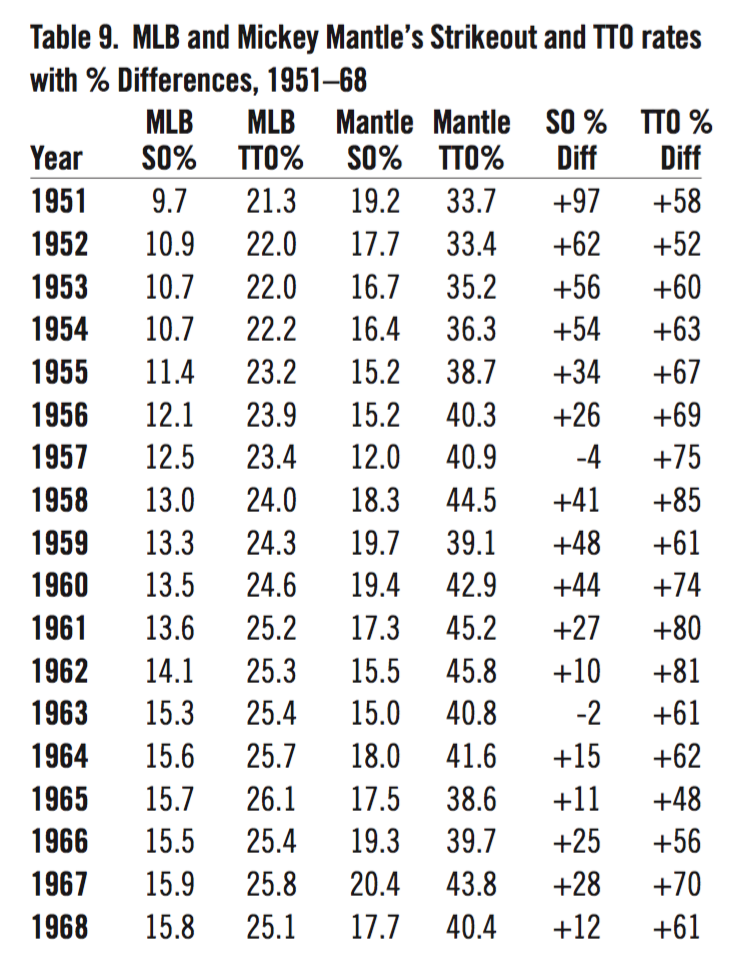
Back in the 1950s and ’60s, Mickey Mantle was frequently criticized for his high strikeout totals, despite a high batting average, immense power, and, as it turned out, all his best intentions. Table 9 shows how in nearly every season of his career, including his MVP seasons of 1956, 1957, and 1962, Mantle far exceeded the major league strikeout rate (and consequently one-upped the league TTO rate also).25
Table 9: MLB and Mickey Mantle’s Strikeout and TTO rates with Percentage Differences, 1951-1968
(Click image to enlarge.)
Contrast that with today’s players and environment:
“There’s no doubt the pitchers throw harder now than when I first got to the league, but there is also a different mentality from players these days. … They feel like if they strike out, it’s not a big deal. I personally hate strikeouts … but that’s my mentality. Yes, I see more homers and more strikeouts, but I guess that’s, like, the new baseball.” — Carlos Beltran26
Beltran made the majors in 1998. During that season, 23 batting title qualifiers ended the season with more walks than strikeouts.27 Since 2012, there have been no more than five qualifying players in any season.28
One need look no further than arguably the two best and most popular players in the game, Bryce Harper and Mike Trout, to witness the new world order of Strikeouts Are Okay. During his career, Harper has struck out 20.4 percent of the time, which coincidentally matches Mantle’s worst season, but is just a hair below the major league average of 20.5 percent.29 No one has suggested the five-time All-Star try cutting down his swing. Meanwhile, Trout struck out an American League-leading 184 times in 2014, and still led the league in offensive WAR and won the MVP that year.30 He also strikes out just above the major league average over his career (21.5 percent to 20.3 percent). There have been no reports of Mike Scioscia suggesting Trout choke up with two strikes against a tough righty.
Most recently, this past season, Aaron Judge became only the fifth rookie to qualify for the batting title while striking out in more than 30 percent of his plate appearances (Table 10).31 Note that all of these have occurred since 1995, and three of them have taken place in the last three seasons.
Table 10: Batting Title Qualifying Rookies with 30 Percent Strikeout Rate in Season

Judge also set a TTO rookie record in 2017 with an amazing 57.1 percent of his plate appearances ending in a walk, strikeout, or homer. According to Nate Silver, Judge became only the eighth player to lead his league in all three TTO categories in the same year.32 Regardless of how voters felt about his TTO prowess, Judge earned the 2017 American League Rookie of the Year, and was a second-place finisher in AL Most Valuable Player balloting. Fans seemed more enamored with his rookie record 52 homers than concerned about his (also) rookie record 208 strikeouts, as he had the most popular jersey at MLBShop.com.33
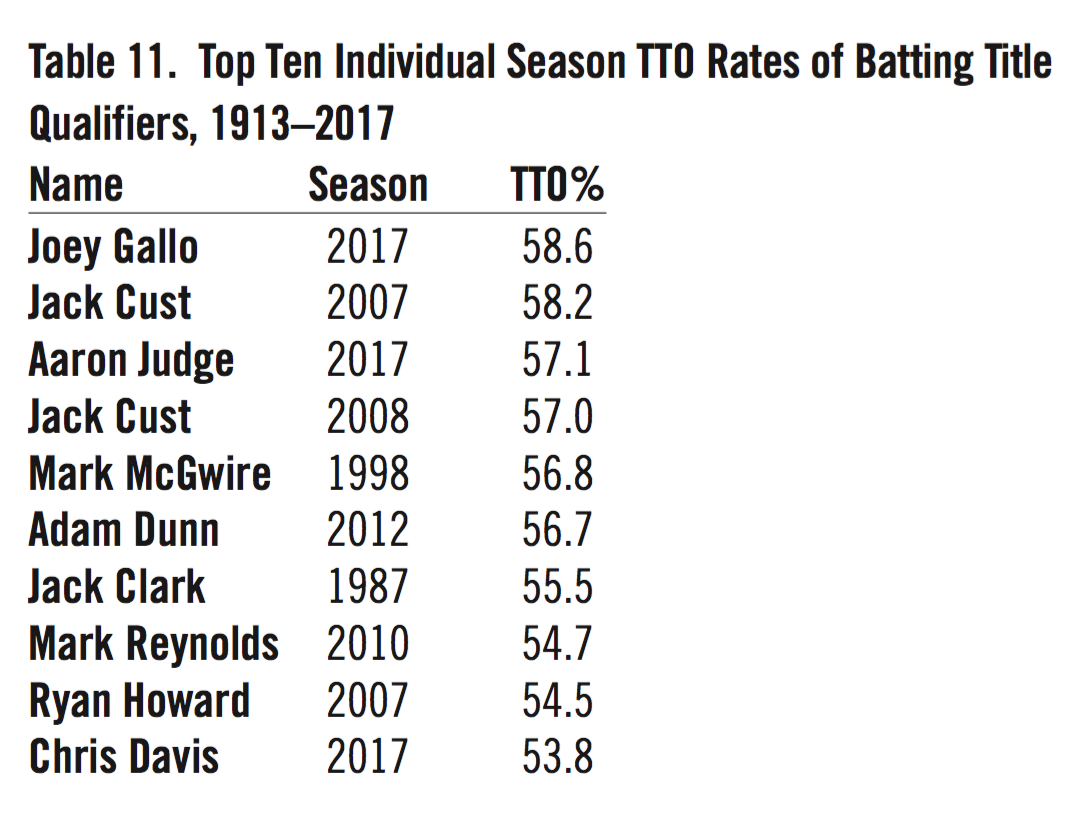
Judge’s assault on the TTO record this past season was actually upstaged by Joey Gallo, who broke Jack Cust’s 2007 record of 58.2 percent TTO. Gallo’s 58.6 TTO percentage means that three of the top ten highest TTO rates occurred in 2017 (Table 11).
Table 11: Top Ten Individual Season TTO Rates of Batting Title Qualifiers, 1913 to 2017
IMPACT OF TTO ON TODAY’S GAME
Tickets sold to major league games have declined relatively steadily from a 2007 peak of 79.5 million to 2017’s 72.7 million.34 Reasons for this decline have included the hot-button phrase “pace of play,” as some believe that the increasing length of games (an average two hours and 49 minutes in 2005, which grew to three hours and eight minutes in 2017) has bored and/or deterred fans. 35
Some of this increase in game length can be attributed to the previously mentioned glut of relief appearances in today’s game. Teams are using half a pitching appearance more on average per game in 2017 compared to 2005 (4.22 vs. 3.71). Additionally, pitches per plate appearance have increased from 3.74 in 2005 to 3.89 in 2017.36 The longer plate appearances extend into time between pitches also. As of mid-June 2017, players were taking 1.1 seconds more between pitches in 2017 than 2016, an unprecedented one-year jump in the 11 seasons such records have been available.37 As for game length being driven upward by increased offense, you can’t blame it on more batters coming to the plate, as the average plate appearances per game has decreased slightly between from 2005 to 2017.38
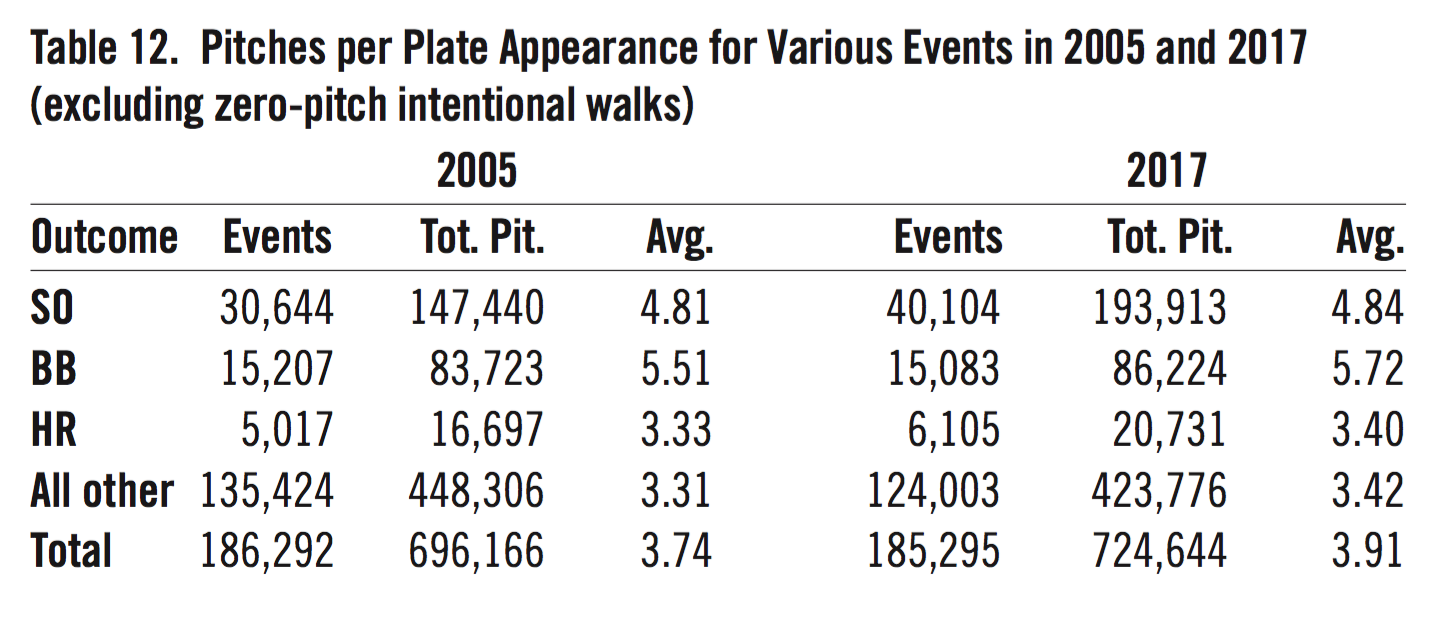
A natural question to ask is whether TTO outcomes are to blame for longer plate appearances. To answer that, one would need to figure out how many pitches on average it took to achieve each of the TTO events, versus all other plate-appearance outcomes. Table 12 shows the results of taking Baseball Reference Play Index data for 2005 and 2017 and splitting out the pitch counts for strikeouts, walks, homers, and all other events.39 The table reveals that the TTO outcomes—especially walks and strikeouts (both above the overall average in pitches)—lead to longer at-bats. In fact, it took more pitches in 2017 to finish any kind of plate appearance. Those longer at-bats are part of the reason for longer games.
Even though the average number of pitches to achieve a strikeout has increased only slightly between 2005 and 2017, there were nearly ten thousand more such events in 2017. An additional 46,473 pitches were thrown during strikeouts in 2017 compared to 2005. That works out to an average of 19 additional pitches per game, roughly one-half inning’s worth.
Table 12: Pitches per Plate Appearance for Various Events in 2005 and 2017 (excluding zero-pitch intentional walks)
(Click image to enlarge.)
THE FUTURE OF TTO
Still we’ve only had one run scored that was manufactured. It’s millennial. This is millennial baseball right now. You get up, you take a big swing, you strike out. You don’t try to get the runners over very often. Nobody bunts. Nobody hit-and-runs. We’re a team that has to get guys on and we got five hits. I mean, six runs and five hits is what you call efficiency, except if you lose.
— Steve Garvey on Game Two of the 2017 World Series40
Game Two of the 2017 World Series featured 19 strikeouts, eight homers, and eight walks amid 90 plate appearances.41 The Astros 7–6 win over the Dodgers had 35 three-true-outcome events, which was apparently too much for former major leaguer Garvey.
Regardless of whether you call it “millennial baseball” or TTO, there doesn’t appear to be enough of a groundswell within Major League Baseball or the Players Association themselves to change the direction toward more TTO. Pace of play initiatives have focused on intentional walks, mound visit durations, and time between pitches and pitching changes.
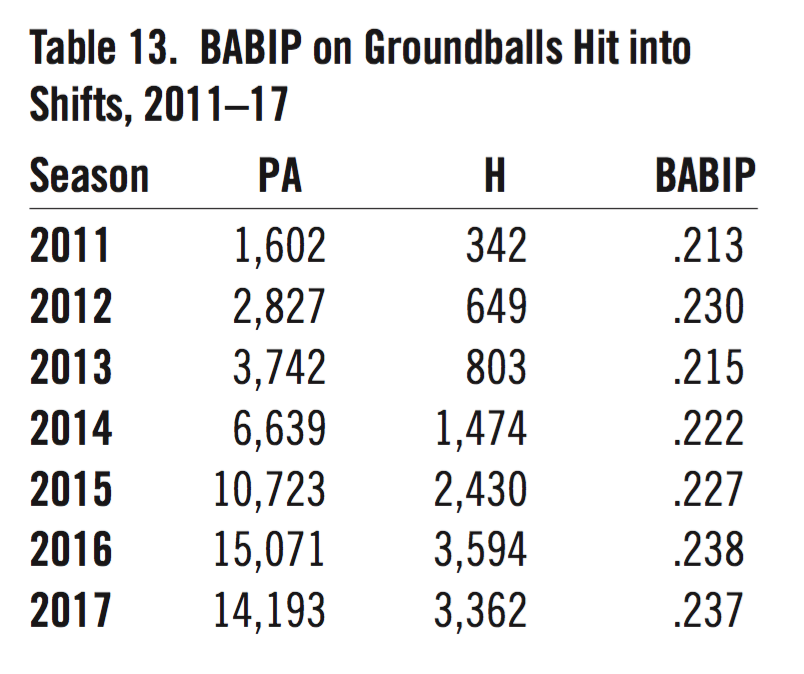
From the player’s perspective, why shouldn’t they adopt a TTO approach, given the increasing use of defensive shifts on the infield? You can see the impact of infield shifts on batting average on balls in play (BABIP) in Table 13. The normal BABIP in a season is right around .300. With shifts, balls on the ground resulted in a measly .237 BABIP in 2017—and that was the second highest figure in the last seven years.42 So why put the ball in play on the ground?
Table 13: BABIP on Groundballs Hit into Shifts, 2011–2017
When you do put the ball in play, fielders are now as good as they’ve ever been, shifted or not. The .984 fielding average in the majors in 2017 was just below the all-time high of .985 in 2013.43 There has been no tangible increase in batting average on balls in play in the past 25 years.44 There is little in the way of new incentives to put the ball in play on the ground, and with whispers of a livelier ball being used since the middle of 2015, homers and other extra-base hits are easier to come by if you adjust your launch angle.45
With the rare exceptions of lowering the mound and reducing the strike zone in 1969, and the introduction of the designated hitter in 1973, baseball has not tinkered with the fundamental workings of the game in the past 50 years. Those changes were for the purposes of boosting offense and hopefully attendance along with them. If attendance continues to drop, baseball might be inclined to implement similar radical changes. Would MLB consider, for example, something as drastic as deadening the ball to reduce home runs? It’s not that there is “too much offense” in the game right now; it’s that the offensive strategies, on a “molecular” level, have dynamically changed the game flow. However, the TTO revolution, which started as an Internet goof and has become a reality due to the reasons addressed herein, is apparently here to stay.
DAVID (D.B.) FIRSTMAN is a Data Analyst for the City of New York, crunching large datasets using SPSS and Excel. He has been a member of SABR off and on since the late 1980s. Besides his own baseball blog (Value Over Replacement Grit), his work has appeared at ESPN, Bronx Banter, Baseball Prospectus, The Hardball Times, and in The Village Voice. He wonders if the Royals will ever learn to love the Three True Outcomes.
Notes
1 “Rob Deer Stats,” Baseball-Reference.com. Accessed October 29, 2017. https://www.baseball-reference.com/play-index/share.fcgi?id=jB3cC.
2 “Appreciating TOOTBLAN & other new baseball lingo,” FOX Sports, June 29, 2015. Accessed October 29, 2017. http://www.foxsports.com/mlb/just-a-bit-outside/story/appreciating-new-baseball-lingo-tootblan-maddux-three-true-outcomes-062915.
3 Rany Jazayerli, “Doctoring the Numbers: The Doctor is…Gone,” Baseball Prospectus, August 15, 2000. Accessed October 29, 2017. https://www.baseballprospectus.com/news/article/724/doctoring-the-numbers-the-doctor-is-gone/.
4 Voros McCracken, “Pitching and Defense: How Much Control Do Hurlers Have?” Baseball Prospectus, January 23, 2001. Accessed October 29, 2017. https://www.baseballprospectus.com/news/article/878/pitching-and-defense-how-much-control-do-hurlers-have/.
5 Keith Woolner, “Aim For The Head: Three True Outcomes, 2003,” Baseball Prospectus, January 21, 2004. Accessed October 29, 2017. https://www.baseballprospectus.com/news/article/2518/aim-for-the-head-three-true-outcomes-2003/.
6 Diane Firstman, “Applying ‘Three True Outcomes’ to a Team,” Value Over Replacement Grit, February 19, 2013. Accessed October 29, 2017. http://valueoverreplacementgrit.com/2012/02/06/applying-three-true-outcomes-to-a-team/.
7 Michael Baumann, “The End of Baseball As We Know It,” The Ringer, August 3, 2017. Accessed October 29, 2017. https://www.theringer.com/2017/8/7/16108098/the-end-of-baseball-as-we-know-it.
8 “2017 Major League Baseball Batting Ratios,” Baseball-Reference.com. Accessed October 29, 2017. https://www.baseball-reference.com/leagues/MLB/2017-ratio-batting.shtml.
9 “Team Pitching Split Finder,.” Baseball-Reference.com.. Accessed October 29, 2017,. https://www.baseball-reference.com/tiny/QEx8N.
10 “Team Batting Split Finder,” Baseball-Reference.com. Accessed October 29, 2017. https://www.baseball-reference.com/tiny/rTfeH.
11 “Major League Baseball Batting Year-by-Year Averages,” Baseball-Reference.com. Accessed October 29, 2017. https://www.baseball-reference.com/leagues/MLB/bat.shtml.
12 Diane Firstman, “Earl Weaver’s Love Affair with the Three-Run Homer,.” Value Over Replacement Grit, January 22, 2013. Accessed October 29, 2017. http://valueoverreplacementgrit.com/2013/01/20/earl-weavers-love-affair-with-the-three-run-homer/.
13 “Custom Statistics Report: Run Expectations,” Baseball Prospectus. Accessed October 29, 2017. http://legacy.baseballprospectus.com/sortable/index.php?cid=1918829.
14 Baseball Prospectus. | Statistics | “Custom Statistic Reports: Team Batting,” Baseball Prospectus. Accessed October 29, 2017. http://legacy.baseballprospectus.com/sortable/index.php?cid=2474935.
15 “Leaderboard, League Stats, Batting, Batted Ball,” FanGraphs. Accessed October 26, 2017. https://tinyurl.com/y7oztkcy.
16 “Statcast Search,” BaseballSavant. Accessed October 31, 2017. https://tinyurl.com/yaeakoxy.
17 “Major League Total Stats,” » 2017 » Batters » Standard Statistics | FanGraphs Baseball FanGraphs. Accessed November 1, 2017. https://tinyurl.com/ybpkgbyj.
18 “Glossary: Statcast,” MLB.com. Accessed December 27, 2017. http://m.mlb.com/glossary/statcast.
19 “Glossary: What is a Exit Velocity (EV)? | Glossary,” MLB.com. Accessed December 27, 2017. http://m.mlb.com/glossary/statcast/exit-velocity.
20 “Glossary: What is a Launch Angle (LA)? | Glossary.” MLB.com. Accessed December 27, 2017. http://m.mlb.com/glossary/statcast/launch-angle.
21 Dave Sheinin, “Why MLB hitters are suddenly obsessed with launch angles,” Washington Post, June 1, 2017. Accessed December 27, 2017. https://www.washingtonpost.com/graphics/sports/mlb-launch-angles-story/?utm_term=.5afef4d70b4b.
22 Sheinin, “Why MLB hitters are suddenly obsessed with launch angles.”
23 Arthur Daly, “A Reformed Man,” New York Times, April 22, 1956, 28. Accessed October 26, 2017. http://www.nytimes.com/1956/04/22/archives/article-7-no-title-a-reformed-man.html
24 Louis Effrat, “Mantle Accepts $75,000 Yankee Pact and Will Curtail Outside Interests,” New York Times, January 17, 1961., 43. Accessed October 27, 2017. https://timesmachine.nytimes.com/timesmachine/1961/01/17/118013388.html?pageNumber=43. Accessed October 27, 2017.
25 “Mickey Mantle Batting Stats: Ratio Batting,” Baseball-Reference.com. Accessed October 29, 2017. https://www.baseball-reference.com/players/m/mantlmi01-bat.shtml#batting_ratio::none.
26 Baumann, “The End of Baseball As We Know It.”
27 “Batting Season Finder,” Baseball-Reference.com. Accessed October 31, 2017. https://www.baseball-reference.com/tiny/EaiM7.
28 “Batting Season Finder,” Baseball-Reference.com. Accessed October 31, 2017. https://www.baseball-reference.com/tiny/R8Arr.
29 “Bryce Harper Batting Stats: Ratio Batting,” Baseball-Reference.com. Accessed October 29, 2017. https://www.baseball-reference.com/players/h/harpebr03-bat.shtml#batting_ratio::none.
30 “Mike Trout Stats,” Baseball-Reference.com. Accessed October 29, 2017. https://www.baseball-reference.com/players/t/troutmi01.shtml.
31 “Batting Season Finder,” Baseball-Reference.com. Accessed October 29, 2017. https://www.baseball-reference.com/tiny/TJcSk.
32 Nate Silver, tweet, Twitter.com, September 30, 2017. https://twitter.com/natesilver538/status/914230214955282432?lang=en
33 “Aaron Judge’s No. 99 is the best-selling jersey of 2017.” SI.com. Accessed February 20, 2018. https://www.si.com/mlb/2017/10/03/aaron-judge-best-selling-jersey-2017-mlb-season.
34 “Major League Baseball Miscellaneous Year-by-Year Averages and Totals,” Baseball-Reference.com. Accessed October 29, 2017. https://www.baseball-reference.com/leagues/MLB/misc.shtml.
35 Ibid.
36 Ibid.
37 Tom Verducci, “Baseball’s pressing question: What happens to a sport when nothing happens?,” SI.com, June 20, 2017. Accessed October 29, 2017. https://www.si.com/mlb/2017/06/20/standstill-pace-play-cody-bellinger-clayton-kershaw.
38 “Major League Baseball Miscellaneous Year-by-Year Averages and Totals.” Baseball-Reference.com. Accessed October 29, 2017. https://www.baseball-reference.com/leagues/MLB/misc.shtml.
39 Ibid.
40 Bill Baer, “Steve Garvey blames ‘millennial baseball’ for Game 2 of World Series,” HardballTalk, October 26, 2017. Accessed October 29, 2017. http://mlb.nbcsports.com/2017/10/26/steve-garvey-blames-millennial-baseball-for-game-2-of-world-series/.
41 “2017 World Series Game 2, Astros at Dodgers, October 25,” Baseball-Reference.com. Accessed October 29, 2017. https://www.baseball-reference.com/boxes/LAN/LAN201710250.shtml.
42 “Splits Leaderboard,” FanGraphs. Accessed November 1, 2017. https://tinyurl.com/ybrf2ya5.
43 “Major League Baseball Fielding Year-by-Year Averages.” Baseball-Reference.com. Accessed October 29, 2017. https://www.baseball-reference.com/leagues/MLB/field.shtml.
44 “Major League Baseball Pitching Year-by-Year Averages,” Baseball-Reference.com. Accessed October 29, 2017. https://www.baseball-reference.com/play-index/share.fcgi?id=P3YyZ.
45 Baumann, “The End of Baseball As We Know It.”