

Ghost Stories and Zombie Invasions: Testing the Myths of Extra-Inning Outcomes
This article was written by Connelly Doan
This article was published in Fall 2024 Baseball Research Journal
After several years of testing in Minor League Baseball, Major League Baseball introduced a regular-season extra-inning rule in 2020 by which teams begin each extra inning with a runner on second base. The rule was meant to reduce the length of extra-inning games and save pitching arms while bringing more action to the game.1 While it was initially enacted to accommodate the 2020 COVID-19 pandemic season, the rule was made permanent by MLB’s Joint Competition Committee prior to the 2023 season.2
The decision to introduce “ghosts” and “zombies” to MLB was met with polarizing feelings from fans.3 While there are many debates around the rule, two main topics of argument are: “Does departing from the tradition of the game actually lead to shorter games?” and “Is the strategy of extra-inning games simplified to sacrifice-bunting the automatic runner to third and hitting a sacrifice fly or a single to score, thus making the game even less exciting?”4
While these discussions have relied on ample anecdotal evidence, little has been presented in terms of empirical evidence to analyze how extra-inning games used to play out compared to how they’ve been played since the introduction of the new rules at the big-league level. This paper will present descriptive data from extra-inning games in the 2018–22 regular seasons. These data will be used to test for statistically and practically significant changes in the following game results: average innings per extra-inning game; average extrainning runs scored per game; frequency of extra-inning bunt attempts and their success; and the game situations when bunt attempts occurred. This analysis will provide concrete evidence about whether and how the automatic-runner rule has impacted games.
DATA OVERVIEW
The raw play-by-play extra-inning game data for this article were scraped from MLB’s API game data using Python. Specifically, the raw data comprised extra-inning game data from games in the 2018 regular season through the 2022 regular season. Only games that were originally scheduled to be nine innings were included, as doubleheaders in 2020 and 2021 were scheduled to be seven innings.5 The line scores of those games were then coded to identify occurrences of interest in extra innings.
Several Python libraries were used for data pulling, cleaning, and analysis. Pybaseball was used to facilitate the ingestion of the raw data.6 Pandas was used to manipulate the raw data into usable data frames for further analysis. PandaSQL was used to better query the created data frames and shape the variables of interest. Finally, Scipy’s Stats was used to run independent T-tests on the variables of interest, treating the 2018–19 and 2020–22 seasons as the independent sample groups.7
VARIABLES/DEFINITIONS
Average innings per extra-inning game was defined as named. Average extra-inning runs scored per game by home and away teams only considered the number of runs scored in extra innings.
Variables concerning bunt attempts, successes, and situational context were defined using Statcast’s events and descriptions. Statcast events are categories bucketing the outcomes of an at-bat or play (sacrifice bunt, single, etc.). Descriptions further categorize the specific type of action taken within an event (foul bunt, missed bunt, etc.). Additionally, each action within an event is given a full written description. Bunt attempts were defined as any at-bats resulting in a game event of sacrifice bunt or an action described as a foul bunt or missed bunt, as well as any at-bat with an action containing “bunt” in the written description. Successful bunts were defined as a game event of sacrifice bunt or a game event of single with a description containing “bunt” in the written description.
(Click image to enlarge)
RESULTS
Game and Inning Stats
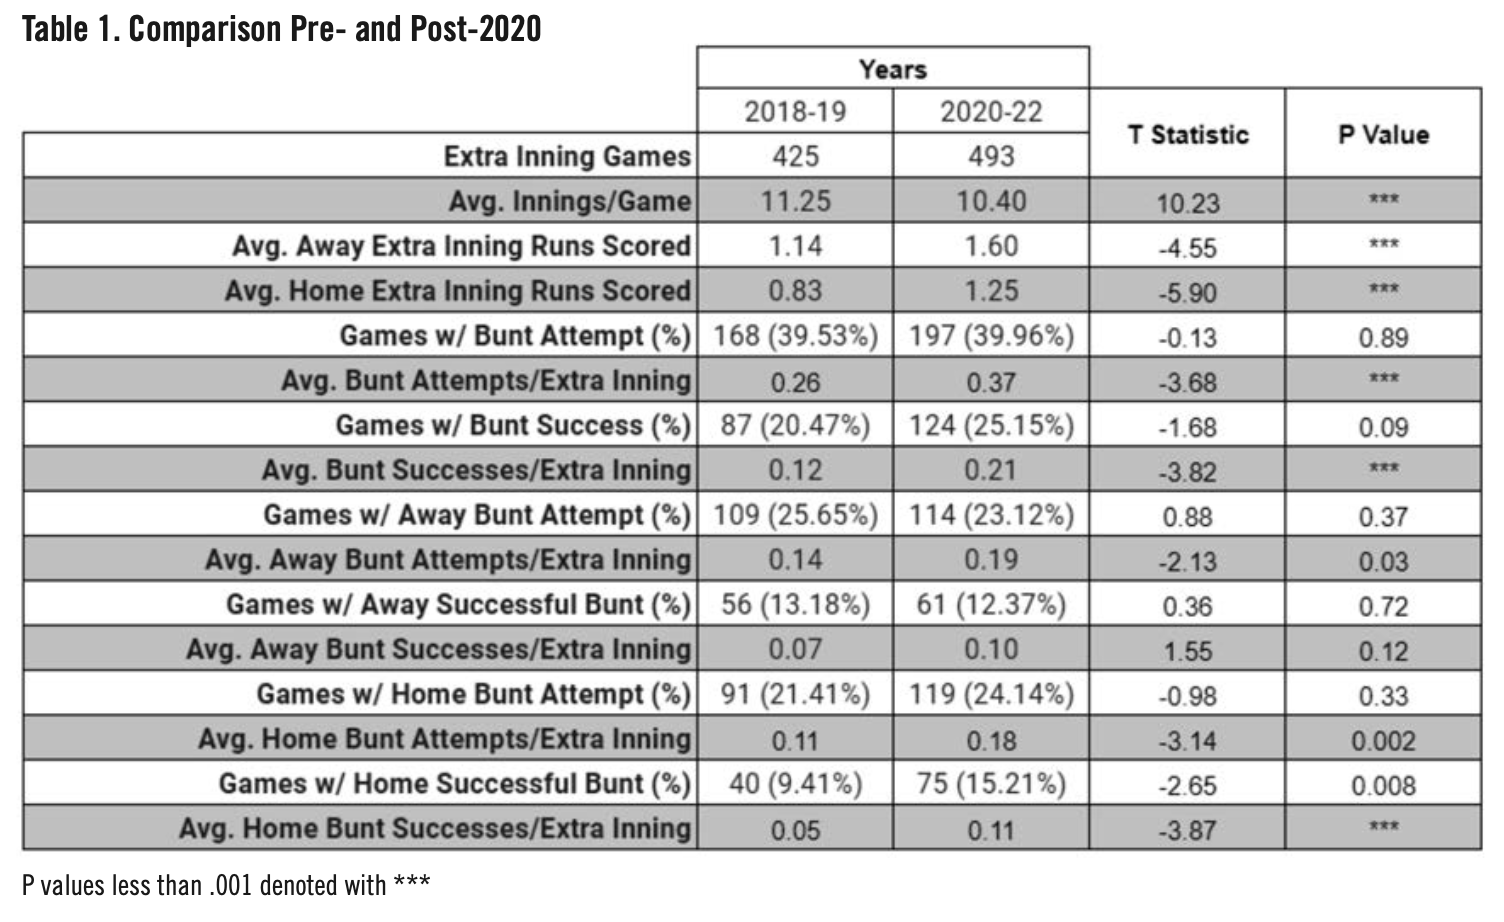
Table 1 presents both descriptive statistics and relevant T-test results for the variables in this analysis. T-tests determine whether the difference between mean values from two separate populations is statistically significant. The T value measures the size of the difference relative to the variation in the data. In other words, it presents the difference between the population means in standard error units.
The P value resulting from a T-test indicates the likelihood that the two means of comparison came from the same population. The higher the P value, the more similar the means are from the two populations. In other words, the higher the P value, the more likely it is that the means from the two populations could conceivably come from the same population, suggesting that the populations of interest are the same. P values range from 0 to 1, with .05 as the widely accepted maximum P value to indicate statistical significance of a difference.
The sample sizes of extra-inning games were roughly split between the two groups of data, with 425 standard extra-inning games occurring in 2018–19 (Before) and 493 occurring in 2020–22 (After). The average number of innings in Before’s games was 11.25, while the average number of innings in After’s games was 10.40. The T-test result between these averages was statistically significant, indicating that extra-inning games in Before were longer than in After.
The average number of extra-inning runs scored by the away team in Before’s games was 1.14, compared to 1.60 runs in After. Likewise, the average number of extra-inning runs scored by the home team in Before’s games was 0.83, compared to 1.25 runs in After. The T-test results between both of these averages were statistically significant, indicating that both home and away teams scored more runs in extra innings in After’s games.
In the Before period, 39.53% of games contained at least one bunt attempt in extra innings by either the home or away teams, while 39.96% of games did in the After period. The T-test result between these percentages was not statistically significant, indicating that games with extra-inning bunt attempts were not different between Before and After. At least one successful bunt was executed in 20.47% Before games and 25.15% of After games. The T-test result between these percentages yielded a P value of 0.09. Based on the previously mentioned 0.05 threshold, the results indicate that games with successful extra-inning bunts were also not different between Before and After.
Before’s games saw 0.26 bunt attempts per extra inning, compared to 0.37 in After games. The T-test result between these numbers was statistically significant, indicating that more bunts were attempted per extra inning in After’s games than in Before’s. Of those attempts, 0.12 bunt attempts per extra inning were successful in Before’s games, compared to 0.21 in After’s games. This T-test result was also statistically significant, indicating that more bunts were executed per extra inning in After’s games over Before’s.
Looking more specifically at the metrics by team, 25.65% of the 425 extra-inning games in Before contained at least one bunt attempt in extra innings by the away team, compared to 23.12% of the 493 extra-inning games in After. The T-test result between these percentages was not statistically significant, indicating that games with extra-inning bunt attempts by away teams were not different between Before and After. Similarly, 13.18% of the games in Before contained at least one successful bunt in extra innings by the away team, compared to 12.37% in After. The T-test result between these percentages was not statistically significant, indicating that games with successful extra-inning bunts by away teams were not different between Before and After.
Before’s games saw 0.14 away bunt attempts per extra inning, compared to 0.19 in After. The T-test result between these numbers was statistically significant, indicating that more bunts were attempted per extra inning by away teams in After’s games over Before’s. Of those attempts, 0.07 bunt attempts per extra inning were successful in Before’s games, compared to 0.10 in After’s games. This T-test result was not statistically significant at 0.12, indicating that there was no difference in executed bunts per extra inning by away teams in After’s games over Before’s.
In the bottom half of innings, 21.41% of games in Before contained at least one bunt attempt in extra innings by the home team, compared to 24.14% in After. The T-test result between these percentages was not statistically significant, indicating that games with extra-inning bunt attempts by home teams were not different between Before and After. On the other hand, 9.41% of the games in Before contained at least one successful bunt in extra innings by the home team, compared to 15.21% in After. The T-test result between these percentages was statistically significant, indicating that more games in After contained successful extra-inning bunts by the home team than in Before.
Before’s games saw 0.11 home bunt attempts per extra inning, compared to 0.18 in After. The T-test result between these numbers was statistically significant, indicating that more bunts were attempted per extra inning by home teams in After’s games over Before’s. Of those attempts, 0.05 per extra inning were successful in Before’s games, compared to 0.11 in After’s games. This T-test result was statistically significant, indicating that home teams executed more bunts per extra inning in After’s games over Before’s.
Bunt Situation Stats
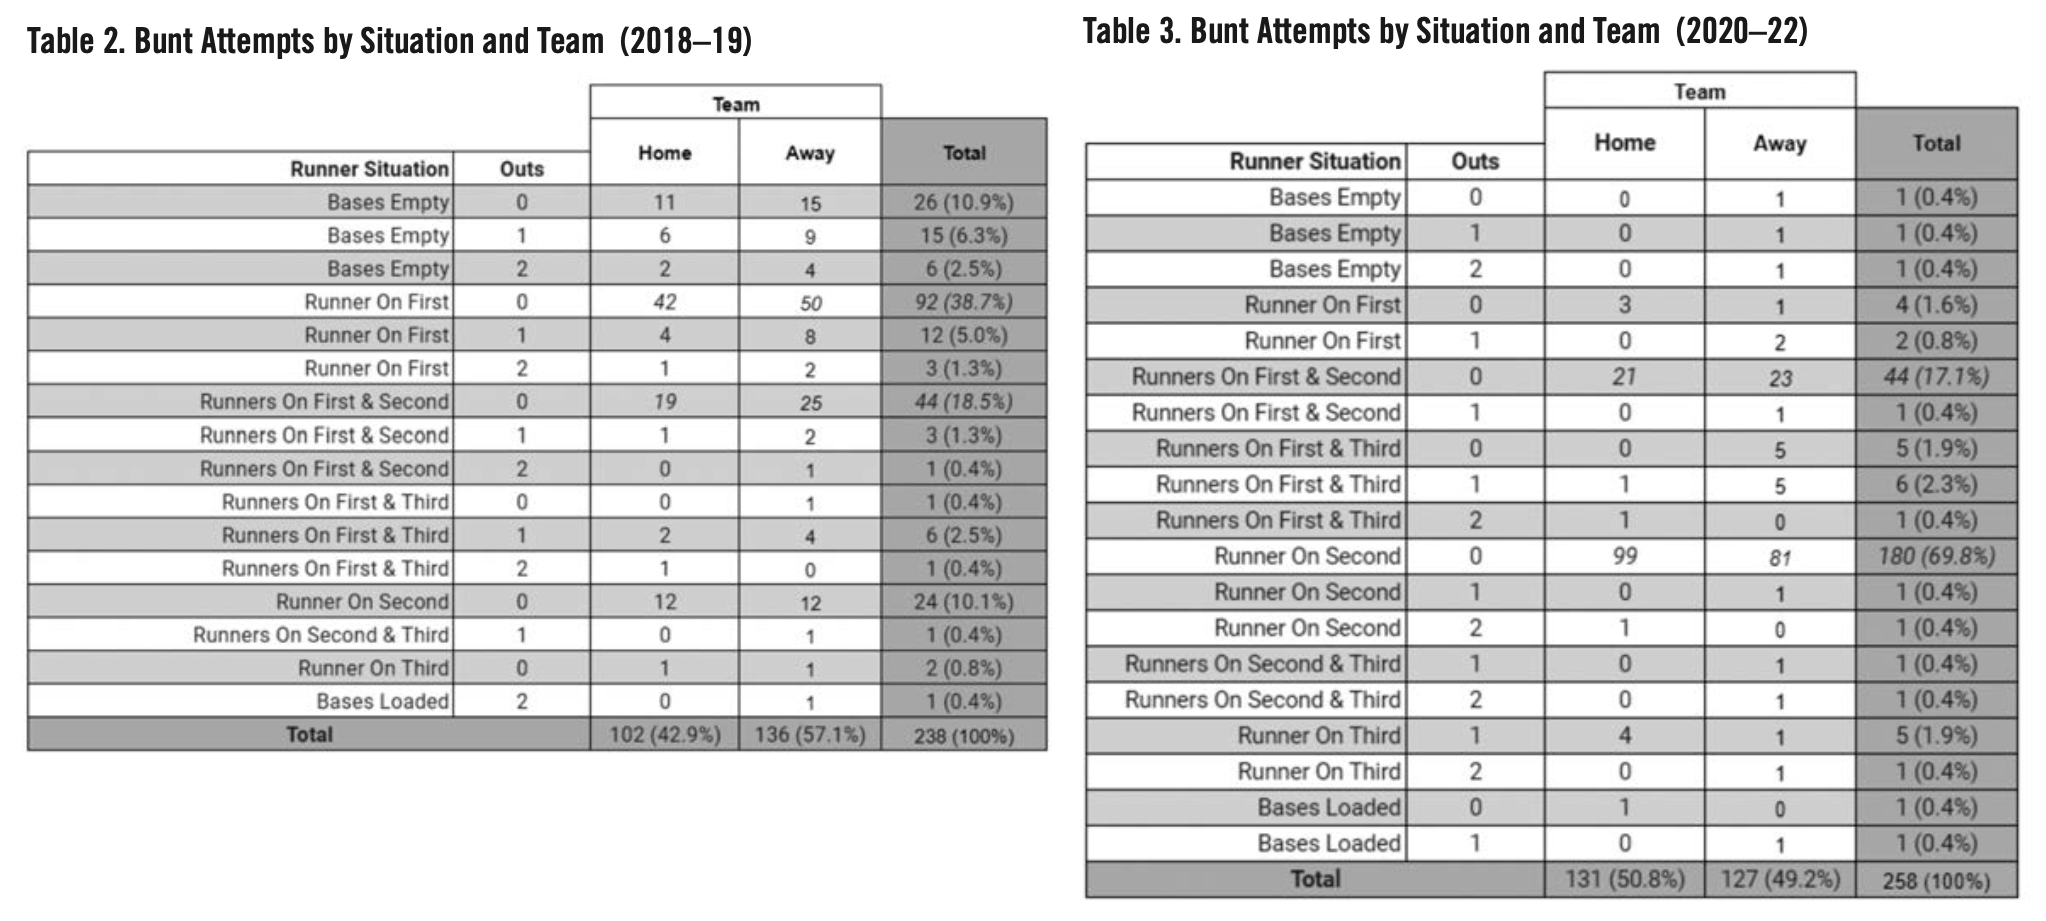
Tables 2 and 3 present the distribution of extra-inning bunt attempts by game situation and team for Before and After. The most frequent extra-inning bunt situations Before came with a runner on first with no outs (38.7%) and with runners on first and second with no outs (18.5%). This pattern held true for both home and away teams, with away teams attempting more bunts. Bases empty with no outs (10.9%) and a runner on second with no outs (10.1%) were the only other situations with a noticeable quantity of attempts.
The most frequent extra-inning bunt situations in After games overwhelmingly came with a runner on second and no outs (69.8%). This pattern held true for both home and away teams, but especially so for home teams. Runners on first and second with no outs (17.1%) was the only other situation with a noticeable number of attempts.
(Click image to enlarge)
DISCUSSION
Extra-inning game event data from 425 standard extra-inning games occurring 2018–19 (Before) were compared to 493 games occurring 2020–22 (After) to test for statistically different outcomes. Extra-inning games in Before lasted nearly one inning longer than in After, which was statistically significant. This could also be considered a practically significant difference, as the new rule eliminated almost 420 innings (or 46.6 standard games) of gameplay over the 2020–22 seasons. In terms of offensive production in extra innings, both away teams and home teams averaged about half a run more of production in After compared to Before. Given that more extra-inning runs were scored in fewer innings, the empirical evidence seems to support MLB’s original goals for implementing the new rule.8
In terms of overall gameplay strategy, the percentage of games with extra-inning bunt attempts was nearly identical Before and After, although more bunts were attempted per extra inning in After games. Most Before bunts were attempted with either a runner on first and no outs or with runners on first and second with no outs. Almost all After bunts were attempted with a runner on second and no outs or with runners on first and second and no outs. More After bunt attempts were successful than Before, perhaps due to them occurring without a force on the basepaths. These results align with the narrative that teams will try to take advantage of the automatic runner starting at second base. However, it can be argued that the intent of extra-inning bunts has not changed. Most extra-inning bunts, Before and After, occurred with a runner on base and no outs. While Before teams had to earn a baserunner as opposed to After, the bunt situation distribution suggests that the goal has not changed: Trade a first out to better position a runner to score.
The percentage of games in which the away team attempted a bunt in extra innings decreased slightly between Before and After. The percentage of those games with a successful away-team bunt also slightly decreased. Away teams attempted relatively fewer extra-inning bunts in After. Perhaps away teams are implementing various game theory analyses that suggest that swinging rather than bunting gives them the best chance to score runs in extra innings with the new rules.9
As for home teams, the percentage of games with attempted extra-inning bunts increased slightly between Before and After, although not enough to be deemed statistically significant. The number of games with a successful home-team bunt was almost six percentage points higher in After than in Before, which is both statistically and practically different. Additionally, home teams in After attempted and executed more extra-inning bunts than in Before. The difference in extra-inning bunt attempts and success rate between home and away teams in these two periods could suggest a fundamentally different approach to extra innings. It may also be a result of home teams practicing the situation more frequently.
NEXT STEPS
This article provides descriptive data to inform discussions on the impact of the automatic runner rule on extra-inning outcomes. Extra-inning games have been shorter with more extra-inning offense since the implementation of the rule. Extra-inning bunt attempts and successes did increase, although home teams drove these patterns. The vast majority of extra-inning bunt attempts came with no outs and a runner on second; in other words, they occurred at the beginning of half-innings to attempt to advance the automatic runner. While these data provide objective fodder to what up to this point has been a mostly subjective set of discussions, there are additional nuances that can further be explored.
The first could be a more thorough investigation of gameplay sequencing to better understand extra-inning strategy. In this article, extra-inning bunts were only analyzed in terms of frequency and isolated situations. The next level of analysis could extend game event sequences to better understand the impact of bunt attempts on scoring runs and winning games.
Relatedly, this article only considered overall extra-inning offensive production and extra-inning bunt attempts and successes separately; it did not analyze the relationship between successful bunts and eventual runs being scored. Specifically, it did not consider how or if the bunt played a part in runs being scored. Did the automatic runner advance to third on a sacrifice bunt but then score on a double or home run, or did he score on a single or sacrifice fly?
Finally, a third sample group could be introduced beginning in 2023. Several rule changes were introduced before that season, including a pitch timer and limited pickoff attempts.10 It would be interesting to investigate how these rule constraints affected the approach to extra-inning gameplay with respect to the automatic runner, if at all.
CONNELLY DOAN, MA, is a data analyst in Las Vegas who has applied his professional skills to the game of baseball, both personally and for RotoBaller.com. He has been a SABR member since 2018 and has contributed to the Baseball Research Journal. He can be reached on X.com (@ConnellyDoan) and via email (doanco01@gmail.com).
NOTES
1 Bill Walker, “New For 2020: MLB Extra Inning Rule,” MiLB, August 30, 2020, https://www.milb.com/news/major-league-baseball-extra-inning-rule.
2 Brett Taylor, “Commission Manfred Suggests Extra-Innings Runner-at-Second Rule Could Be Made Permanent,” Bleacher Nation, November 2, 2022, https://www.bleachernation.com/cubs/2022/11/02/commission-manfred-suggests-extra-innings-runner-at-second-rule-could-be-made-permanent/; Evan Drellich and Eno Sarris, “MLB Makes Extra-Inning Ghost-Runner Rule Permanent, per Sources: How Has It Changed the Game?” The Athletic, February 13, 2023, https://theathletic.com/4191908/2023/02/13/mlb-extra-innings-position-player-rules/.
3 Joe Rivera, “MLB rule changes for 2022: Why controversial extra-inning ghost runner is sticking around (for now),” The Sporting News, March 23, 2022, https://www.sportingnews.com/us/mlb/news/mlb-rule-changes-2022-extra-inning-ghost-runner/pfawy4fmbxzcdlnoolo2bd3p; Associated Press, “MLB, players agree to keep zombie runner for ’22,” USA Today, March 22, 2022, https://www.usatoday.com/story/sports/mlb/2022/03/22/ap-source-mlb-players-agree-to-keep-zombie-runner-for-22/49972101/.
4 Associated Press, “MLB, players agree,” Dayn Perry, “MLB’s extra-innings rule is back in 2021; here’s why baseball should use ties instead,” CBS Sports, April 4, 2021, https://www.cbssports.com/mlb/news/mlbs-extra-innings-rule-is-back-in-2021-heres-why-baseball-should-use-ties-instead/; Abbey Mastracco, “Sorry, Purists: MLB’s New Extra-Inning Rule Is Great and Should Be Here to Stay,” Bleacher Report, April 9, 2021, https://bleacherreport.com/articles/2939660-sorry-purists-mlbs-new-extra-inning-rule-is-great-and-should-be-here-to-stay; Mike Petriello, “To bunt, or not? How to handle new rule in extras,” MLB, July 20, 2020, https://www.mlb.com/news/how-teams-should-strategize-extra-innings-rule-in-mlb-in-2020; Craig Calcaterra, “New extra innings rule will not create a sacrifice bunt-fest,” NBC Sports, July 9, 2020, https://www.nbcsports.com/mlb/news/new-extra-innings-rule-will-not-create-a-sacrifice-bunt-fest.
5 Thomas Harrigan, “MLB, MLBPA agree to 7-inning twin bills,” MLB, July 31, 2020, https://www.mlb.com/news/mlb-mlbpa-agreement-on-seven-inning-doubleheaders; “MLB, union agree on doubleheaders, extra-inning rules,” Reuters, February 8, 2021, https://www.reuters.com/article/us-baseball-mlb-rules-agreement/reports-mlb-union-agree-on-doubleheaders-extra-inning-rules-idUSKBN2A90I3.
6 James LeDoux, “GitHub: jldbc/pybaseball,” GitHub, https://github.com/jldbc/pybaseball, accessed November 26, 2023.
7 “scipy.stats.ttest_ind,” SciPy, https://docs.scipy.org/doc/scipy/reference/generated/scipy.stats.ttest_ind.html, accessed November 26, 2023.
8 Walker, “MLB Extra Inning Rule.”
9 Taylor Bechtold, “Should MLB Teams Be Bunting the Ghost Runner to Third in Extra Innings More Often?” Opta Analyst, March 22, 2023, https://theanalyst.com/na/2023/03/should-mlb-teams-be-bunting-the-ghost-runner-to-third/.
10 Anthony Castrovince, “Pitch timer, shift restrictions among announced rule changes for ’23,” MLB, February 1, 2023, https://www.mlb.com/news/mlb-2023-rule-changes-pitch-timer-larger-bases-shifts.