

Plummeting Batting Averages Are Due to Far More than Infield Shifting: Part Two: Strikeouts
This article was written by Charlie Pavitt
This article was published in Fall 2024 Baseball Research Journal
In the opener of this two-part series, published in Baseball Research Journal 53, Number 1, I described how fielding (infield and outfield shifting) and batting (emphasis on pulling and fly-ball hitting) contributed to the 25-point decrease in batting averages between 2007 and 2022, from .268 to .243. As batting average on balls in play dropped 13 points during that period, it appears that these factors were responsible for about half of the BA slide. It is likely that most of the other half can be attributed to increased strikeout rates. It is helpful to view this issue in long-range historical terms. The following figure, based on data posted at FanGraphs, shows the K trend going back to 1920, when the strategy of swinging hard, exemplified by Babe Ruth, began to take hold (Figure 1).1
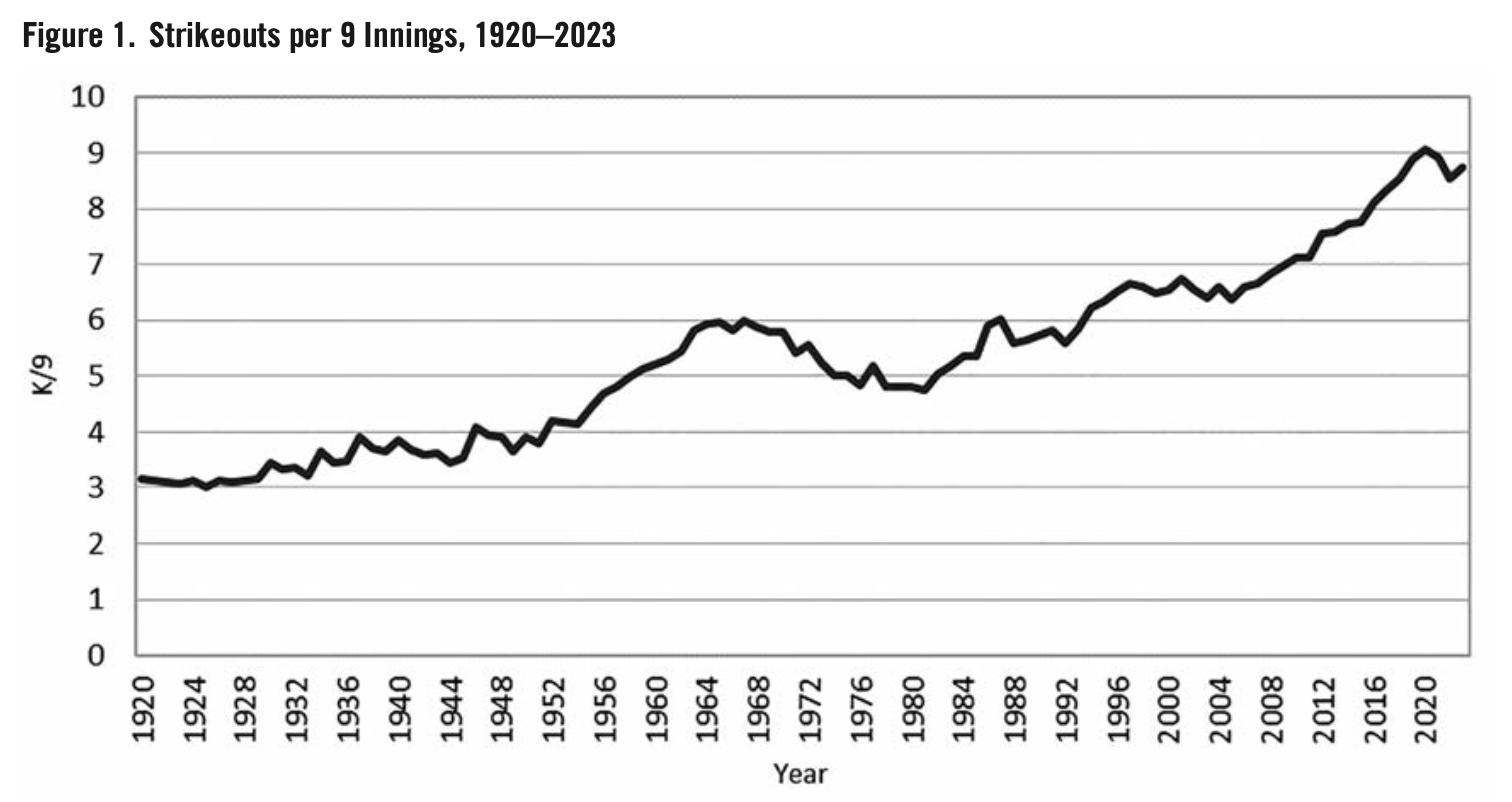
Strikeout rate has generally been going up since the late 1920s. An exception was a drop during the 1970s, such that K rate did not top those for the 1960s until the 1990s. At least part of the reason for that decrease is instructive as we consider strategies to decrease K rate. In 1950, the size of the “rule book strike zone” (hereafter RBSZ) had been set as between the armpits and the top of the knees.2 In 1963, probably due to the perception that offense had become too dominant and therefore that games were too long, the Lords of Baseball increased its size, moving its upper boundary to the top of the shoulders and its lower boundary to the bottom of the knees.2 Strikeout rates immediately went up, while batting averages and walk and homer rates went down. After remaining about the same for a while, these indices dropped again in 1967 and reached their nadir in 1968, which has come to be known as “the Year of the Pitcher.” Run scoring was the lowest since 1908 at 3.42 per team per game, and batting averages were the lowest of the twentieth century at .237. Homers (0.61 per team per game) and walk rate (7.6%) were the lowest in decades. Of 76 pitchers qualifying for the ERA crown (162 or more IP), seven had an ERA below 2.00, led by Bob Gibson at 1.12. Forty-two pitchers had an ERA in the twos, 25 in the threes, and only two were above 4.00.
The Lords of Baseball, seemingly realizing that most fans like offense and that pitcher dominance would decrease their interest, returned the RBSZ to its earlier size for 1969. In addition, the height of the pitching mound was lowered from 15 inches to 10.3 Run scoring (4.07), batting average (.248), walk (9.1%), and homer (0.8) rates all climbed. With some year-to-year fluctuation, offense drifted upward for the next decade.
Relevant to our interests, the impact on strikeouts took a while to plateau. Strikeout rates per 9 innings, which per Fangraphs were over 5.8 from 1963 to 1969, bottomed out at around 4.8 between 1978 and 1981 before beginning to rise again. Note that after leveling out between 1996 and 2006 at around 6.5 per 9 innings, K rate increased sharply, staying at 8.5 or more in 2018–23 and as high as 8.9 in 2021, the last season with no designated hitter in the National League. In the NL, some of the noticeable drops may have been due to the adoption of the DH, but the AL has seen decreases as well.
The next four sections delve into reasons behind this increase, concentrating on 2007 through 2023 due to the drastic drop in batting average over those years. In short, these include changes in batter behavior, pitch type proportions, pitch velocity and movement, the size and location of the called strike zone, with its implications for pitch location and catcher framing, and foul-ball hitting. Along with summarizing past research, I will be presenting analysis based on Fan-Graphs seasonal data for pitchers accumulating a minimum of 162 innings between 2018 and 2023, excepting the 2020 COVID-19 season, in which no pitchers reached that level of activity. These data include individual pitcher-level information gathered by Statcast across 247 pitcher-seasons for the six most prevalent pitch types compiled by Statcast and listed by FanGraphs, each with annual usage rates of at least 5 percent and as a group comprising more than 95 percent of the total: fastballs (either generic or four-seamed), cutters, sinkers (including those classified separately as two-seamed fastballs in 2018 and 2019), sliders, curves, and changeups. As not all pitchers used each, sample sizes for each pitch type were generally lower that 247, particularly for cutters.4 Additional pitch location and swinging strike rate data come directly from Statcast via Baseball Savant.5
BATTER BEHAVIOR
Changes in batter behavior parallel to those described in part 1 of this series have been contributing to the rise in strikeouts. Using the accepted abbreviations for the included metrics, the following two figures displaying batter plate discipline measures begin our examination (data from Fangraphs; see Slowinski for a description of the metrics).6 In this and some of the subsequent diagrams, I use ratios as compared with 2007, because, given the large variation in actual percentages among the included indices, changes over time would otherwise become masked (Figures 2 and 3).
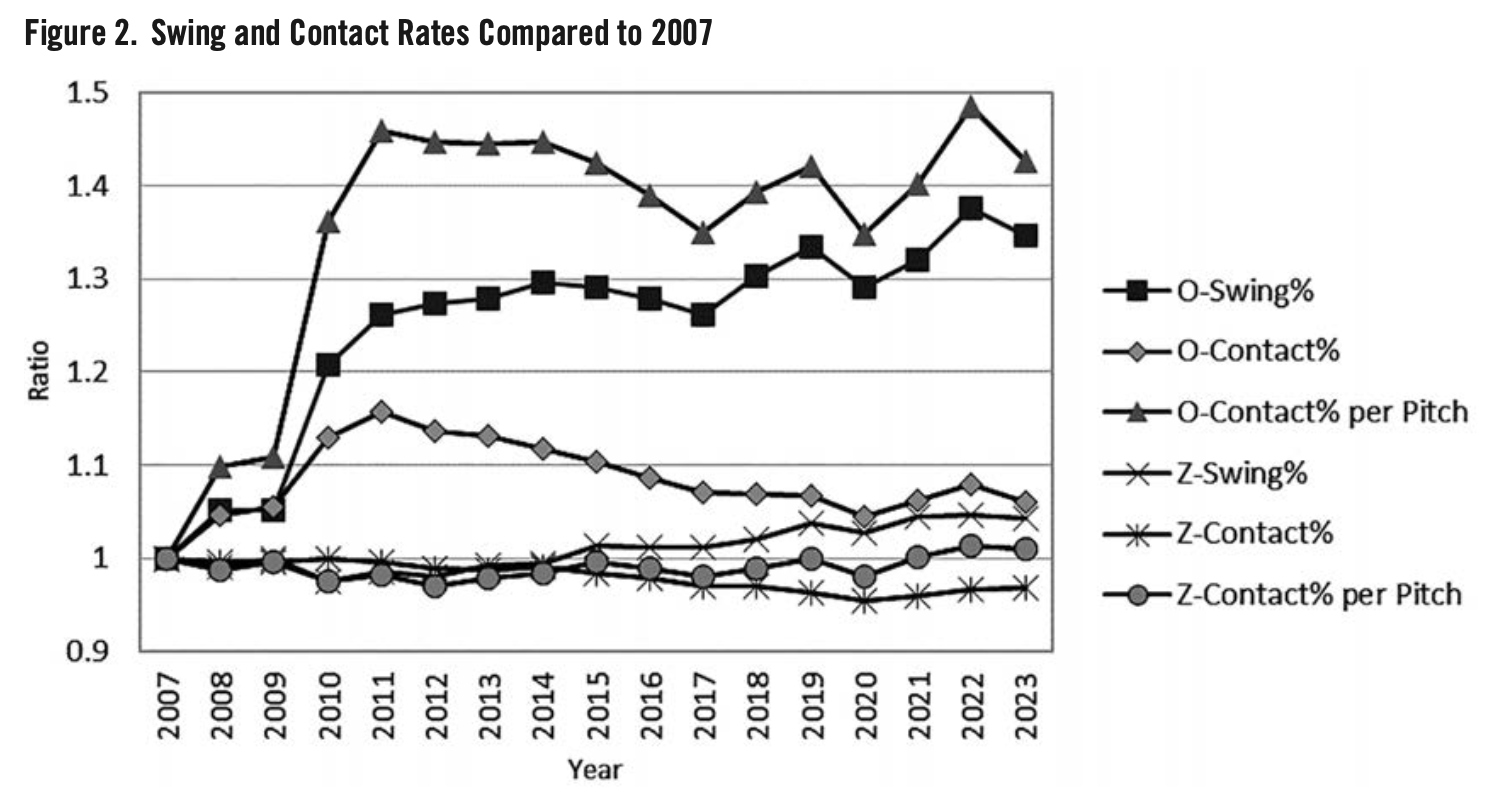
O-Swing% and O-Contact% are, respectively, the percentage of pitches outside of the RBSZ that are swung at and the percentage of swings on which contact occurred. By multiplying the first of these (swing per pitch) by the second (contact per swing), I was able to add a line showing contact rate per pitch for non-strike pitches. Z-Swing%, Z-Contact%, and Z-Contact per Pitch% are the counterparts for pitches within the RBSZ. SwStr% and CStr% are the percentage of swinging and called strikes per pitch. Finally, Zone% is the percentage of pitches within the RBSZ.
The picture these data draw is clear. Over the relevant seasons, batters swung more often at pitches both inside (66% in 2007 to 68.8% in 2023) and outside (23.7% in 2007 to 31.9% in 2023) of the RBSZ, and contact rate drifted downward starting in 2011 for those outside (68% down to 62.3% in 2023) and, beginning in 2007, those inside (88.2% down to 85.4% in 2023) the RBSZ. Overall, as making less contact has canceled out the impact of swinging more often, contact rates per pitch stayed within a couple of percentage points from 20 since 2010 for pitches outside and in the mid- and upper-50s during the entire era for pitches inside of the RBSZ (let’s call them “real balls” and “real strikes”). As Figure 3 shows, pitches in the strike zone are being called strikes more often.
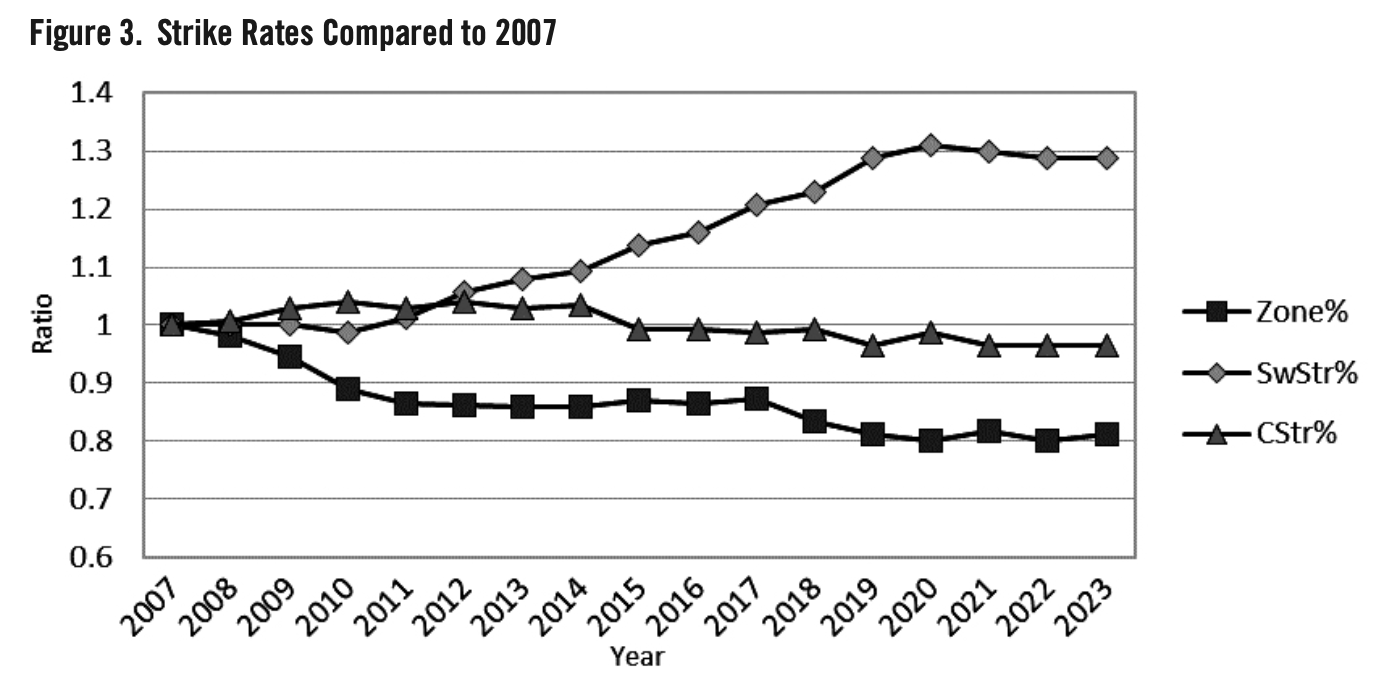
But pitching strategy changed, as pitchers have been placing more and more pitches outside of the RBSZ (real strikes 51.5% in 2007, 41.9% in 2023). Edwards, using figures for 2002 through 2018, found the percentage of pitches in the RBSZ to correlate very strongly negatively (–0.90) with K rate using the 17 relevant seasons as the data.7 This method ignores variation in both metrics within seasons, in so doing artificially inflating the correlation, but the implication that more real balls increased strikeouts is certainly valid.
Turning to the 2018–23 pitcher-level data, as contact rate per pitch and per swing were much higher for real strikes than for real balls, the overall swinging strike rate went up markedly (8.7% in 2007 to 11.2% in 2023). Perhaps due to more real balls, the called strike rate went down, but at a far slower pace than the swing strike rate went up (17.% in 2007 down to 16.4% in 2023). As pitches in the RBSZ have made up a decreasing percentage of total pitches, the outcome has been a lot more swinging strikes, and so a lot more strikeouts. The swinging strike/strikeout relationship, according to Carleton, correlated at 0.71 for 2002 through 2016.8 Similarly, in the 2018–23 pitcher-level dataset, strikeout rate correlated with O-Contact% at –0.74 and with Z-Contact% at –0.78, and with O-Contact per Pitch% at –0.42 and Z-Contact per Pitch at –0.62.
PITCH TYPE
Batters are, of course, reacting to the pitches they face; let us look next at the progression of average pitch type proportions between 2008 (the first year for which relevant Statcast data are available) and 2023 (Figure 4).9
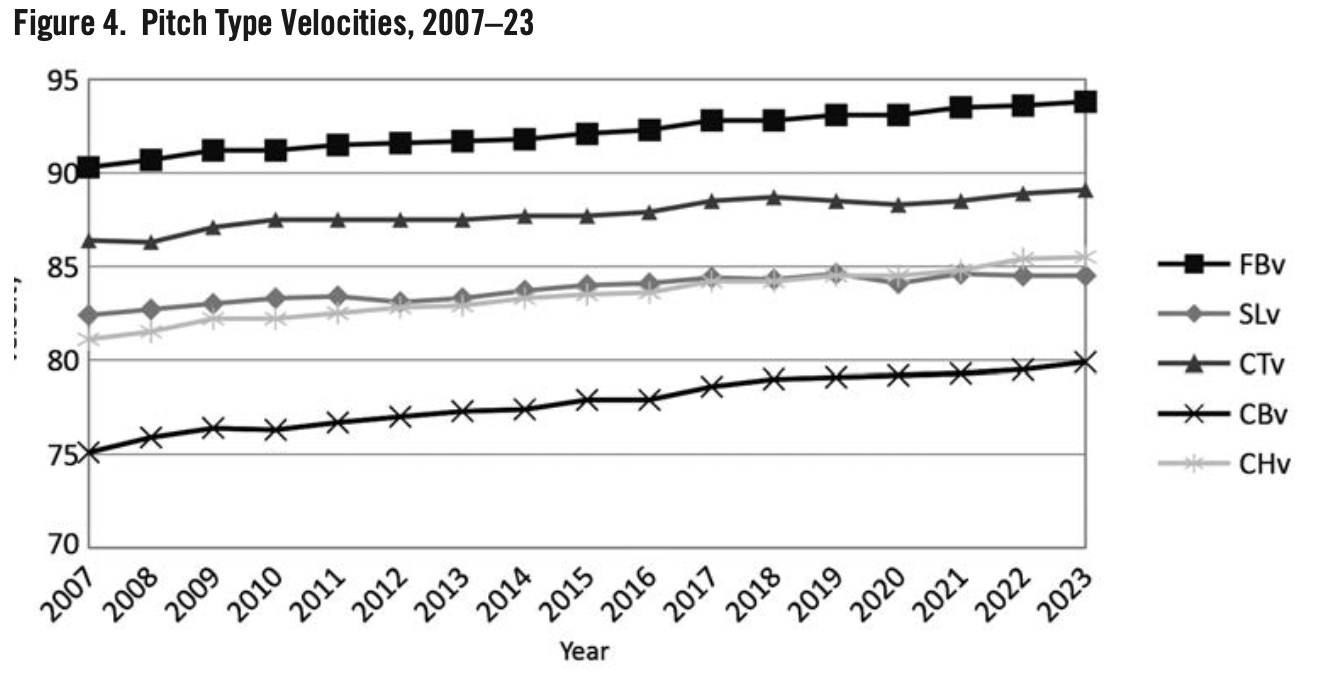
Fastball percentages remain the highest throughout, staying steady until a recent drop. Sinker use has plummeted, with sliders and in particular cutters taking up much of the slack. Curves fluctuated a bit over the years before a recent downturn, whereas changeups have gone up a fraction of a percent over the interim.
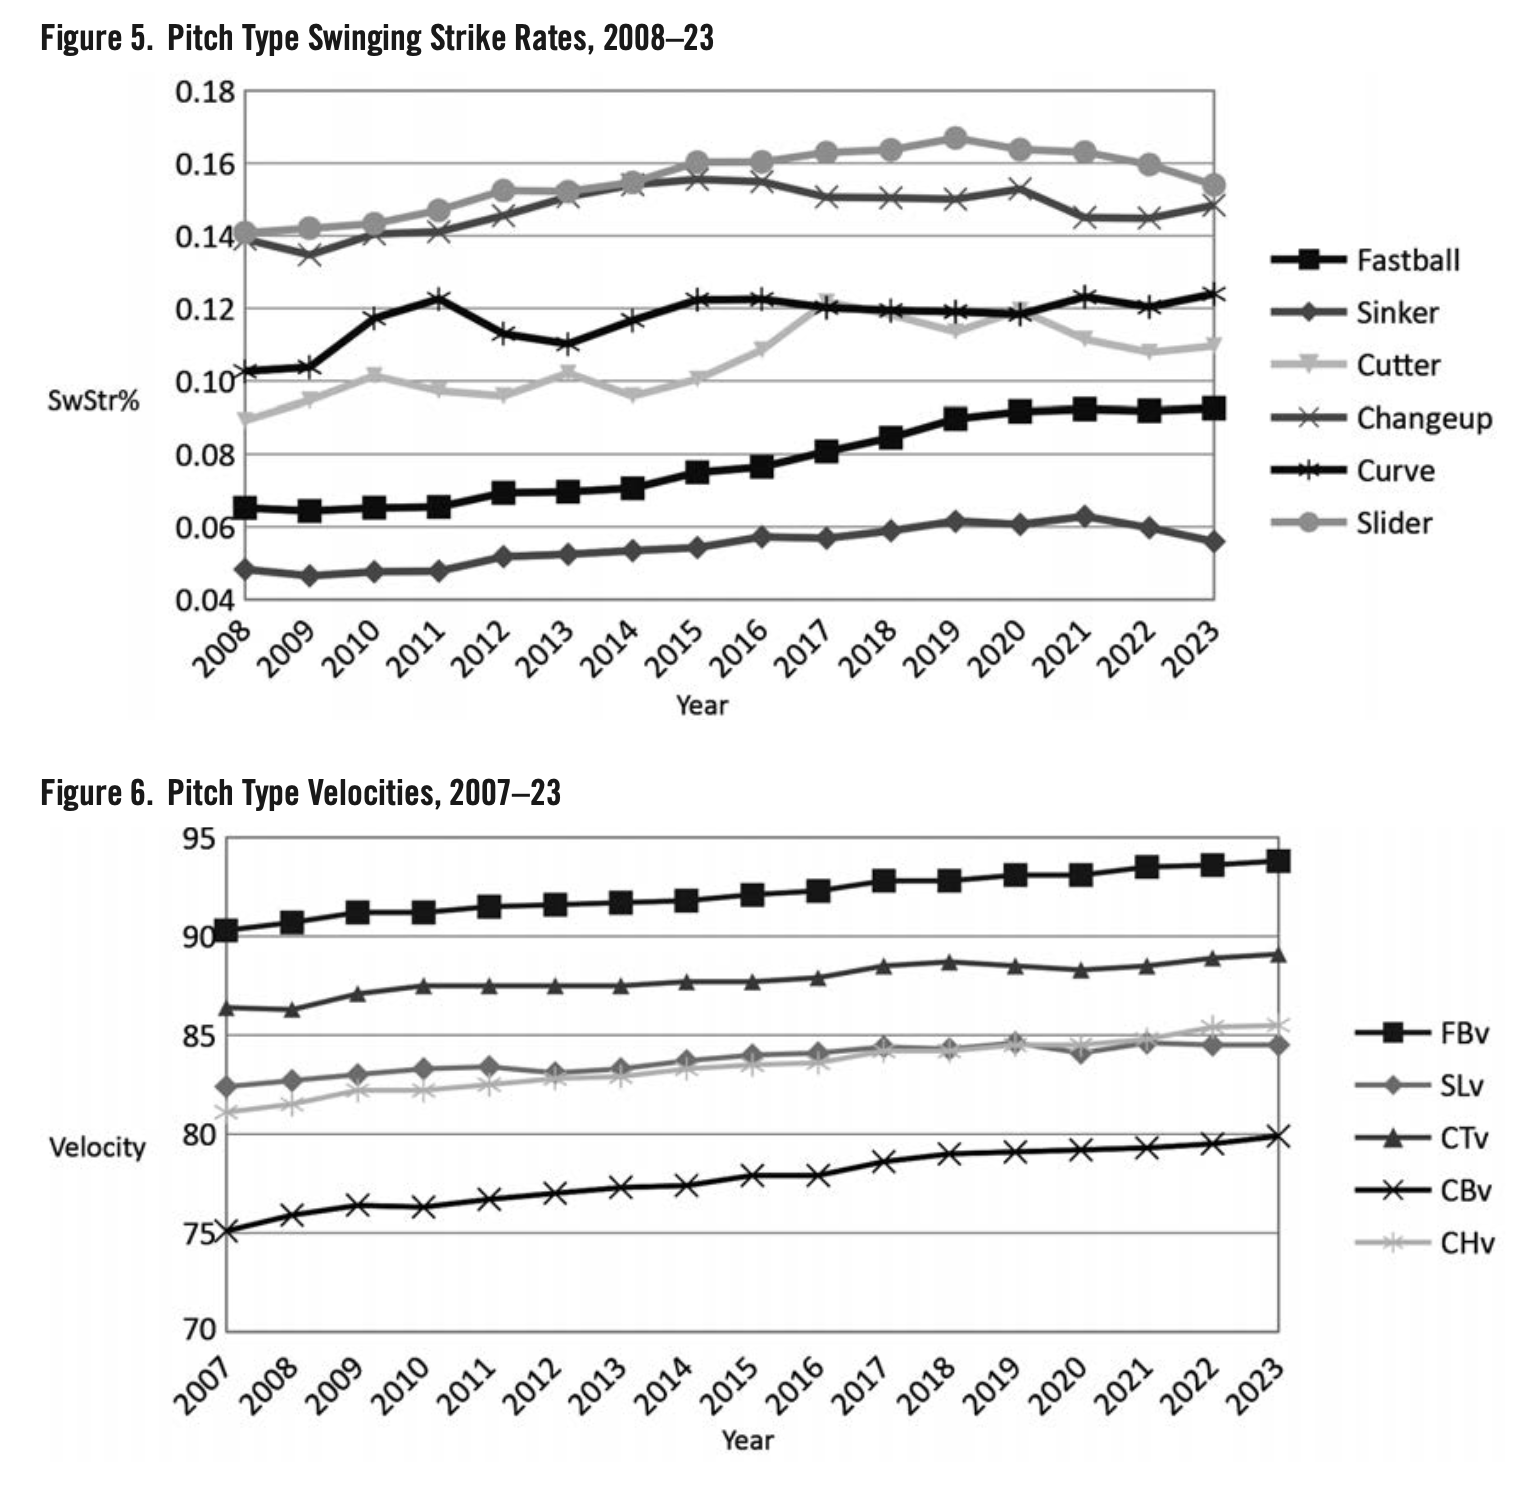
What is critical here are swinging strike rates for each pitch type. Figure 5 data are directly from Statcast. Swinging strike rate has increased for every pitch type. Comparing across them, the slider, one of the two pitches with increased usage, had the highest SwStr%. With decreased usage, sinkers had the lowest. This is consistent with the just-shown increase in slider use and decrease in sinker use across those years. The other pitch type with markedly increased usage, cutters, also had SwStr% rates well above those for sinkers. Apparently, pitch type repertoire has shifted in favor of pitches more conducive to whiffs.
PITCH VELOCITY AND MOVEMENT
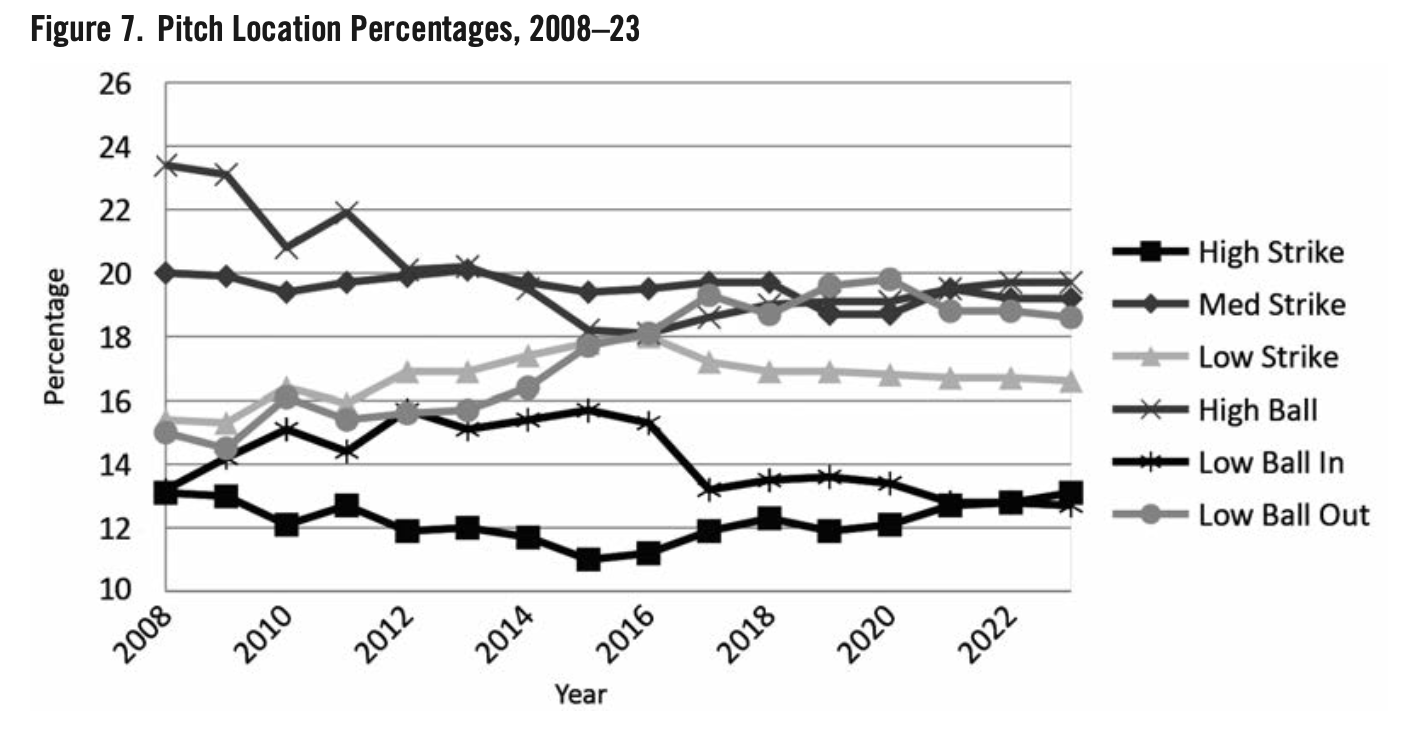
The impact of pitch velocity on strikeout rate appears to be straightforward: faster pitches, more strikeouts. Figure 6 displays average velocities for five pitch types from 2007 through 2023 (Statcast data posted on Fan-Graphs). Although the rate of increase might be slowing, every pitch type went up between 2.1 and 4.8 miles per hour over the 17 years included here.
In my analysis of 2018–23 pitcher-level data, higher average pitch velocities were correlated with higher strikeout rates in the following order of relationship strength: fastballs at +0.59, sinkers at +0.54, cutters at +0.43, sliders at +0.32, changeups at +0.28, and curveballs at +0.22. Each pitch type velocity was analogously if negatively correlated with O-Contact%, and all but curves and changeups with Z-Contact%. The impact of pitch velocity is not news; as earlier work uncovered almost perfect relationships between it and SwStr% (Silver at 0.89 for every fastball in 2008) and K rate (Edwards, using the same method as described above, at 0.933).10 Piling on the evidence: Seidman saw strike percentages rise steadily from 44.6 percent to 49.3 percent as fastball velocity rose from 92 to at least 98 mph during 2007; Clemens (2015–19 data) uncovered a median percentage increase of 3.1 in K rate for 23 pitchers who gained at least 1 mph between seasons in four-seamer velocity; and Trueblood observed an average of 0.7 mph difference between pitches resulting in swinging strikes versus batted balls in 2023.11
In contrast, the impact of pitch movement on strikeout rate is weak and tied up with pitch velocity. In the 2018–23 pitcher-level dataset, after reversing the sign for the 64 pitcher-seasons thrown by left-handers, the highest correlations with K rate are +0.18 for fastball horizontal movement and +0.25 for fastball vertical movement. Moreover, horizontal and vertical movement were negatively correlated for cutters (–0.50), sliders (–0.40), sinkers (–0.34), and fastballs (–0.13). This tradeoff was observed as far back as 2007, with Seidman noting vertical movement increasing and horizontal movement decreasing as fastball velocity and strikeout rate went up.12 The quest for higher pitch spin rates may be involved, as Pemstein, with data covering at least 2009 through 2014, discovered that more spin resulted in increased movement but greater decreases in velocity between release point and the plate.13 Hale, based on 2009 to 2013 data, displayed a diagram showing a three-way association among fastball movement (four- and two-seamers combined), fastball velocity, and swinging strike rate.14 For fastballs with high velocity (96–100 mph), SwStr% were generally over 50 percent with one to three inches of movement and decreased to about 20 percent with 10 inches of movement. In contrast, swing-and-miss rates increased with higher movement for lower velocity pitches, up to a point where fastballs in the mid-80s moving 8 to 10 inches had SwStr% close to 40 percent. If Hale’s findings are valid, the fastest pitchers want little movement while the slowest pitchers want a lot. Unfortunately, as Hale did not distinguish between vertical and horizontal movement, it is not clear which was more responsible for these data.
Changeups have been a glaring exception. In the Statcast/FanGraphs 2007–23 data, along with increasing in velocity at a greater rate than fastballs (4.4 vs. 3.5 mph), horizontal and vertical movement in changeups both increased; the former from 0.9 inches to 2.8 inches of movement toward left-handed batters and the latter from 3.8 inches above to 2.2 inches above what a pitch with no spin (gyroballs) would move; in other words, more downward motion. Analogously, and unlike most other pitch types, the two directions were positively correlated with one another (+0.30) in the 2018–23 pitcher-level dataset. Pemstein again provided a relevant reason for the difference; SwStr% at intermediate spin rates was highest for changeups but lowest for other pitch types.15
In addition, Pavlidis, with 2011–12 data, uncovered other clues when examining the relationship between changeups and fastballs.16 To begin, he calculated a positive (0.28) pitcher-level correlation between fastball velocity and swinging strike rate on changeups. The fastball velocity increase over time implies higher changeup SwSt%. Pavlidis also noted a negative correlation (–0.45) between the usage ratio of fastballs to changeups. As fastball usage decreased and changeup usage remained the same over time, the fastball/changeup ratio became smaller; and as SwStr% is higher in changeups than fastballs, more swinging strikes are again implied. Finally, the difference in vertical movement between changeups and fastballs correlated with swinging strike rates at 0.41. As vertical movement for fastballs stayed close to constant, between 8 and 8½ inches, while that for changeups increased, the difference would have gotten larger, once again meaning higher swinging strike rates.
CALLED STRIKE ZONE LOCATIONS AND ITS IMPLICATIONS
We turn next to pitch location. The reason that I have used the specific term “rule book strike zone” (RBSZ) is to distinguish it from the “called strike zone” (CSZ), which is a product of umpire judgment (the terminology comes from Zimmerman, Tang, and Huang).17 The two are not synonymous. This is speculation, but I wonder if one of the reasons for the delay in RBSZ changes in 1963 and 1969 having their full impact on offense for a few years was that it took some time for umpires to change their CSZ in response to the RBSZ revisions.
Pitch location data were not available then, but once they were, researchers began examining the RBSZ/CSZ relationship. Walsh made the first serious measurement of the CSZ using a dataset that was tiny (80,000 pitches) compared to what was available a few years later.18 Horizontally, the CSZ was on average centered on the RBSZ but two inches wider on both sides for right-handed hitters; for lefties, it was accurate on the inside but 4½ inches too large on the outside. Vertically, the bottom of the CSZ was almost four inches higher and the top more than an inch lower for righty batters and almost 3½ inches lower for lefty batters. As a consequence, the CSZ on average was fatter horizontally, shorter on both vertical ends, and, with those taken together, smaller (475 square inches for right-handed batters, 492 square inches for left-handed batters) than the RBSZ (527 square inches).
By 2011, with more than a million pitches at researchers’ disposal, it was clear that the CSZ was not only inconsistent with the RBSZ but shaped differently. In two dimensions, the RBSZ is a rectangle whereas Zimmerman et al. (2008–16 data) described the CSZ as a “superellipse,” a shape with both elliptical and rectangular features (see https://en.wikipedia.org/wiki/Superellipse for a description).19 This shape was still present in Porat’s examination in 2019.20
Over the years, due to the availability of pitch-location data and pressure on umpires from the commissioner’s office to call pitches more accurately, the CSZ has steadily become more in line with the RBSZ. Research on pitch-call accuracy has produced ever-increasing figures: 85.6 percent in 2007, 88.14 percent between 2008 and 2016, reaching 90 percent in 2017, and still increasing as I write this—it was 92.8 percent in 2023.21 A CSZ better reflecting the RBSZ would be larger than earlier, which alone probably increased strikeout rates. Over these years, the CSZ shrunk horizontally, but I want to direct our attention specifically to the vertical dimension. Table 1, below, is a relevant table from Roegele’s article, measured in square inches, with the low part of the CSZ defined as less than 21 inches from the ground.22
The low part of the CSZ increased markedly between 2009 and 2014. Strike calls on pitches between 1½ and 2 feet off the ground increased from 29.6 to 43.8 percent from 2009 through 2013.23 Brian Mills concluded that the bottom part of the strike zone had increased by three inches between 2008 and 2014.24 As umpires called more low strikes, pitchers responded by throwing more pitches in that location. Between 2007 and 2013, average pitch heights went down steadily from 28.92 inches in 2007 to 27.61 inches in 2013, with the proportion of pitches in that additional three-inch zone increasing from about 22 percent to about 27.5 percent. Batters reacted in turn by raising swing rates on pitches in that zone from about 31 percent to about 34.5 percent, but with the odds of making contact 73.3 percent lower than for pitches above it. Compared to 2008, in 2013 there were 974 more called strikeouts and 685 fewer walks on the final pitch of plate appearances when that pitch was located in the parts of the CSZ that changed during that time period.25 Mills estimated that the overall improvement in umpire accuracy accounted for between 3.3 and 8.9 percent of the total strikeout rise between 2007 and 2013, with more strike calls on lower pitches responsible for most of this jump.26
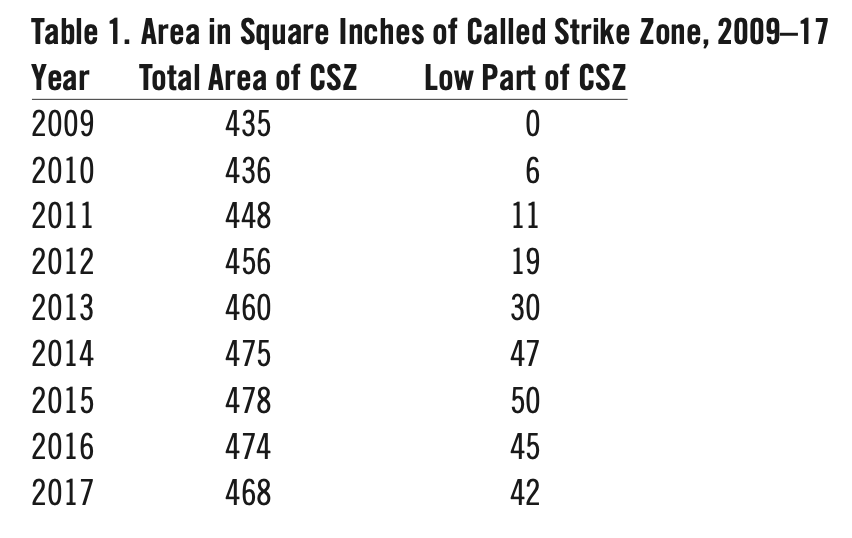
Returning to Table 1, the increase in the low part of the CSZ slowed down in 2015 and reversed a bit the next two years. At the same time, pitch locations began a partial rebound toward the top. Further, pitchers began responding to where swinging-strike rates were the highest. Figure 6 displays vertical pitch locations for the entire 2008 through 2023 era. Figure 8 shows swinging strike rates at four-year increments for the same period.
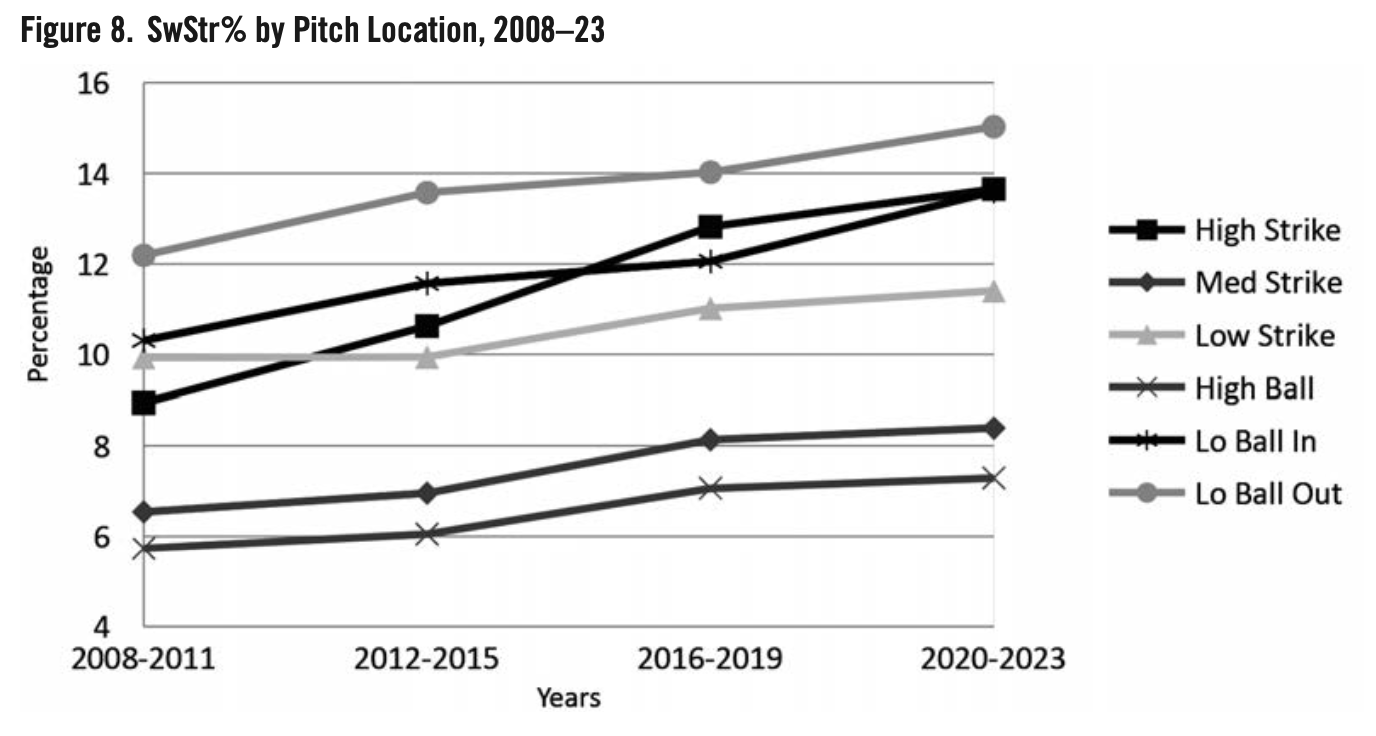
By the end of that time frame, the proportion of high strikes (Zones 1, 2, and 3 in the standard location charts) had rebounded back to its beginning level, but that for high balls (Zones 11 and 12) was still about 3.5 percent lower, low strikes (Zones 7, 8, and 9) about 1.5 percent higher, and low balls outside (Zone 14) about 3.5 percent higher than at the beginning. Now, juxtapose the locations across the two tables. Through 2014, low balls both inside (Zone 13) and outside increased; consistently, these had the highest swinging-strike percentages. Afterward, SwStr% for high strikes rose at a faster pace than the others. In response, its usage proportion went up. In 2017, teams apparently noticed that low balls outside had consistently higher SwStr% than low balls inside; the latter’s proportion collapsed by 2.1 percent in one year whereas that of the former went up by 1.9 percent between 2015 and 2019.
Finally, looking back at the metrics displayed in Figure 3, between 2007 and 2023, the percentage of pitches in the RBSZ decreased by a good 10 percent while the drop in called-strike rate went down by only about half of a percentage point. The juxtaposition between the two implies that called strikes outside of the RBSZ probably went up. It is likely that the increased attention to pitch framing by catchers and the teams they played for was involved in this rise. Certainly, at the beginning of this era, the variation in framing skills across catchers was substantial. Kim and King, looking back to 2008 and 2009, calculated that catchers with framing rates one standard deviation better than average received an overall 7 percent increase in the number of called strikes on pitches outside of the RBSZ and a 10 percent decrease in the number of called balls inside the zone.27 Not surprisingly, as Carleton pointed out, the better the framing, the more strikeouts.28
Again, batters responded. Arthur compared two models predicting swing probability given called strike probabilities for 2014, one including the count and pitch location, and the other adding to those two the identity of the catcher.29 The second was a better fit for the data, which implies that batters’ decisions concerning whether to swing on borderline pitches were influenced by the framing reputation of the catcher. Batters were less willing to swing at borderline pitches if they believed that the catchers were less likely to get a strike call. As the importance of framing skills has become entrenched in our consciousness, front offices are becoming less and less willing to accept a poor framing catcher. Sullivan noted that the standard deviation across teams in pitch framing as estimated by Baseball Prospectus dropped from about 21 in 2011 to about 12 in 2016.30 This decrease was almost certainly due to the disappearance of poor framers, which means that the tendencies for more called strikes and strikeouts with good framing catchers was becoming more widespread across the major leagues.
FOUL BALLS
Changes over time in foul ball occurrence have had at least some impact on strikeout rates. The foul ball/strikeout relationship is complicated by the fact that fouls hit on zero- and one-strike counts appear to serve a different function than those during two-strike counts, with the former more prevalent for strikeout-prone sluggers and the latter more abundant for strikeout-averse contact hitters. Thus, the foul/strikeout association has been positive for the former and negative for the latter.31 Most research has suggested that, overall, the prolific foul ball hitter has resembled the slugger more than the contact hitter; for example, Fink, for batters with at least 200 swings in 2021, determined that fouls per swing correlated positively with K rate at 0.17.32 Although not a large association, a regression equation including both fouls per swing and swinging strike rate increased variance accounted for in strikeout rate to 79 percent from the 69 percent accounted for by SwStr% alone. Chamberlain discovered that, between 2017 and mid-June 2019, K rate was 12 percent for plate appearances with no fouls, 31.3 percent for one foul, and 39.9 and 38.5 percent for two and three fouls; it did dip to 35 percent for 4 or more fouls, perhaps due to greater prevalence of contact hitters achieving this many.33
The proportion of contacted balls that went foul has been increasing since at least 1993, from under 47 percent in 2010 up to 51 percent in 2023.34 As shown in Figure 2 above, contact rate per pitch remained fairly steady over that period while swing rates went up. At the same time, fouls per swing were also stable at close to 40 percent.35 All of this implies that the foul ball rise was associated with the increased swing rate. In addition, Carleton demonstrated that between 1993 and 2023, foul ball rates increased approximately linearly with higher pitch velocities, from about 47 percent of batted balls in the 88–88.99 mph bin to about 65 percent at 100 mph and faster.36 Carleton believed that the rise in pitch velocity during those years pictured in Figure 6 was part of the reason for the foul ball increase. In addition, between 2015 and 2021, swing rates increased at about a linear rate with faster pitches, from 41 percent at the 88–88.99 range to 56 percent at 100+.37 Putting this all together, as pitch velocity increased and batters swung more, the increase in pitch velocity probably increased the likelihood of batted balls becoming foul, and the additional strikes resulted in a few more strikeouts. As Andrews recently noted, “A foul ball has never been closer to a whiff than it is today.”38
CONCLUSION
To summarize both parts of this study: The 25-point decrease in mean batting average between 2007 and 2022 was a result of several factors; changes in strategies for fielding (infield and outfield shifting), batting (increased swinging, more fly balls, more pulling, with the byproduct of more popups, and more foul balls), and pitching (higher pitch velocities, more pitches to locations with higher swinging-strike rates, particularly outside of the RBSZ, with fewer sinkers, more sliders and cutters, and more effective changeups). More accurate umpiring and better catcher framing conspired to increase swing rate on pitches outside of the RBSZ and harder-to-hit pitches within it.39
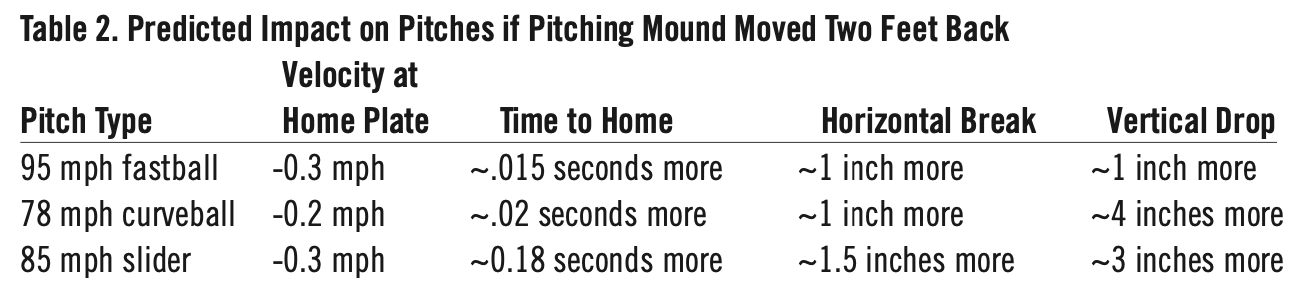
The banning of the full infield shift had some impact on batting averages in 2023, but if the Lords of Baseball want to get BAs back to their pre-2007 levels, it will not be sufficient. They might consider other options. Most of the other relevant factors are not subject to legislation, with restrictions on outfield shifting the only possibility. As described earlier, when faced with less offense than desired in 1969, the Lords of Baseball lowered the mound and shrunk the strike zone. These moves certainly had a positive impact on offense, but part of that effect was an increase in home-run rate, and I would venture to guess that this would not be desirable at present. One proposal that was tried was moving the pitching mound back one foot partway through the 2021 Atlantic League season. Before the experiment, and based on Alan Nathan’s Trajectory Calculator, Arthur made the following predictions for a two-foot shift, as shown in Table 2.40
Given the loss of velocity and the greater distance to cover, meaning the calculated increase in pitch flight time to home, Schoenfield and Passan estimated the visual equivalent of a loss of three mph, with the predicted resulting increase of 26 BA, 31 OBA, and 68 SLG points, which would change the face of the game.41 However, the Atlantic League experiment backfired, with the strikeout, fly ball, and popup rates increasing and line-drive rate decreasing, resulting in an eight-point BA drop after the move.42 Speculation was that added pitch movement canceled out any lower pitch velocity. The experiment was not repeated in 2022.
CHARLIE PAVITT has been a SABR member since 1983. His Statistical Baseball Research Bibliography is now integrated into SABR’s Baseball Index; his Sabermetric Research Literature Review (https://charliepavitt.home.blog/) is intended to be a complete survey of the literature and consistently gets updated. Charlie is responsible for defining the sabermetric terms in the fourth edition of the Dickson Baseball Dictionary. Online version: (https://www.baseball-almanac.com/dictionary.php).
ACKNOWLEDGMENTS
Thanks to Dick Cramer for writing suggestions, Pete Palmer for always reading what I write, the two anonymous reviewers for their work, and most of all Cliff Blau, fact checker.
NOTES
1 “Major League Leaders, Pitching, League Stats, 2007–23,” FanGraphs, https://www.fangraphs.com/leaders/major-league?pos=all&stats=pit&lg=all&qual=0&type=1&month=0&ind=0&rost=0&age=0&filter=&players=0&startdate=&enddate=&team=0%2Css&season1=2007&season=2023&sortcol=0&sortdir=default&pagenum=1.
2 Steve Treder, “Re-Imagining the Big Zone 1960s, Part 1: 1963-1965,” FanGraphs, November 30, 2004, https://tht.fangraphs.com/re-imagining-the-big-zone-sixties-part-1-1963-1965/.
3 Baseball Almanac, “Baseball Rule Changes,” https://www.baseball-almanac.com/rulechng.shtml, accessed August 16, 2024.
4 These were 240 for fastball, 228 for changeup, 204 for sinker, 200 for slider, 180 for curve, and 110 for cutter.
5 https://baseballsavant.mlb.com/statcast_search.
6 Piper Slowinski, “Plate Discipline (O-Swing%, Z-Swing%, etc.),” FanGraphs, February 18, 2010, https://library.fangraphs.com/offense/plate-discipline/.
7 Craig Edwards, “Don’t Blame Hitters for All the Strikeouts” FanGraphs, June 6, 2018, https://blogs.fangraphs.com/dont-blame-hitters-for-all-the-strikeouts/.
8 Russell A. Carleton, “Fire Up the Time Machine,” Baseball Prospectus, June 6, 2017, https://www.baseballprospectus.com/news/article/31995/baseball-therapy-fire-up-the-time-machine/.
9 Pre-Statcast pitch-type proportions reported by FanGraphs for 2007 are so markedly different from afterward that different classification criteria must have been in use.
10 Mike Silver, “Breaking Down a Pitcher’s Stuff: Fastball Velocity,” Statistically Speaking Archive, September 29, 2009, https://statspeakmvn.wordpress.com/2009/09/29/breaking-down-a-pitchers-stuff-fastball-velocity/; Edwards, “Don’t Blame Hitters.”
11 Eric Seidman, “Breaking Down the Heater,” Statistically Speaking Archive, June 19, 2008, https://statspeakmvn.wordpress.com/2008/06/19/breaking-down-the-heater/; Ben Clemens, “What Happens a Year After a Velocity Spike?” FanGraphs, December 21, 2020, https://blogs.fangraphs.com/what-happens-the-year-after-a-velocity-spike/; Matthew Trueblood, “Does it Matter How Fast the Fastballs You Hit (and Miss) Are?” Baseball Prospectus, January 8, 2024, https://www.baseballprospectus.com/news/article/87555/flyover-country-fastball-speeds/.
12 Seidman, “Does Movement Influence BABIP?” Statistically Speaking Archive, June 26, 2008, https://statspeakmvn.wordpress.com/2008/06/26/does-movement-influence-babip/.
13 Jonah Pemstein, “On Rotation, Part 1: The Effects of Spin Rate on the Flight of a Pitch,” FanGraphs, June 1, 2015, https://blogs.fangraphs.com/the-effects-of-spin-on-the-flight-of-a-pitch/.
14 Jonathan Hale, “Is Speed Enough?: A PITCHf/x Look at the Effect of Fastball Velocity and Movement,” Baseball Prospectus, October 30, 2013, https://www.baseballprospectus.com/news/article/22139/baseball-proguestus-is-speed-enough-a-pitchfx-look-at-the-effect-of-fastball-velocity-and-movement/.
15 Pemstein, “On Rotation, Part 2: The Effects of Spin on Pitch Outcomes,” FanGraphs, June 3, 2015, https://blogs.fangraphs.com/on-rotation-part-2-the-effects-of-spin-on-pitch-outcomes/.
16 Harry Pavlidis, “What Makes a Good Changeup: An Investigation, Part 1,” Baseball Prospectus, May 10, 2013, https://www.baseballprospectus.com/news/article/20539/what-makes-a-good-changeup-an-investigation-part-1/.
17 Dale L. Zimmerman, Jun Tang, and Rui Huang, “Outline Analyses of the Called Strike Zone in Major League Baseball,” Annals of Applied Statistics 13, no. 4 (2019), 2416–51.
18 John Walsh, “The Eye of the Umpire,” July 25, 2007, FanGraphs, https://tht.fangraphs.com/the-eye-of-the-umpire/.
19 Zimmerman, Tang, and Huang, “Outline Analyses”
20 Eli Ben-Porat, “Rethinking the Strike Zone: It’s Not a Square,” FanGraphs, February 19, 2019, https://tht.fangraphs.com/rethinking-the-strike-zone-its-not-a-square/.
21 Tobias J. Moskowitz and L. Jon Wertheim. Scorecasting: The Hidden Influences Behind How Sports Are Played and Games Are Won (New York: Crown Archetype, 2011); James Zhan, John Polimeni, and Luke Gerstner, “Measuring the Impact of Robotic Umpires,” MIT Sloan Sports Analytics Conference, March 6–7, 2020, https://www.sloansportsconference.com/research-papers/measuring-the-impact-of-robotic-umpires; Davy Andrews, “Pitch Framing is Evolving Along with the Strike Zone.” FanGraphs, February 27, 2023, https://blogs.fangraphs.com/pitch-framing-is-evolving-along-with-the-strike-zone/; Andrews, “Strike three?! Let’s check in on umpire accuracy,” FanGraphs, February 1, 2024, https://blogs.fangraphs.com/strike-three-lets-check-in-on-umpire-accuracy/.
22 Jon Roegele, “The 2017 Strike Zone,” FanGraphs, March 28, 2018, https://tht.fangraphs.com/the-2017-strike-zone/.
23 Roegele, “The Living Strike Zone,” Baseball Prospectus, July 24, 2013, https://www.baseballprospectus.com/news/article/21262/baseball-proguestus-the-living-strike-zone/.
24 Brian Mills, “Expert Workers, Performance Standards, and On-the-Job Training: Evaluating Major League Baseball Umpires,” Social Science Research Network, August 27, 2014, https://ssrn.com/abstract=2478447 or http://dx.doi.org/10.2139/ssrn.2478447; see also Brian M. Mills, “Policy Changes in Major League Baseball: Improved Agent Behavior and Ancillary Productivity Outcomes,” Economic Inquiry 55, no. 2 (2017), 1104–18.
25 Roegele, “The Strike Zone During the PITCHf/x Era,” in The Hardball Times Baseball Annual 2014, ed. Dave Studenmund, Paul Swydan (FanGraphs, 2014), 233–44.
26 Mills, “Policy Changes in Major League Baseball.”
27 Jerry W. Kim and Brayden G. King, “Seeing Stars: Matthew Effects and Status Bias in Major League Baseball Umpiring,” Management Science 60, no. 11 (2014), 2619–44.
28 Carleton, “The Dark Side of Pitch Framing?” Baseball Prospectus, February 2, 2016, https://www.baseballprospectus.com/news/article/28350/baseball-therapy-the-dark-side-of-pitch-framing/.
29 Robert Arthur, “How Jonathan Lucroy Makes Batters Swing at Bad Pitches,” Baseball Prospectus, February 11, 2015, https://www.baseball-prospectus.com/news/article/25564/moonshot-how-jonathan-lucroy-makes-batters-swing-at-bad-pitches/.
30 Jeff Sullivan, “Pitch Framing Data Is Going Insane,” November 8, 2017, FanGraphs, https://blogs.fangraphs.com/pitch-framing-data-is-going-insane/.
31 Pizza Cutter (Russell A. Carleton), “The Foul Ball, Part 1: What Does it Tell Us About a Batter?” Statistically Speaking Archives, https://statspeakmvn.wordpress.com/2008/04/15/the-foul-ball-part-one-what-does-it-tell-us-about-a-batter/.
32 Devan Fink, “Unpacking the Impact of Foul Balls on Strikeouts,” FanGraphs, May 21, 2021, https://blogs.fangraphs.com/unpacking-the-impact-of-foul-balls-on-strikeouts/.
33 Alex Chamberlain, “Are Foul Balls Good or Bad?” FanGraphs, June 22, 2019, https://fantasy.fangraphs.com/are-foul-balls-good-or-bad/.
34 Carleton, “When It All Went Foul.” Baseball Prospectus, May 1, 2024, https://www.baseballprospectus.com/news/article/90085/baseball-therapy-when-it-all-went-foul-foul-balls/; Andrews, “What Is a Foul Ball Anyway?” FanGraphs, February 16, 2024, https://blogs.fangraphs.com/what-is-a-foul-ball-anyway/.
35 Andrews, “What Is a Foul Ball Anyway?”
36 Carleton, “When It All Went Foul.”
37 Carleton, “Slow Down on the Slowing Down to Speed Up,” June 15, 2022, https://www.baseballprospectus.com/news/article/75296/baseball-therapy-slow-down-on-the-slowing-down-to-speed-up/.
38 Andrews, “What Is a Foul Ball Anyway?”
39 Improved pitch framing increased the number of called strikes both outside and inside the rule book strike zone. Whereas the former would decrease umpire accuracy, the latter would counterbalance it, and with the greater attention paid to it, overall umpire accuracy steadily improved.
40 Alan M. Nathan, “Trajectory Calculator,” The Physics of Baseball, http://baseball.physics.illinois.edu/trajectory-calculator.html; Robert Arthur. “Moving the Mound will Change Everything,” Baseball Prospectus, March 15, 2019, https://www.baseballprospectus.com/news/article/47832/moonshot-moving-the-mound-will-change-everything/.
41 David Schoenfield and Jeff Passan, “How soon could robot umps and 62-foot, 6-inch mound come to MLB?” ESPN, March 8, 2019, https://www.espn.com/mlb/story/_/id/26191979/how-soon-robot-umps-62-foot-6-inch-mound-come-mlb.
42 Robert Arthur, “Moving the Atlantic League Mound Back Has Had Mixed Effects,” Baseball Prospectus, August 24, 2021, https://www.baseball-prospectus.com/news/article/69212/moonshot-moving-the-mound-back-has-had-mixed-effects/; Ben Lindbergh and Rob Arthur, “MLB Just Tried a Bunch of Experimental Rules in the Minors. How Well Did They Work?” The Ringer, October 21, 2021, https://www.theringer.com/mlb/2021/10/21/22736400/experimental-rules-atlantic-league-robo-umps.