

WAR and the World Series: Is WAR an Indicator of October Success?
This article was written by Ryan Borgemenke
This article was published in Fall 2018 Baseball Research Journal
Introduction
 The statistic Wins Above Replacement, or WAR, is an increasingly popular method of quickly determining a player’s worth, and by extension, the value of an entire team. Baseball is unlike most sports in that there is a multitude of statistics to describe a player, but WAR eloquently summarizes a player in one number. Rather than looking at the batting average, OBP, and SLG to make a judgment, one can instead look at the WAR value of a player for any given season and compare the value with the ranges listed on Baseball-Reference.com, which states a value of 8+ is MVP quality, 5+ is All-Star quality, 2+ is starter quality, 0-2 is a reserve-quality player, and 0 is replacement level. Mike Trout, for example, regarded as one of the best players in the majors, has not finished a full season with a WAR value less than 7.6; he has justifiably finished first or second in the league MVP voting in all but one of the six seasons he has played.
The actual WAR calculation is fairly complex, but is based on the number of runs, and thus wins, a player contributes to his team. There is no set formula for how WAR is calculated, so values will inevitably differ between sources. The values used in for this study were taken from Baseball-Reference.com, which calculates WAR with different formulas for batters and pitchers. For batters, the WAR calculation has six parameters: batting runs, baserunning runs, runs added or lost due to grounding into double plays in double-play situations, fielding runs, positional adjustment runs, and replacement level runs (based on playing time). The park a batter plays in is accounted for in the batting runs calculation. To increase the number of runs, batters can collect more extra-base hits per plate appearance, advance more on the basepath without getting thrown out, ground into fewer double plays, increase the number of defensive runs saved, or play a position such as catcher or shortstop, where the average offensive numbers aren’t as good. The replacement level of runs for batters corresponds to 20.5 over the course of 600 plate appearances, meaning if an average starter is replaced with a replacement player, there would be a 20-run difference between those players.
For pitchers, the WAR calculation is based on the number of runs allowed by a pitcher compared to the league average pitcher (adjusting for quality of opposition), parks pitched in, and quality of fielding behind the pitcher. The replacement level runs for pitchers is a multiple of 20.5 and based on the number of outs pitched. After the total runs a player accumulated is found, it is converted to wins. The number of runs per win is calculated based on the league average number of runs per game that year. The player’s calculated runs total is then divided by the runs/win value, resulting in the player’s WAR.
Replacement level is set at a winning percentage of 29.4, and with 30 teams, there are approximately 1,000 Wins Above Replacement combined for both leagues in a 162-game season. WAR is a cumulative, or “counting” stat, like home runs, so the total WAR available in a 154-game season, or in seasons with fewer major-league teams, was lower. In 2017, to account for quality disparities between leagues, approximately 525 Wins Above Replacement were assigned to the American League and 475 to the National League. Those proportions vary each year; more wins were assigned to the National League between 1942 and 1968 because of the league’s perceived higher comparative quality, primarily due to postwar integration.
According to Baseball-Reference.com, although WAR is a statistic assigned to an individual, each player’s WAR value can be added together for a team total. In fact, adding 48 (the number of wins a replacement team would achieve, which is found by multiplying .294 and 162) to a team’s total WAR value will closely match the team’s actual wins for the season. But does a higher WAR, a value based on regular-season statistics, correlate with a higher winning percentage in the World Series? Can WAR be used to describe teams that play in the World Series? Also, using a historical approach, were there decades in which teams with lower WAR values than their opponent won more frequently?
Methodology and Results
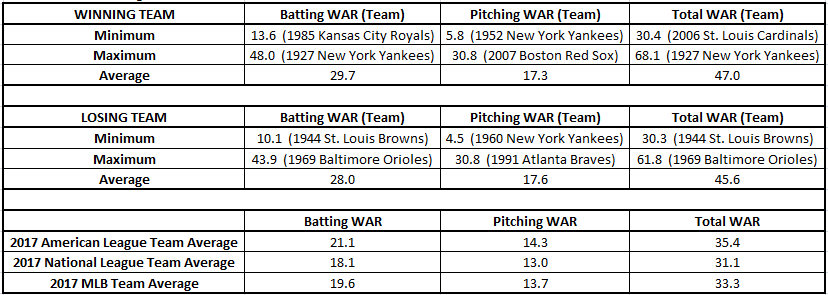
WAR values for pitching and batting categories of every team that played in the World Series since 1903 were compiled. However, only values since the live-ball era began in 1920 were considered because of the rule changes implemented that year. WAR values for the pitching and batting categories were added together for a team total WAR value category and the difference between the winner’s and loser’s total WAR value for each World Series was found. If the difference was positive, the winner had a higher total WAR value, and if the difference was negative, the loser had a higher total WAR value. The minimum, maximum, and average for the pitching, batting, and total categories were found to describe all World Series winners and losers. The results and the respective teams for each value are found in Table 1. The 2017 American League, National League, and MLB averages for each category are also listed for comparison.
Table 1: World Series winners and losers WAR values with AL, NL, and MLB averages
(Click image to enlarge.)
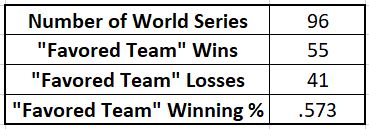
The winning percentage of the team with the higher WAR value, or “Favored Team,” was calculated for all World Series since the live-ball era began. This was accomplished by counting the total number of times the “Favored Team” won and dividing by the total number of World Series played. Although 97 World Series have been played since 1920, the 1959 World Series was excluded from the calculation because both teams had an equal total WAR value, leaving 96 World Series to consider. The results are found in Table 2.
Table 2: Overall winning percentage for the “Favored Team” since the live-ball era began
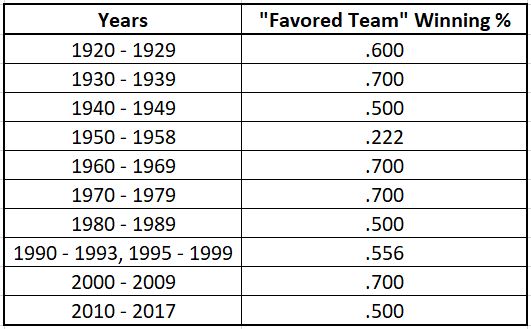
In a similar way, the “Favored Team” winning percentage for each decade was calculated by counting the number of times the winner had a higher total WAR value than the loser and dividing by the number of World Series played in the corresponding decade. As stated before, the teams in the 1959 World Series had an equal total WAR value, so this series was excluded from its corresponding decade. Likewise, there was no World Series played in 1994. The results are found in Table 3.
Table 3: “Favored Team” World Series winning percentage by decade
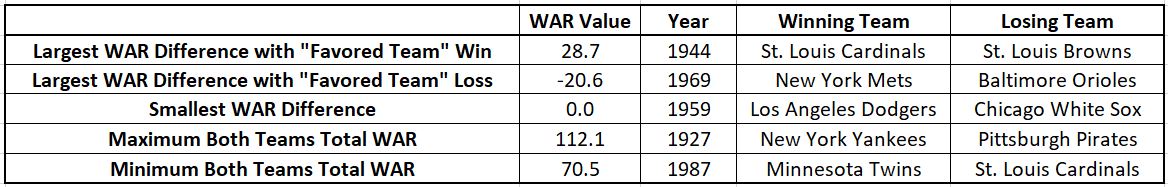
Next, World Series matchups were examined based on WAR values. The largest WAR difference between teams that resulted in a “Favored Team” win and loss were found. The largest WAR difference with a “Favored Team” win is a matchup in which the “Favored Team” had the most value over their opponent ever and won. The largest WAR difference with a “Favored Team” loss is the largest upset by an underdog where their opponent had the most value over them and lost. The smallest WAR difference is a matchup where the teams were most evenly matched. The maximum both teams total WAR is where two “extremely valuable” teams played each other and the minimum both teams total WAR is the “least valuable” matchup of any World Series in a non-strike year. The 1981 season was shortened by about a third because of a strike, so the totals for WAR, a counting stat, were drastically lower that year. These values and the corresponding years and teams are listed in Table 4.
Table 4: WAR differences between teams and maximum and minimum combined team WAR
(Click image to enlarge.)
World Series matchups were further examined by comparing the WAR difference between teams and “Favored Team” winning percentage. Using the total WAR difference between teams for each year calculated earlier, all values were made positive to examine the WAR difference magnitude of each matchup. The matchups were then sorted into WAR difference ranges in increments of one, starting with a difference range between 0.0 and 0.99 (excluding any year with a difference of 0.0) and increasing to the highest WAR difference range between 28.0 and 28.99. The ranges with no World Series with a WAR difference value that included them were excluded. Likewise, to ensure a large enough sample size for each range, any range that contained fewer than five series was excluded. The “Favored Team” winning percentage for each WAR difference range was found by counting the number of times the “Favored Team” won and dividing by the number of series that fell into the corresponding range. The results are found in Table 5.
Table 5: WAR difference and “Favored Team” winning percentage

(Click image to enlarge.)
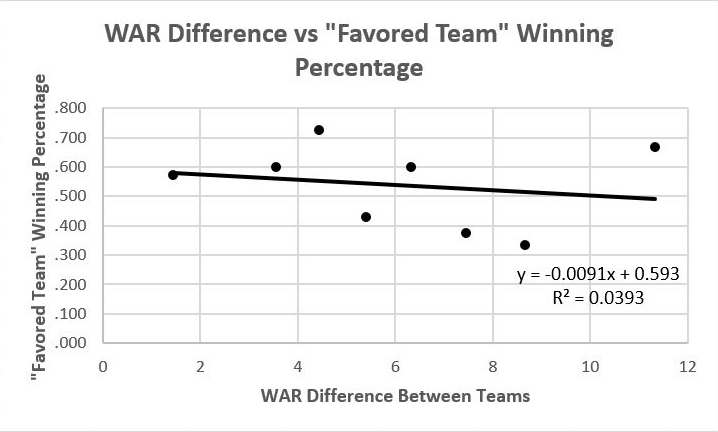
The WAR difference between teams and “Favored Team” winning percentage found in Table 5 were then plotted against each other. Because it’s not possible to plot the WAR difference range itself, the average of all total WAR values falling into each range was used instead. A linear trendline was then added and the results are found in Figure 1.
Figure 1: WAR difference vs. “Favored Team” winning percentage
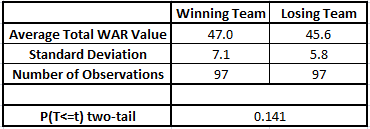
Total WAR values for all teams playing in the World Series since the live-ball era began were then examined. The total WAR values between the winning and losing teams were compared using a Student’s t-test. Alpha, or the significance level, was set at 0.05 and it was assumed the total WAR values for both the winning and losing teams had similar variance. The results are found in Table 6.
Table 6: Total WAR value Student’s t-test comparison
Discussion
WAR was used to describe the average team playing in the World Series by averaging the batting, pitching, and total categories of every winning and losing team since 1920. Comparing WAR values found in Table 1, the average winner of the World Series (with a WAR value of 47.0) has a team total WAR value 13.7 higher than the 2017 MLB team average (33.3). More specifically, the average team would need to add the value of an equivalent MVP batter, with a WAR of 10.0, along with a quality starting pitcher, with a WAR of 3.7, to achieve the same value of a World Series winner. The calculated team total WAR values are logical, because after adding 48 to the total WAR value, the average World Series winner will achieve an estimated 95 wins in the regular season and the MLB average team will achieve 81 wins. It should also be noted that the American League has a higher team average total WAR than the National League because of how WAR is distributed, as described earlier. On average, the World Series winner slightly edges out the loser with a WAR of about 1.4 higher, although the p-value from the two-tailed Student’s t-test in Table 6 is greater than alpha (0.05), meaning the WAR difference between teams isn’t statistically significant and opponents are evenly matched.
A historical approach was used to analyze WAR values of teams in the World Series as well as matchups. Looking at the WAR values for pitching, batting, and total categories in Table 1, the team with the lowest total WAR of any World Series winner (30.4, which is less than the 2017 MLB team average) was the St Louis Cardinals in 2006. This was also the team with the lowest regular-season winning percentage to win a World Series. The team with the highest total WAR of any World Series winner (68.1, which is more than double the 2017 MLB team average) was the New York Yankees in 1927, which is generally regarded as one of the best teams ever.
 Examining World Series matchups based on WAR in Table 4, the largest upset, where the team with a much lower WAR value than their opponent won a World Series, occurred in 1969, when the “Miracle Mets” defeated the mighty Baltimore Orioles. The World Series with the highest combined WAR for both teams was in 1927, when the New York Yankees defeated the Pittsburgh Pirates, and the lowest combined WAR for both teams in a non-strike year was in 1987, when the Minnesota Twins defeated the St. Louis Cardinals. Because the team total WAR value appears to match with actual winning percentage and general opinion of how teams are regarded historically, it can be used as a benchmark indicator of how good a team is. At the same time, this study also challenges the similar observations and judgments of one team in particular: the New York Yankees.
Examining Table 3, the “Favored Team” winning percentage in each decade remained close to the average of 57.3 found in Table 2, except between 1950 and 1958. The 1950s was a decade primarily dominated by the Yankees; they would appear in the World Series eight times and win six. However successful, according to the WAR values in each matchup, they were the underdog every year they won (1950-1953, 1956, 1958) as well as the two times they lost (1955 and 1957). This demonstrates one of the limitations of WAR: Although it does a good job estimating a player’s and team’s worth, there are many other intangible factors that make a winning ballclub, a couple of which include club morale and luck. Longtime Yankees manager Casey Stengel described Yogi Berra as “my man,” because he was confident in his catcher’s ability to hit and handle pitchers. Was Stengel’s managerial skill or Berra’s presence the difference that led to so many victories? Another idiosyncrasy of the 1950s, as mentioned earlier, was that 1959 was the only year in which the opponent’s team total WAR values were equal. Although equal statistically by WAR, the Los Angeles Dodgers would defeat the Chicago White Sox in 6 games.
Total WAR difference between teams was also compared against winning percentage using the methodology described above. Initially, it was hypothesized that a higher WAR difference would correlate to a higher winning percentage because the “Favored Team” would have a WAR value that was increasingly more than their opponent. However, the linear trendline in Graph 1 has a negative slope and the corresponding coefficient of determination (0.0393) is very low, meaning only about 3.9 percent of the variance in the data was caused by the linear relationship. Therefore, there is no correlation between WAR difference and winning percentage, although teams with a higher team total WAR win about 57.3 percent of the time, as found in Table 2.
In the future, more work can be done to attempt a better correlation model when graphing the WAR difference and “Favored Team” winning percentage. This could be done by increasing the number of ranges used by decreasing the WAR difference increments to a value less than one. Although 97 World Series have been played since the live-ball era began, only 96 of the data were usable and even fewer (60) could be used for the model used in this study to ensure the winning percentages for each range had averaged out to equilibrium. The main limitation with the current model is lack of sample size, which would only become more problematic if the range increments were decreased. Future work can also be done by increasing the scope and examining WAR difference between the World Series winner and the average team that made the playoffs that same year. It would be especially interesting to compare WAR values between eras of playoff expansion.
Conclusion
WAR can be used to describe the average team playing in the World Series, with the average winner having a team total WAR value of 47.0, or 13.7 above the 2017 MLB team average. Through historical analysis, WAR as a statistic and its values appear to be validated when comparing team total WAR values with actual winning percentage and general opinion. WAR values also don’t vary much between decades, with the 1950s being the exception. Although the WAR value analysis for each World Series shows that teams with a higher WAR value win about 57.3 percent of the time, there is no correlation between the WAR difference between teams and winning percentage, leaving postseason outcomes subject to intangible factors.
RYAN BORGEMENKE is a second-year medical student and holds a bachelor’s degree in chemical engineering. He is a lifelong Reds fan from Mason, Ohio and has been a SABR member since 2018. His interest in WAR goes back to 2013 when he first learned of sabermetrics.
Sources
The author used Baseball-Reference.com for all statistical values and World Series matchup information. WAR values are accurate as of July 1, 2018.