

AggPro: The Aggregate Projection System
This article was written by Timothy Highley - Cameron T. Snapp - Ross J. Gore
This article was published in Fall 2009 Baseball Research Journal
Many different methods exist for projecting the performance of major leaguers in a variety of statistical categories for an upcoming season. These projection systems include Brad Null,1 Bill James Handbook,2 CAIRO,3 CBS,4 CHONE,5 ESPN,6 Hardball Times,7 Hit Tracker,8 KFFL,9 Marcel,10 Oliver,11 PECOTA,12 RotoWorld,13 and ZiPS.14 Despite the availability and prevalence of these systems, there has been relatively little evaluation on the accuracy of the projections from these systems. Furthermore, there has been no research that attempts to aggregate these projection systems together to create a single more accurate projection.
We propose AggPro, an aggregate projection system that forms a projection for a player’s performance by weighting the player’s projections from the existing projection systems. We refer to each existing projection system employed by AggPro as a constituent projection system. Automated search methods are used to assign each constituent projection system a weight. The determined weight for a constituent system is then applied to the projections from that constituent system for the upcoming year. Then an AggPro projection is formed by summing the different weighted constituent projections for a player across all the projection systems.
We believe that the aggregate projections contain the best parts of each projection system and that they result in a system that is more accurate than any of the constituent systems in the AggPro projection. The AggPro projections are evaluated against all the constituent systems by measuring the average error, root mean square error (RMSE), and Pearson correlation coefficient of the projections from actual player performance for the 2008 and 2009 seasons.
It is important to note that AggPro is not just another projection system. Instead it is a methodology for aggregating effective projections from different systems into a single, more accurate projection. Furthermore, Greg Rybarczyk15 believes paradigm shifts that will improve the accuracy of projection systems are on the horizon. If paradigm-shifting projection systems are developed, the AggPro methodology will be applicable and improve the projections from these systems as well.
In the next section we describe work related to AggPro. Then AggPro is presented and evaluated. Finally we conclude and present directions for future work with AggPro.
RELATED WORK
Research efforts in the areas of baseball, computer science, and artificial intelligence have all contributed to AggPro. We review these related works here.
BellKor and the NetFlix Prize. The strategy of applying different weights to different predictions from effective projection systems has been used successfully by BellKor of AT&T labs,16 the winning solution for the NetFlix prize.17 In October 2006, Netflix released a dataset of anonymous movie ratings and challenged researchers to develop systems that could beat the accuracy of its recommendation system, Cinematch. A grand prize, known as the NetFlix Prize, of one million dollars was awarded to the first system to beat Cinematch by 10 percent. The BellKor prediction system was part of the winning solution, with 10.05 percent improvement over Cinematch.
BellKor employs 107 different models of varying approaches to generate user ratings for a particular movie. Then BellKor applies a linear weight to each model’s prediction to create an aggregate prediction for the movie.18 AggPro applies this prediction strategy to projecting player performance by employing the different existing projection systems.
Nate Silver’s 2007 Evaluation of Projection Systems. In 2007, Nate Silver performed a quick and dirty evaluation of the OPS (on-base plus slugging percentage) projection from eight 2007 major-league projection systems.19 Silver’s work offers several evaluation metrics, including average error, RMSE, and Pearson’s correlation coefficient, which we employ to evaluate AggPro. However, Silver also offers a metric to determine which system provides the best information. The metric is based on performing a regression analysis on all the systems for the past year and identifying “which systems contribute the most to the projection bundle.”20 AggPro performs this same regression analysis by using the projections of systems for the past year. Then each metric identified by the analysis as a weight is applied by AggPro to the system’s projections for the upcoming year. This methodology identifies most accurate parts of each projection system and combines these parts in one aggregate projection produced by AggPro.
AGGPRO
The AggPro projections are generated through a threepart process. First, we collect the projections from five different systems for the years 2007, 2008, and 2009. Next, for each year we identify the players who were common among all five systems. We also identify the statistical categories that were common among all five projection systems.
For the upcoming year, we perform an automated search over all the combinations of possible weights for the projections of five systems from the previous year. The automated search identifies the weight set that minimizes the root mean squared error (RMSE) of the previous year’s aggregate projections from the actual player performances for the previous year. Next, we apply the identified weight set to the projection from the five systems for the upcoming year. This process is discussed in more detail in the remainder of this section.
Projection and MLB Actual Data Collection. We collected projections from Bill James Handbook,21 CHONE,22 Marcel,23 PECOTA,24 and ZiPS25 for the years 2007– 2009. We collected the actual performance data for 2007 and 2008 from Baseball Prospectus. These projection systems are a representative sample of the many different systems that exist. If AggPro can successfully create from these systems an aggregate projection that is more accurate than any of the constituent projection systems, then the AggPro methodology will have been shown to be successful. Given a successful methodology, readers can apply AggPro to any combination of constituent projection systems they choose.
Identification of Players and Statistics to Project. Recall that each year AggPro projects the performance only of those players common to all five systems. The player list for each year is available online.26 Also recall that AggPro can project only those statistical categories that are common to all five systems. The hitter categories common to the five systems are at-bats, hits, runs, doubles, triples, home runs, RBIs, stolen bases, walks, and strikeouts. The pitcher categories common to the five systems are innings pitched, earned runs, strikeouts, walks, and hits. These sets of players and statistics represent the largest possible set that was common to all the systems.
Automated Search to Identify AggPro Weights. Given the five projection systems, the set of common statistics and common players for the AggPro projections for an upcoming year are generated as follows:
The projections for the five systems for the previous year are gathered.
The actual performance data for the previous year are gathered.
A brute-force automated search is performed to identify the set of weights that, when applied to the projections of the five systems for the previous year, minimize the RMSE of the previous year’s aggregate projections from the actual player performances for the previous year. Within the automated search, the aggregate projection is formed by applying each weight in the set to its respective projection system and summing together the projections for a player.
Once the search is completed, the identified weight set is applied to the projections of the five systems for the upcoming year. The AggPro projections for the upcoming year are formed by applying each weight in the set to its respective projection systems and summing together the projections for a player.
We generated AggPro projections for the years 2008 and 2009. For the 2008 AggPro projections, the weight set that minimizes the RMSE of the 2007 aggregate projections from the 2007 actual player-performance data is Bill James Handbook = 0.56, CHONE = 0.00, Marcel = 0.15, PECOTA = 0.29, and ZiPS = 0.00. Applying these weights to the projection systems for 2008 generates the 2008 AggPro projections. For the 2009 AggPro projections, the weight set that minimizes the RMSE of the 2008 aggregate projections from the 2008 actual-player performance data is Bill James Handbook = 0.37, CHONE = 0.00, Marcel = 0.35, PECOTA = 0.28, and ZiPS = 0.00. Applying these weights to the projection systems for 2009 generates the 2009 AggPro projections.
In the next section we evaluate the accuracy of the AggPro projections for each year using average error, RMSE, and Pearson’s correlation coefficient as evaluation criteria.
EVALUATION
AggPro and the five constituent projection systems were evaluated by computing, from the actual data, the average error, RMSE, and Pearson correlation coefficient for each year for each statistical category. All of this evaluation data is shown and discussed in the appendix.
For each system, for each year we also computed the average of each evaluation criterion over all the statistical categories. Each year we identified the best constituent projection system (BCPS). The BCPS is the constituent system that for a given year had the best average evaluation criterion over all the statistical categories. Furthermore, we identified the best constituent projection in each statistical category for each evaluation criterion. Combining the best constituent projections of each category forms the theoretical projection system (TPS). The TPS amounts to a given fictional oracle function at the beginning of the season, a function that could pick the most accurate projection from the five systems for each statistical category. Because of how it is constructed, the TPS is guaranteed to be at least as accurate as the BCPS. We also computed the average of each evaluation criterion over all the statistical categories in the TPS. AggPro’s percent improvement over the BCPS and the TPS for the average of each evaluation criterion for each year is shown in tables 1 through 3. The 2009 projections are evaluated through games completed on September 20, 2009.
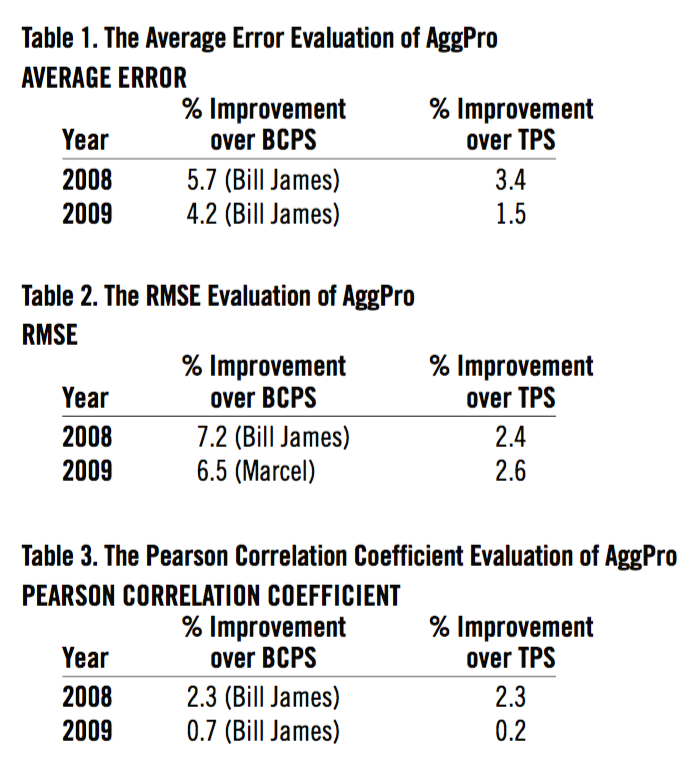
AggPro is an improvement over both the BCPS and TPS for each evaluation criterion. This result is surprising. Since the TPS is constructed to contain the best constituent projection for each statistical category, we did not anticipate that AggPro would outperform it. Instead, we had anticipated that the TPS would be a baseline for the best theoretical improvement AggPro could achieve. However, it appears that the weighting
of the different projections creates an aggregate projection that is more than the sum of the best parts of the constituent projection systems. This bodes well for future work with the AggPro methodology.
CONCLUSION
There exist many different systems to predict the performance of players in a variety of statistical categories. We have shown that our methodology, AggPro, can aggregate these existing projection systems into a single aggregate projection that is more accurate than any of AggPro’s constituent project systems. Furthermore, AggPro is more accurate than the TPS when measured by any of the three evaluation criteria for the years 2008 and 2009. In other words, even if, at the beginning of the season, a reader was given a fictional oracle function that could pick the most accurate projection from the five systems for each statistical category, AggPro’s predictions would still be more accurate for the upcoming season.
In future work with AggPro we will explore use of distinct weight sets for the constituent projection systems for hitting and pitching statistical categories
APPENDIX
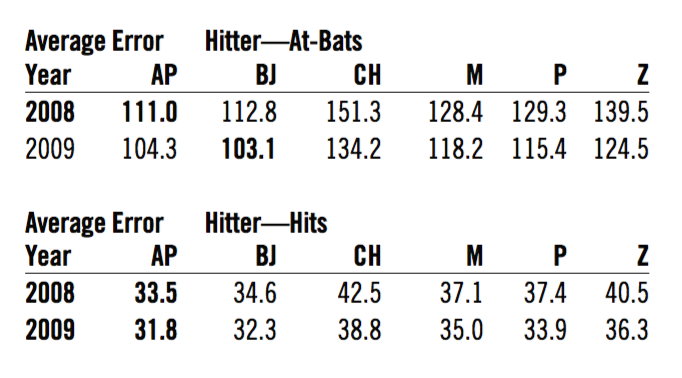
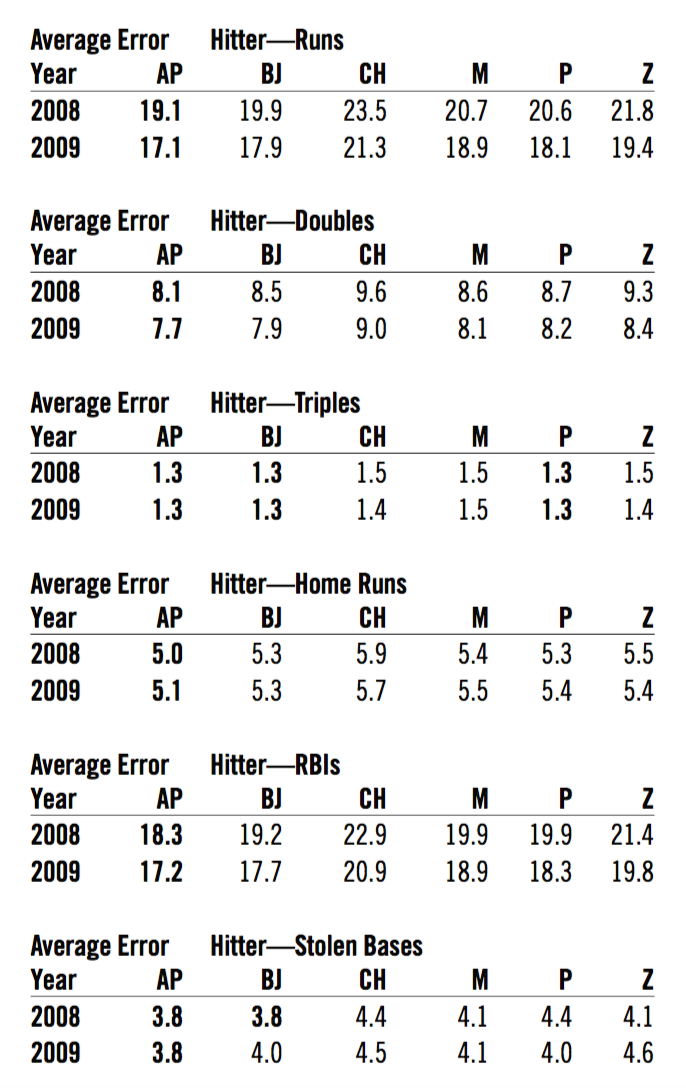
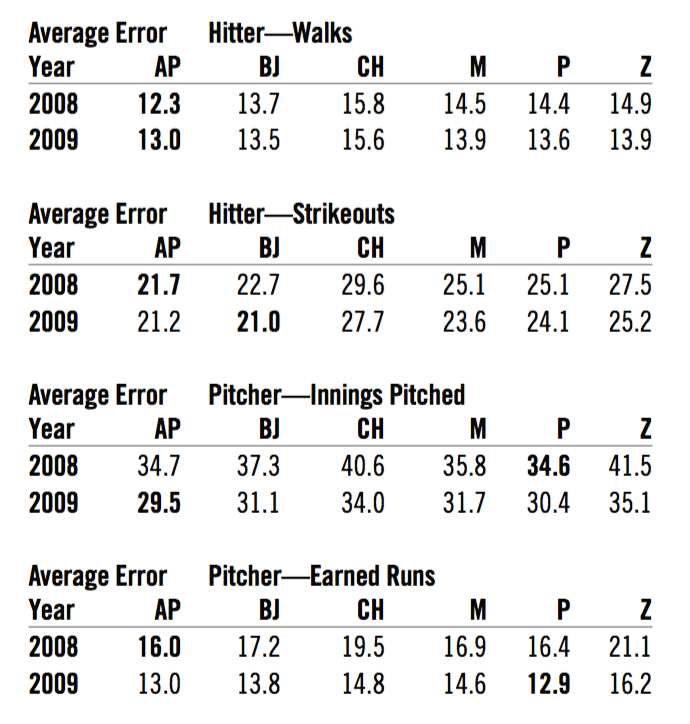
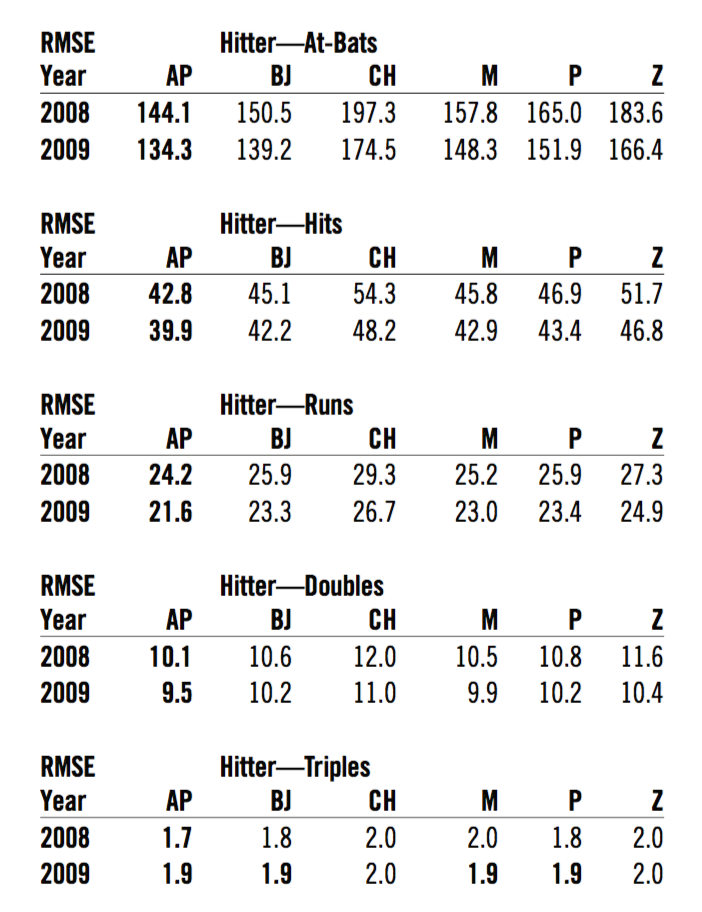
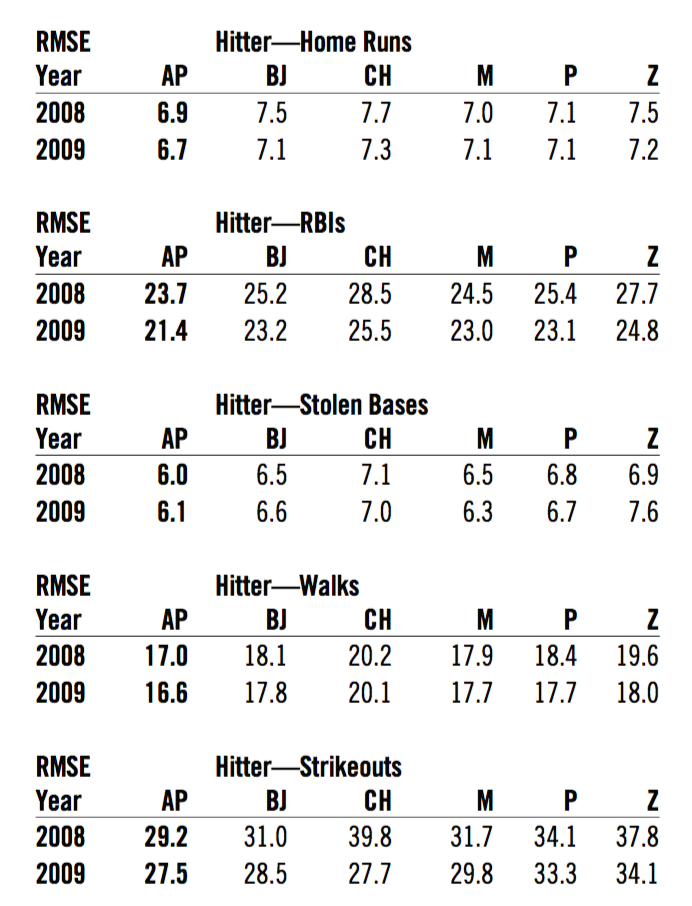
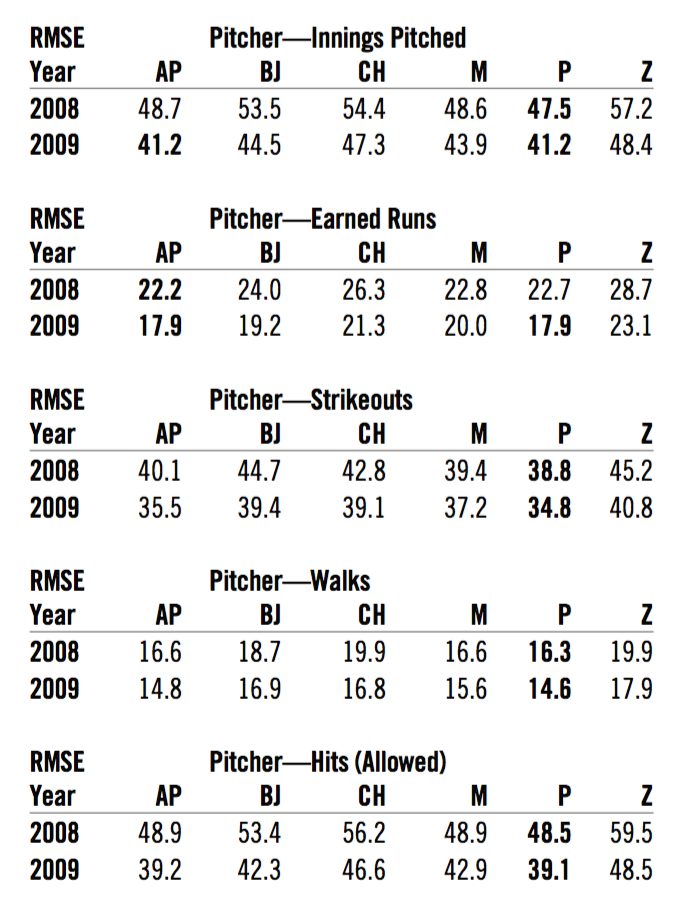
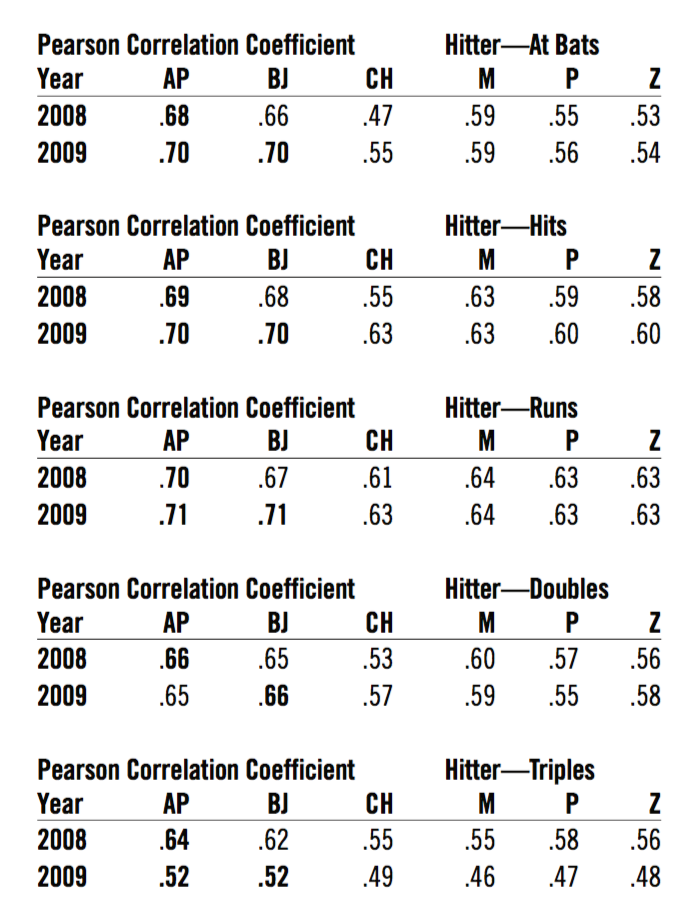
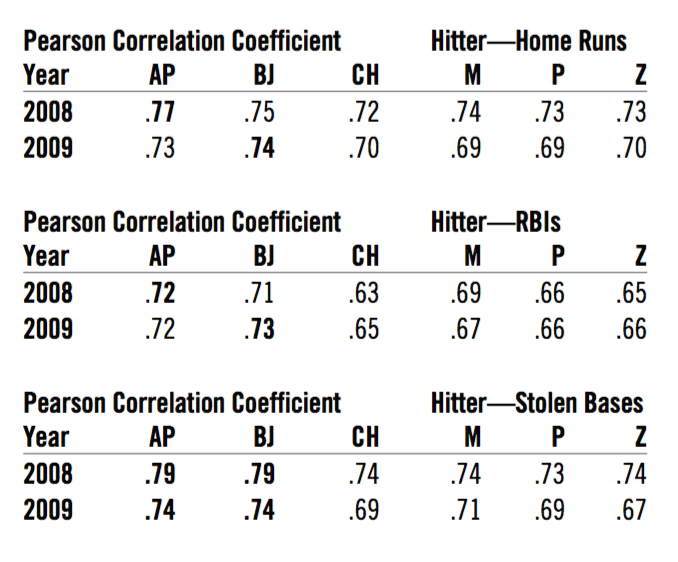
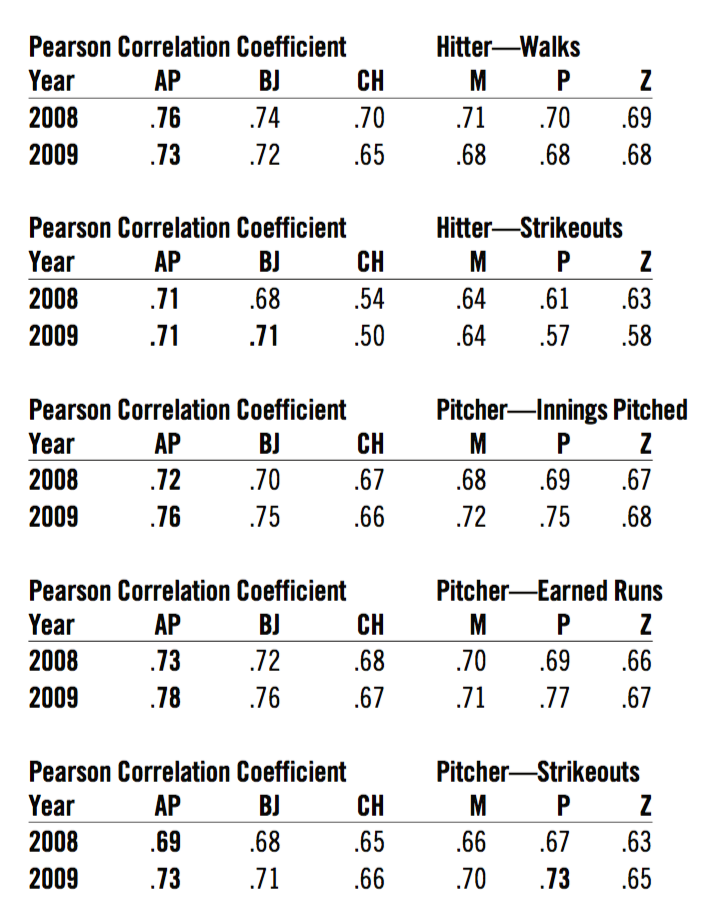
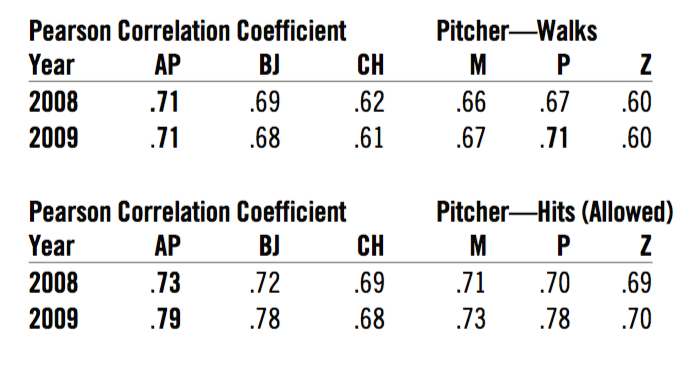
For each statistical category, the evaluation of each system for each evaluation criterion is listed in the following tables. AggPro is abbreviated AP; Bill James Handbook, BJ; CHONE, CH; Marcel, M; PECOTA, P, and ZiPS, Z. The system that performs the best for the given evaluation criterion for the given year appears in boldface.
Average error is the measure of the average absolute (without regard to sign) error of the player projections. Average error is measured for each statistical category. The system with the smallest average error in each category in each year appears in boldface to indicate that it is the most accurate. The 2009 projections are evaluated through games completed on September 20, 2009.
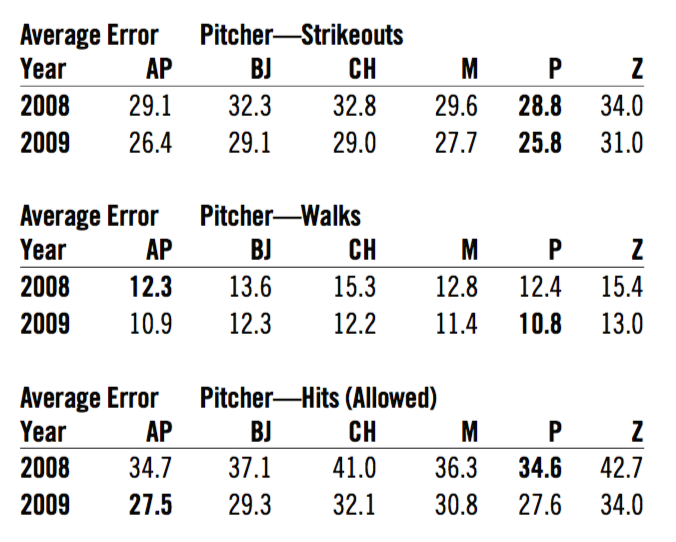
Root Mean Squared Error (RMSE) is the frequently used measure of the differences between values predicted by a model or an estimator and the values actually observed from the phenomenon being modeled or estimated. RMSE is known as the best measure of accuracy for prediction models. RMSE is measured for each statistical category. The system with the smallest RMSE in each category in each year is bolded to indicate that it is the most accurate. The 2009 projections are evaluated through games completed on September 20, 2009.
The Pearson correlation coefficient is a measure of the correlation (linear dependence) between two variables. The Pearson correlation coefficient is measured for each statistical category. The system with the highest Pearson correlation coefficient in each category in each year is bolded to indicate that it is the most accurate. The 2009 projections are evaluated through games completed on September 20, 2009.
Acknowledgments
Ross J. Gore would like to thank Michael Spiegel for helping to hone this idea and referring the authors to the BellKor literature despite his “healthy distaste” for sports. The authors would also like to thank Chone Smith for his prompt reply to our query about the availability of the CHONE projections.
Notes
- bradnull.blogspot.com/ (accessed 12 March 2009).
- http://bis-store.stores.yahoo.net/bijahapr203.html (accessed 12 March 2009).
- replacementlevel.com/index.php/RLYW/comments/ cairo_projections_v01 (accessed 12 March 2009).
- http://fantasynews.cbssports.com/fantasybaseball/stats/sortable/ points/1B/standard/projections (accessed 12 March 2009).
- baseballprojection.com/ (accessed 12 March 2009).
- http://games.espn.go.com/flb/tools/projections (accessed 12 March 2009).
- actasports.com/detail.html?id=019 (accessed 12 March 2009).
- http://baseballanalysts.com/archives/2009/02/2009_projection.php (accessed 12 March 2009).
- kffl.com/fantasy-baseball/2009-baseball-draft-guide.php (accessed 12 March 2009).
- tangotiger.net/marcel/ (accessed 12 March 2009).
- http://statspeak.net/2008/11/2009-batter-projections.html (accessed 12 March 2009).
- www.baseballprospectus.com/pecota/ (accessed 12 March 2009).
- www.rotoworld.com/premium/draftguide/baseball/main_page.aspx (accessed 12 March 2009).
- baseballthinkfactory.org/ (accessed 12 March 2009).
- http://baseballanalysts.com/archives/2009/02/2009_projection.php (accessed 12 March 2009).
- Bell, Y. Koren, and C. Volinsky, “Chasing $1,000,000: How We Won the Netflix Progress Prize,” ASA Statistical and Computing Graphics Newsletter 18(2):4–12, 2007.
- Bennet and S. Lanning, “The Netflix Prize,” KDD Cup and Workshop, 2007.
- Bell, Y. Koren, and C. Volinsky, “Chasing $1,000,000: How We Won the Netflix Progress Prize,” ASA Statistical and Computing Graphics Newsletter 18(2):4–12, 2007.
- baseballprospectus.com/unfiltered/?p=564 (accessed 28 July 2009).
- Ibid.
- http://bis-store.stores.yahoo.net/bijahapr203.html (accessed 12 March 2009).
- baseballprojection.com/ (accessed 12 March 2009).
- tangotiger.net/marcel/ (accessed 12 March 2009).
- baseballprospectus.com/pecota/ (accessed 12 March 2009).
- baseballthinkfactory.org/ (accessed 12 March 2009).
- cs.virginia.edu/~rjg7v/aggpro/ (accessed 28 July 2009).