

Are Balanced Teams More Successful?
This article was written by Cyril Morong
This article was published in 2006 Baseball Research Journal
If a team scores 10% more runs than average and allows 10% fewer than average, they could be said to be perfectly balanced. Do such teams win more games than those that are less balanced? For example, if a second team scores 15% more runs than average and allows 5% fewer than average, they would be less balanced than the first team—but does the first team win more games due to greater balance, even though they seem to have about the same level of performance as the second?
To measure a team’s offensive performance, I divided their runs scored per game by the league average. Then that was park adjusted using the park factors from the Sean Lahman database. The 1980 Orioles, for example, scored 4.97 runs per game. That divided by the league average of 4.51 leaves 1.10. But their park factor was 99, meaning that 1% fewer runs were scored in their park than average. So the 1.10 was divided by .99 to get 1.114, which is then multiplied by 100 to get 111.4, meaning the Orioles were 11.4% better than average in scoring. I performed similar calculations for runs allowed. In that case, the Orioles got 111.77, meaning they gave up 11.77% fewer runs than average (I’m following the convention that Pete Palmer uses, so above 100 means the team was better than average at preventing runs).
To measure balance, I found the difference between their runs-scored measure for offense (OFF) and their runs-allowed measure for defense (DEF) and then found the absolute value of balance (BAL). So the nearer the value of OFF and DEF, the more balanced the team. The Orioles had a BAL of .374 (slightly different than what the numbers imply due to rounding).
Is this balance factor important or relevant? To test this, I first ran a regression in which team winning percentage was the dependent variable and OFF and DEF were the dependent variables. The equation was:
(1) –.476 + (.49 x OFF) + (.482 x DEF)
(I divided both OFF and DEF by 100 for the regression so, for example, instead of using 110 for BAL, I used 1.10). The coefficient on DEF is not negative for reasons explained above. The standard error for 162 games was about four wins. I looked at all teams from 1980 to 2004, then ran the regression with the balance variable added in. The results:
(2) –.476 + (.486xOFF) + (.488 x DEF) – (.032 x BAL)
The standard error was still about four wins for 162 games. It did fall by about .02 wins. So adding in a balance factor does not explain winning much better. The BAL variable was statistically significant with a T-value of -2.6. It has the right sign needed if balance is to help winning. As BAL gets larger (meaning the teams get less balanced), they win less. But notice that its impact is only about 1/16 of OFF and DEF. Adding BAL also had very little impact on the equation itself, which you can see by comparing equation (2) to equation (1).
It is also helpful to look at how much a one standard deviation increase in any of the variables would change a team’s winning percentage. Standard deviation (SD) is a measure of dispersion or the spread of the numbers. The SD of OFF was 9.51. If we multiply that by .486, we get 4.62. Since I divided both OFF and DEF by 100 for the regression, we have to divide 4.62 by 100, which leaves .0462. Over 162 games, that is about 7.5 more wins. The SD of DEF was 9.07. That multiplied by .488 leaves 4.43. Over a full season, that is 7.17 more wins. For BAL, the SD was 8.11. Using the -.032 coefficient, over 162 games we get about .42 more wins. Therefore, making a significant improvement in a team’s balance adds less than one win per season.
I also looked to see if teams that exceeded their “Pythagorean” winning percentage were more balanced than other teams. The Pythagorean winning percentage was invented by Bill James, and it says that a team should have a winning percentage equal to runs scored squared divided by (runs scored squared plus runs squared allowed). The correlation between the BAL variable and how much teams exceeded their Pythagorean winning percentage was .0025, meaning that there is no connection. Being more balanced did not increase a team’s number of expected wins.
How did the most balanced teams do? The teams with the lowest 25 BAL scores are listed in Table 1.
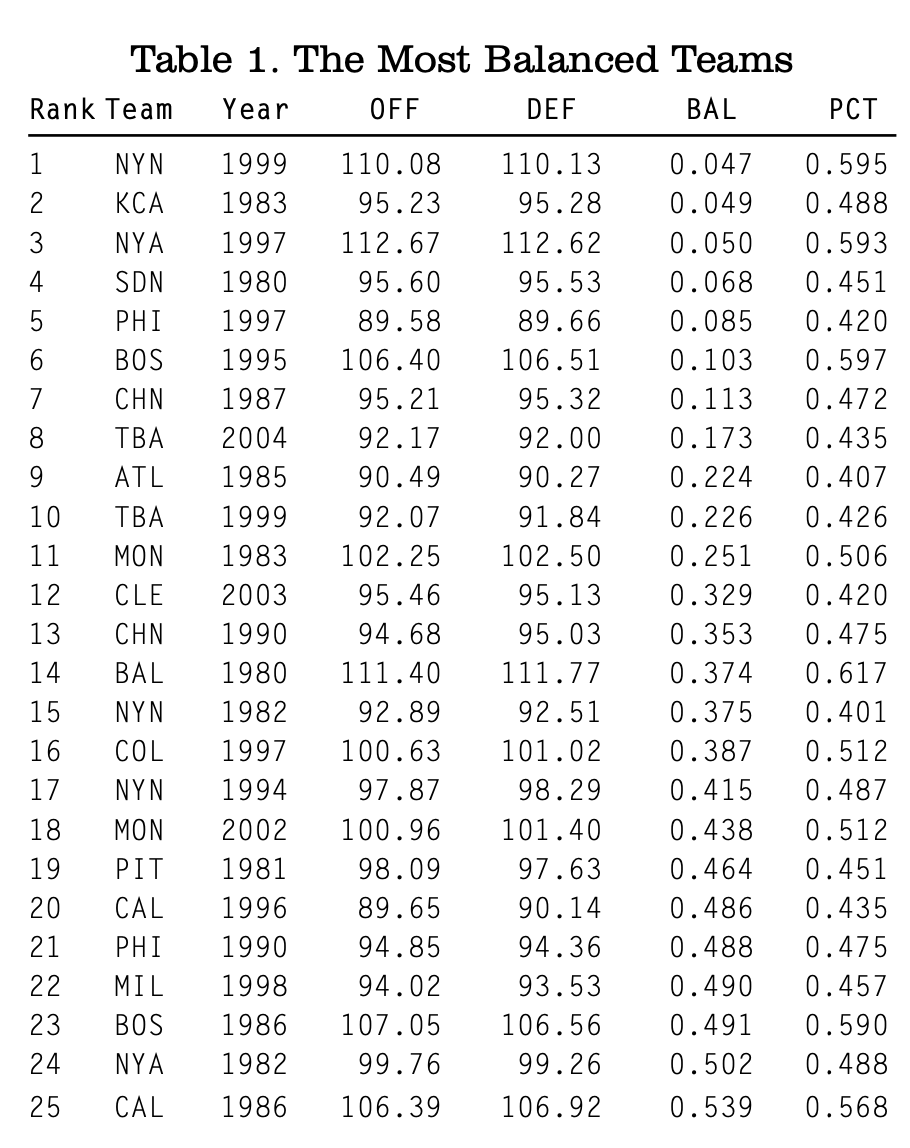
The average winning percentage is .491, so these teams did not win any more games than normal. Table 2 lists the 25 least balanced teams. Their average winning percentage was .497.
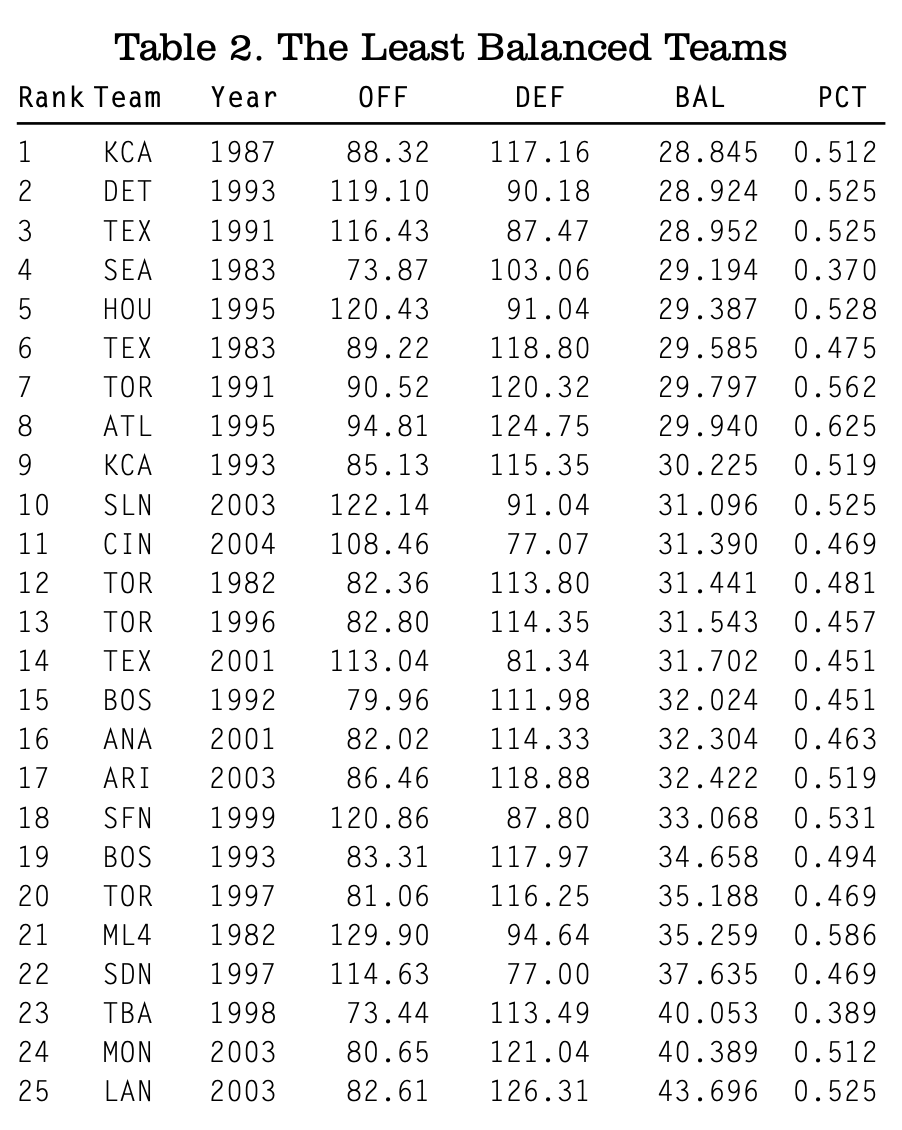
Table 3 lists the top 25 teams in winning percentage from 1980 to 2004. Their average BAL score was 11.737, while the average for all teams was 10.138. So, the best teams are just a little less balanced than normal (remember that zero is perfect balance).
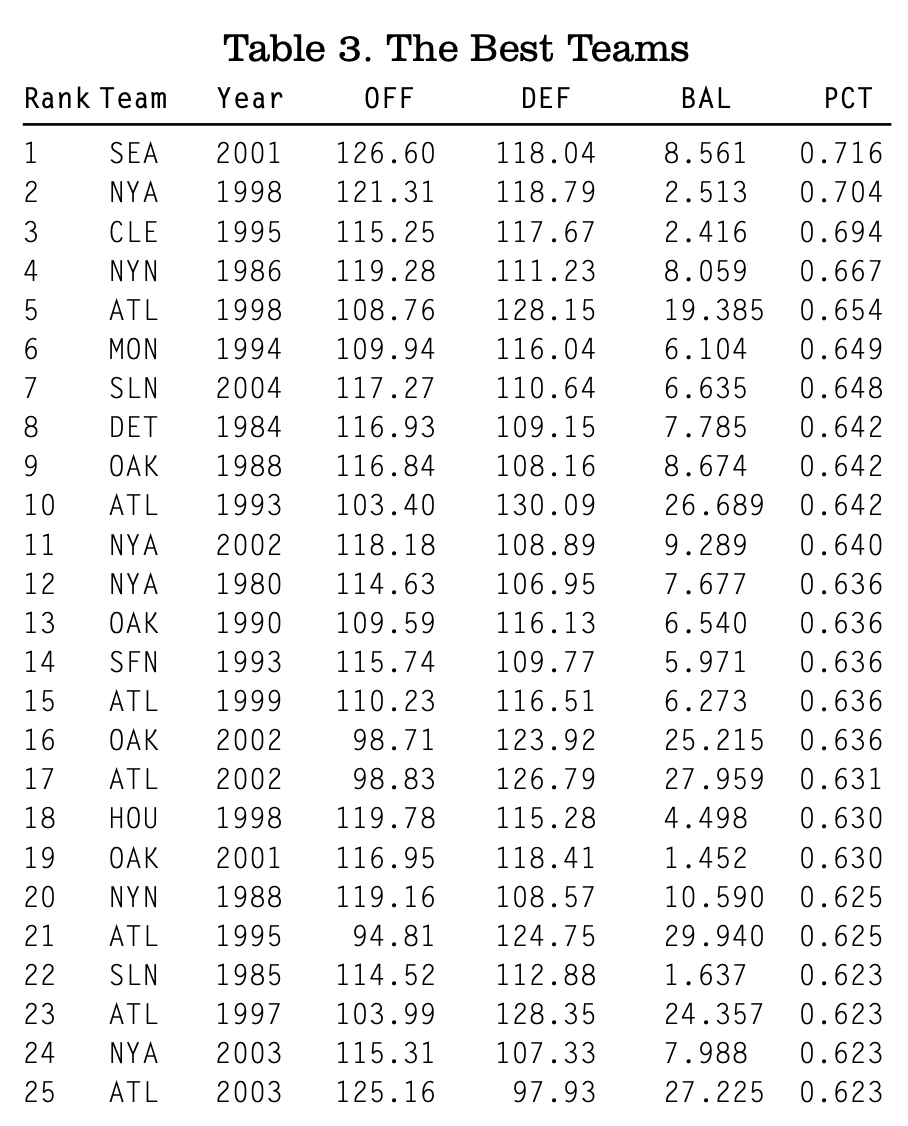
A couple of teams in Table 3 are interesting. One is the 2002–2003 Braves. In 2002 they rank 17th, having an OFF of just 98.83 and a DEF of 126.79. So they had great pitching and about average hitting. But the following year the team ranks 25th; they were very unbalanced, but in the opposite direction. They had great hitting (an OFF of 125.16) and so-so pitching (a DEF of 97.93). The other is the 2001–2002 A’s. In 2001, they were very balanced, with a BAL of 1.452. Their winning percentage was .630. The next year, they became very imbalanced when BAL rose to 25.215. But they actually saw a slight rise in their winning percentage, to .636. So for the A’s, going from being very balanced to being very imbalanced did not hurt their record.
Table 4 lists the lowest 25 teams in winning percentage. Their average BAL was 10.165. So the worst teams are just about as balanced as anyone else. Lack of balance is not why they lost so much.
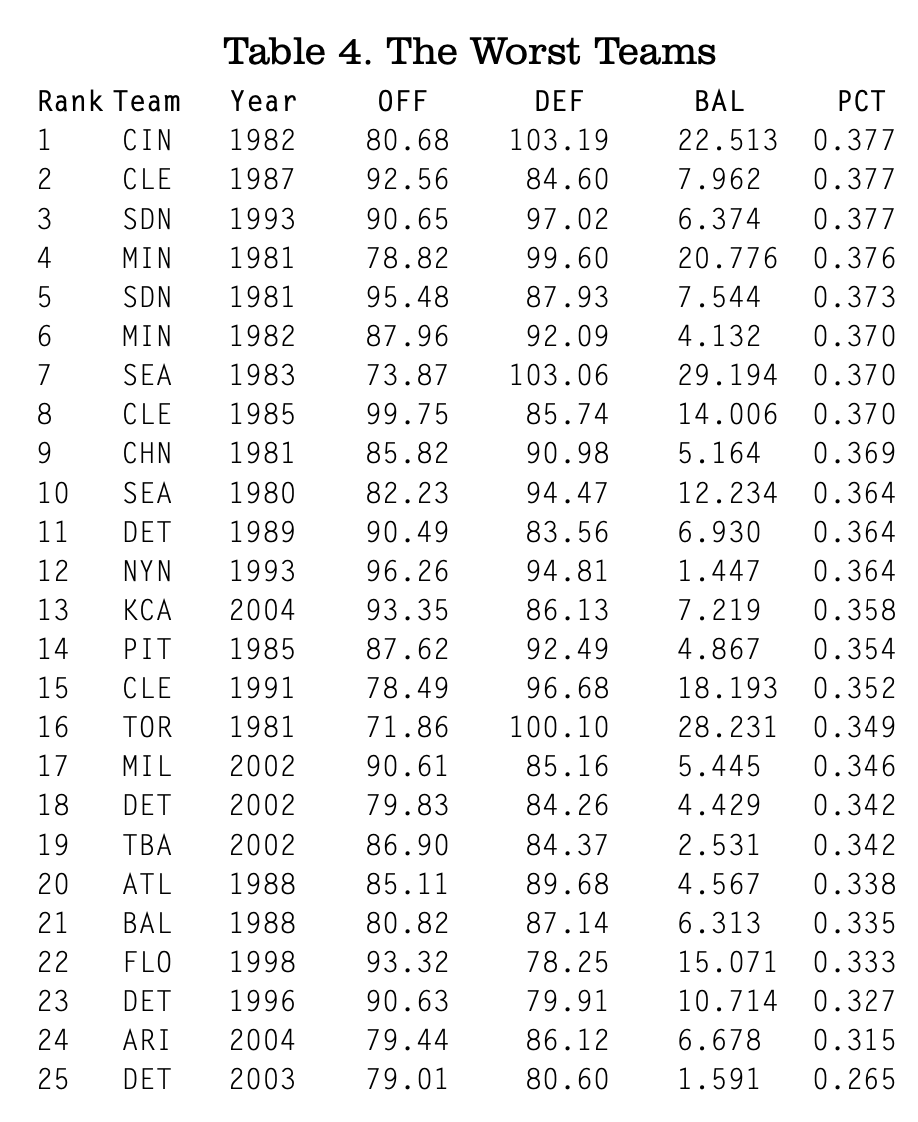
The interesting team in Table 4 is the 1981–1982 Twins. In 1981, their BAL was 20.776. So they were unbalanced, and they had a winning percentage of just .376. The next year, their BAL fell to 4.132, meaning they became more balanced. Yet their winning percentage also fell to .370.
The most balanced team was the 1999 Mets. They boasted very good hitting and pitching, with their OFF and DEF both being just about 110. This led to an excellent .595 winning percentage, a wild card birth in the playoffs, and a tough loss to the Braves in the NLCS (equation (1) predicts that they would have a .594 winning percentage). They boasted a star-studded lineup. Table 5 shows how the Met regulars hit: fifth in runs scored, averaging 5.23 runs per game.
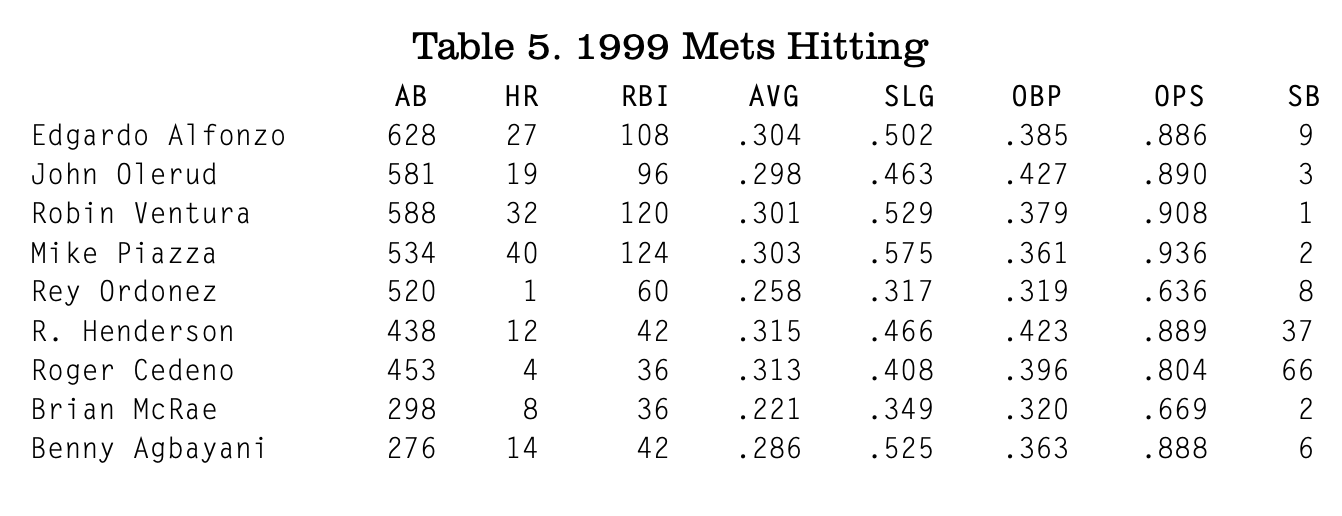
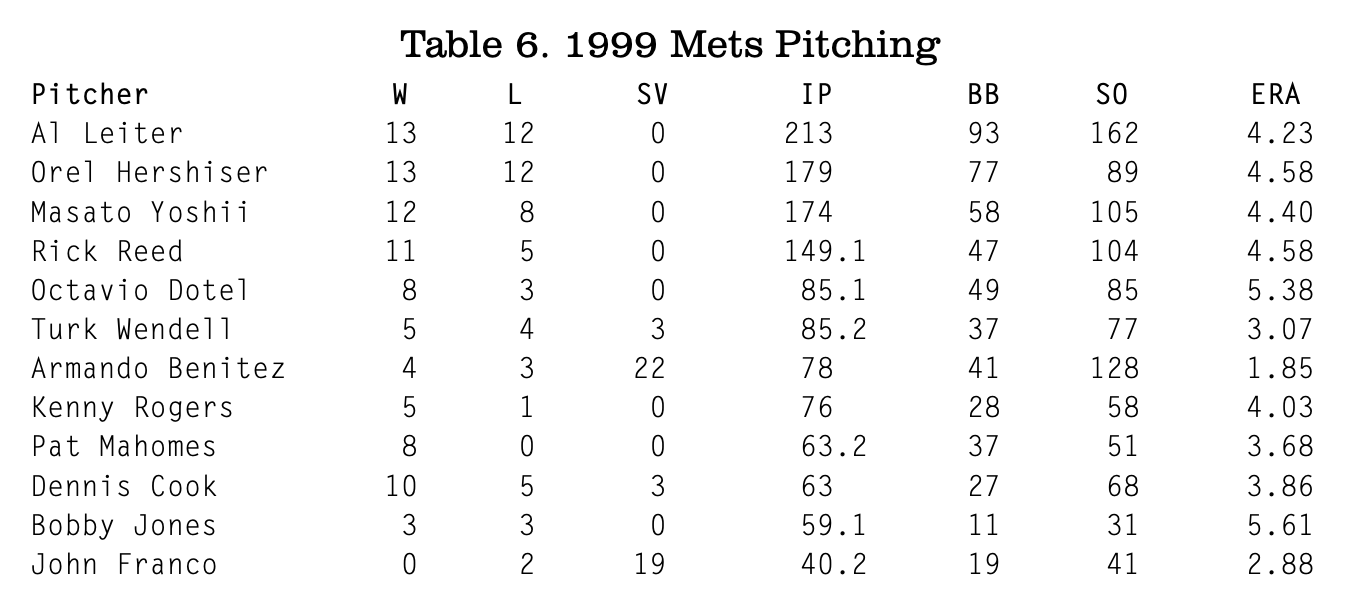
Table 6 shows the statistics of the key Met pitchers. The team was fifth in ERA in the NL at 4.28. The pitching staff was helped by the fact that the Mets also only made 68 errors that year, by far the lowest in the league, and also a record at that time. Every other team made at least 100.
The least balanced team was the 1987 Royals. They had a fairly weak hitting attack, with an OFF of just 88.32. Table 7 shows the Royals’ key hitters. Seitzer, Tartabull, and Brett all had good years, but the rest of the hitters did not. The Royals were last in runs scored, averaging 4.41 runs per game (and tied for next-to-last in OPS). Their park factor was 106 that year, meaning it was a slightly better than average run environment.
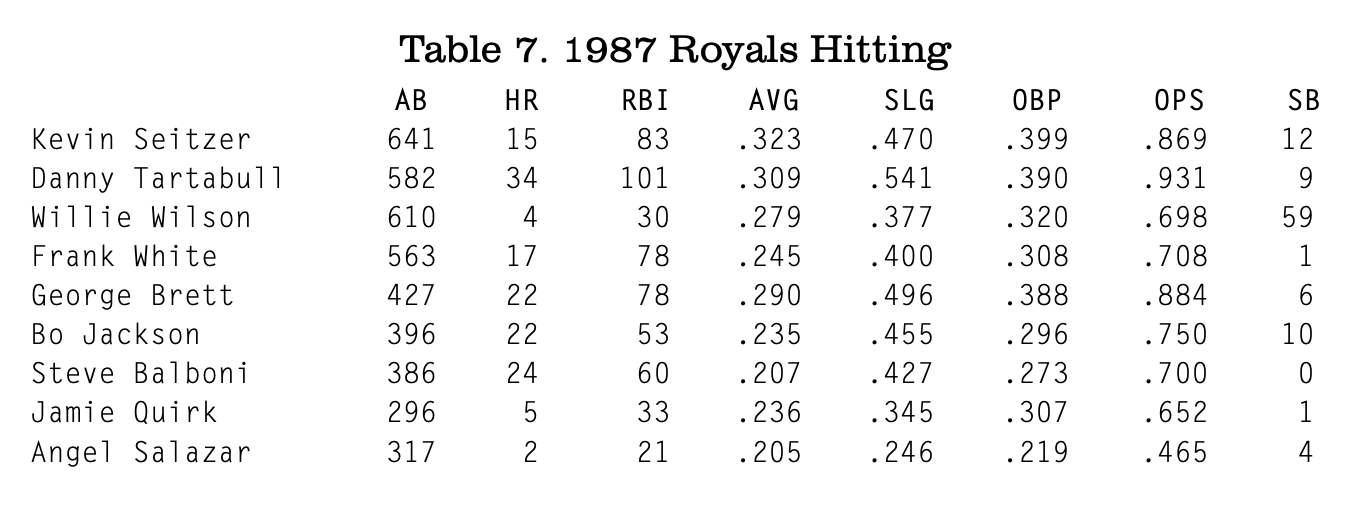
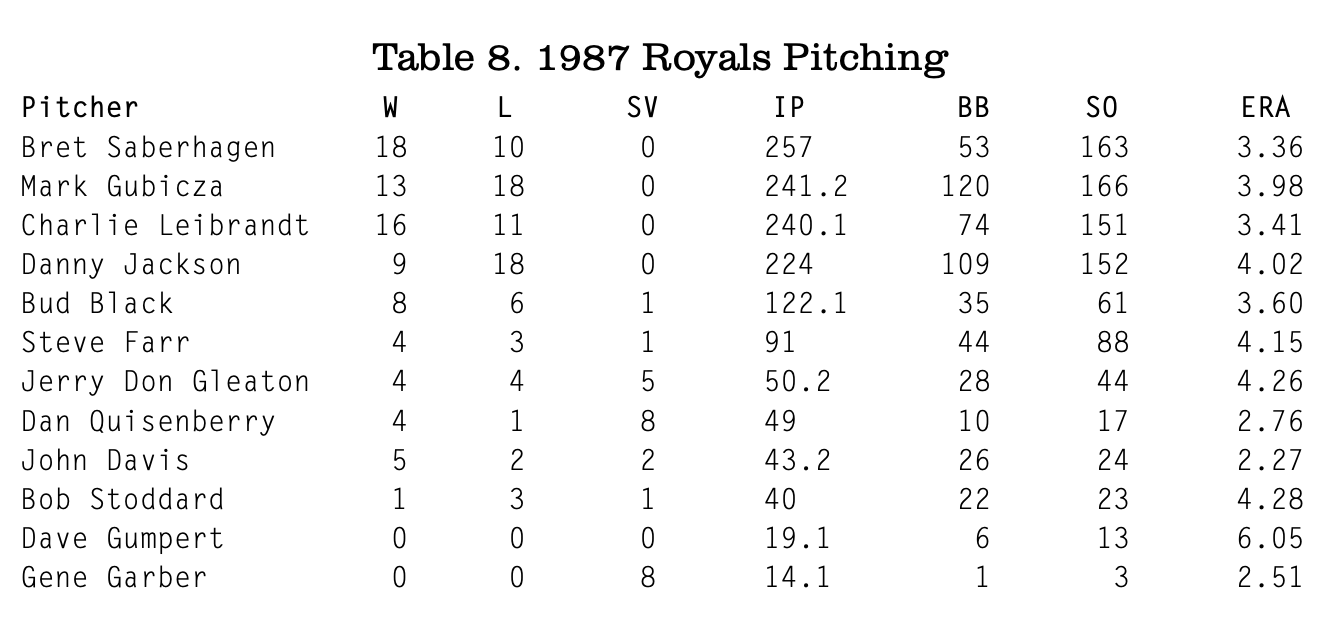
Table 8 displays the Royals’ pitchers. Saberhagen, the leader of the staff, was a two-time Cy Young Award winner. The Royals were second in the league in ERA at 3.87, only .13 behind the league-leading Toronto Blue Jays (a little impressive since their park was favorable to hitters). Frank White (2B) won the last of his eight Gold Gloves. Willie Wilson had one career Gold Glove, but not in 1987.
Balance seems to matter very little. More balance, holding everything else constant, only slightly increases winning percentage. The most balanced teams don’t win more than the least balanced teams. The teams with the best and worst winning percentages are no more or less balanced than other teams. Even in specific cases where teams saw a big change in balance, like the 1981–82 Twins, the 2001–02 A’s, and the 2002–03 Braves, winning percentage hardly changed. General managers should concentrate on improving teams in any way that they can and should not worry if their team is balanced or not.
CYRIL MORONG, a member of SABR since 1995, teaches economics at San Antonio College and is a lifelong White Sox fan. This article benefited from comments made by David Gassko. An earlier version of this article originally appeared at the Beyond the Boxscore website.