

Balancing Starter and Bullpen Workloads in a Seven-Game Postseason Series
This article was written by David J. Gordon
This article was published in Fall 2023 Baseball Research Journal
One of major league baseball’s most enduring trends over its one and a half centuries has been the distribution of the innings workload among an ever-increasing number of pitchers. When the National League opened for business in 1876, only 34 pitchers (just over four per team) were needed to navigate the 26-week season, in which eight teams played a total of 260 games (about 2.5 games per team per week).1 Only 23 pitchers started games (fewer than three per team), and they completed 472 of their 520 starts, 91%.2 In 2022, with 30 teams playing nearly every day, 871 pitchers saw action (29 per team!), and less than one percent of starts (0.75%) resulted in a complete game.3
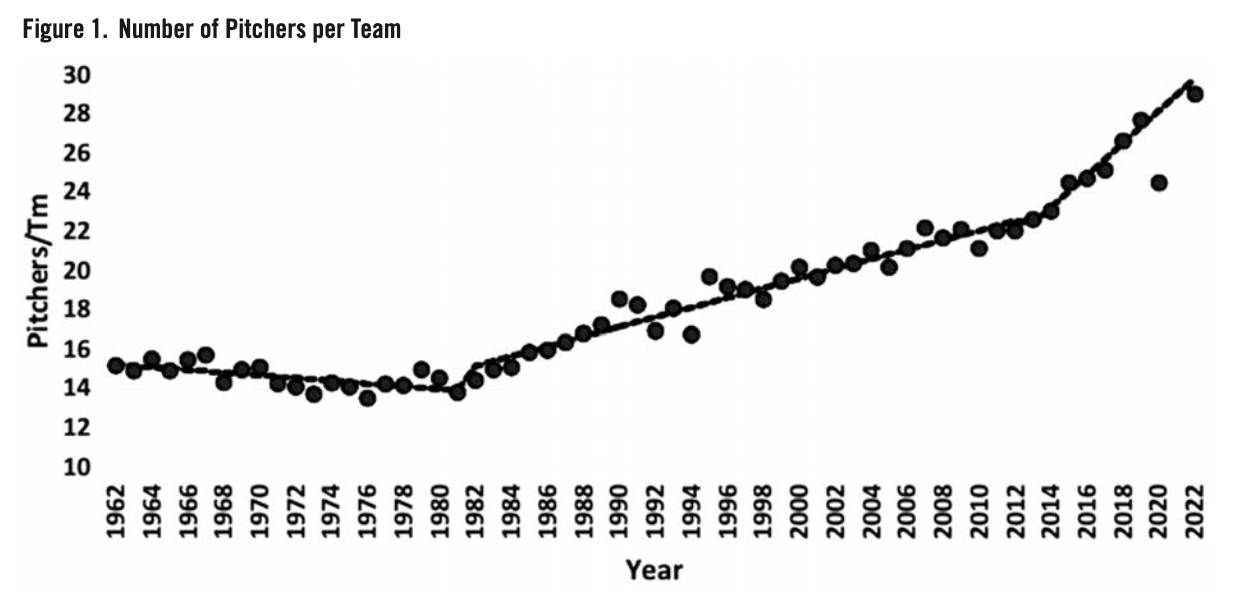
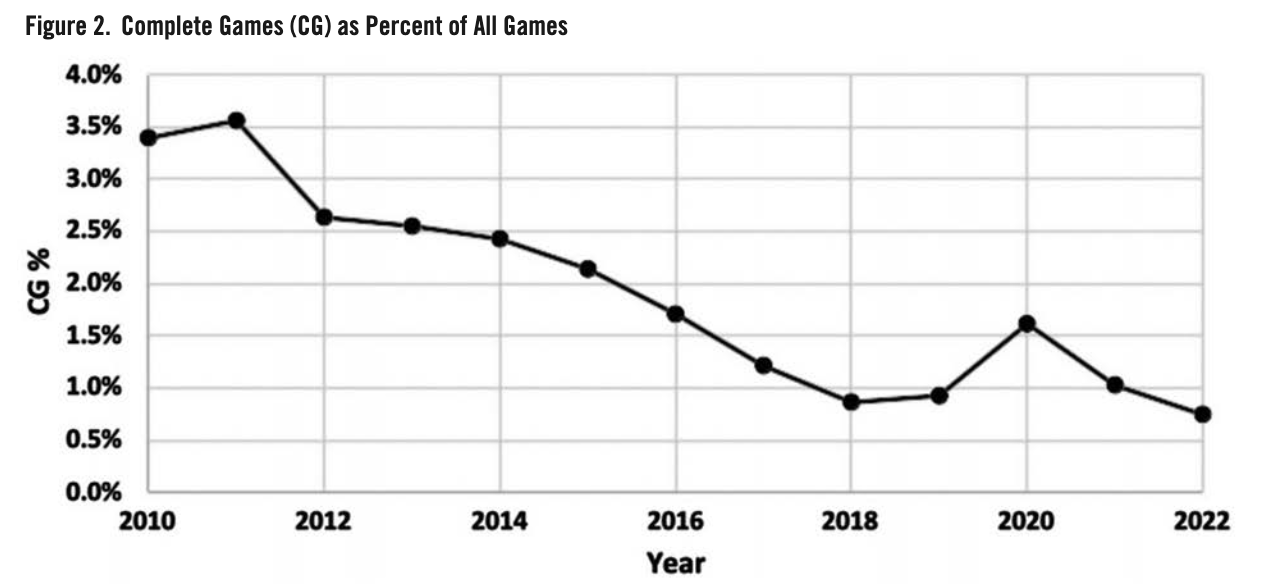
Although the early expansion of the number of pitchers per team was dictated by the demands of throwing overhand with high velocity and the greater frequency of games, this trend has persisted even after the schedule stabilized at 162 games in 1962 (Figure 1). After 20 years of stability at 15 pitchers per team, this number began to creep upward at a rate of one extra pitcher every four years from 1983 to 2012 (as shown by the dashed trend lines, which ignore the pandemic-shortened 2020 season). From 2013–22, this rate of increase accelerated threefold, as the number of pitchers per team climbed from 22.6 to 29 over a nine-year period. During this same period, the percentage of complete games, already in decline, fell by more than two-thirds from 2.55% to 0.75% (Figure 2).
The mainstreaming of analytics—a novelty when Michael Lewis wrote Moneyball in 2003—to a standard department of every major-league front office has undoubtedly played a prominent role in the acceleration of the trend toward expansion of major-league pitching staffs and the advancing extinction of complete games.4 Specifically, the observation that starting pitchers, on average, lose effectiveness after two turns through the batting order has transformed how the workloads of major-league pitching staffs are managed. Although this concept dates as far back as 1996, the “times through the order penalty (TTOP)” was first formally elucidated and quantified in late 2013.5
Quantitatively, opposing hitters gain roughly 10 to 15 points in weighted on-base average (wOBA) each time a pitcher cycles through the lineup.6 Studies have suggested that the TTOP is larger in pitchers who rely heavily on fastballs than in pitchers with more varied repertoires, who can afford not to show all their best pitches early in the game.7 This suggests that the TTOP at least partially reflects the advantage conferred by opposing batters’ growing familiarity with the pitcher’s offerings over the course of a game and not just pitcher fatigue. To avoid paying the TTOP, managers have made it their standard practice to remove a starting pitcher when the batting order turns over for the third time, regardless of pitch count, even if he is throwing a no-hitter. The performance of Hall of Famer Roy Halladay, who completed more than a quarter of his starts (42/162) in 2007–11 seems almost as old-fashioned today as Iron Man Joe McGinnity’s 1903 feat of pitching and winning both games of a doubleheader three times in one month seemed in Halladay’s time.8
Of course, the downside of removing starting pitchers after two turns through the batting order—typically about five innings—is that relief pitchers have to make up the difference. Major league teams have addressed this problem by carrying an eight-man bullpen (including several pitchers with options remaining) and shuttling in fresh relievers as needed from their triple-A affiliates. The implementation of the automatic runner rule in extra innings in 2020, which tends to curtail the number of extra innings, and the use of non-pitchers to pitch in lopsided games have also helped lighten bullpen workloads. Since teams rarely face each other more than four games in a row, there is little chance of overexposure to opposing lineups. However, this all changes in the League Championship Series and World Series, where teams must face each other up to seven times in nine days with a fixed pool of 12–13 pitchers, in which replacements are permitted only for significant injuries, and where there are no automatic baserunners to shorten extra-inning games.
This paper will describe and quantify the progressive degradation in the performance of relief pitchers who make three or more appearances during a best-of-seven postseason series. Specifically, it will test the hypothesis that relief pitchers lose effectiveness over the course of a single postseason series—especially those relief pitchers who are used most frequently and heavily.
METHODOLOGY
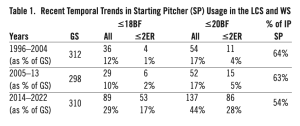
This paper will focus on the 27 best-of-seven postseason series (nine World Series and 18 League Championship Series) that took place from 2014 through 2022. I chose to begin with 2014 because it is the season when the concept of the times through the order penalty first gained traction, as evidenced by the sharp upturn in the yearly growth of the number of pitchers per team (Figure 1). While the fixed nature of postseason rosters precludes using number of pitchers per team as a metric, Table 1 compares several more directly relevant measures of changes in the usage of starting pitchers in the nine-year period of interest to the two preceding nine year periods (1996–2004 and 2005-13).9
The similarity of the first two time periods suggests that these metrics were relatively stable before 2014. However, the unmistakable differences between the most recent time period (2014–22) and the two earlier time periods is consistent with the in-season data. The percentage of innings pitched by starters fell from 63–64 in 1996–13 to 54 in 2014–2022. In 1996–2013, nearly 90% of starters faced at least 18 batters (i.e., two times through the batting order), and 83% faced at least 20 batters. These rates fell sharply to 71% and 56% in 2014–22. Most tellingly, before 2014, it was rare (less than 5%) for a pitcher who had yielded two or fewer runs to be lifted before facing 20 batters and almost unheard of (1–2%) for such a pitcher to be removed before facing 18 batters (barring injury or an early bout of wildness). In 2014–22, however, giving up two or fewer runs did not prevent 17% of starting pitchers from removal after 18 or fewer batters faced, and 28% from removal after 20 or fewer hitters. The data suggest that managers have carried their TTOP-influenced in-season approach to bullpen management into the postseason.
My analysis includes a total of 880 appearances by 244 pitchers who made three or more relief appearances in any of the 27 World Series, American League Championship Series, and National League Championship Series that took place in 2014–22.10 A relief pitcher who appeared at least three times in more than one such series is considered separately for each series in which he qualified. There were 127 pitchers who made exactly three appearances in a best-of-seven series; 90 who made four appearances; 24 who made five appearances; two who made six appearances; and one pitcher—Brandon Morrow of the Los Angeles Dodgers in the 2017 World Series—who appeared in all seven games. I have treated six appearances by “openers” as the equivalent of relief appearances, since the managers’ intent was to replace them after no more than an inning or two and since all their other appearances in the series came in relief.
My metric of pitcher efficacy, wOBA, is a weighted sum of non-intentional walks (multiplied by 0.69), hit batsmen (0.72), singles (0.89), doubles (1.27), triples (1.62), and home runs (2.10)—i.e., wOB—divided by PA (batters faced minus sacrifice bunts minus intentional walks).11 The wOBA metric was chosen because of its strong correlation with runs scored, which has made it the metric of choice for previous analyses of times through the order penalty for starting pitchers. Although the precise weights used to calculate wOBA for regular season games vary slightly from season to season and by hitting environment, using season-by-season weights would have added undue complexity to the calculation of wOBA in postseason play without necessarily adding predictive value for runs scored.12
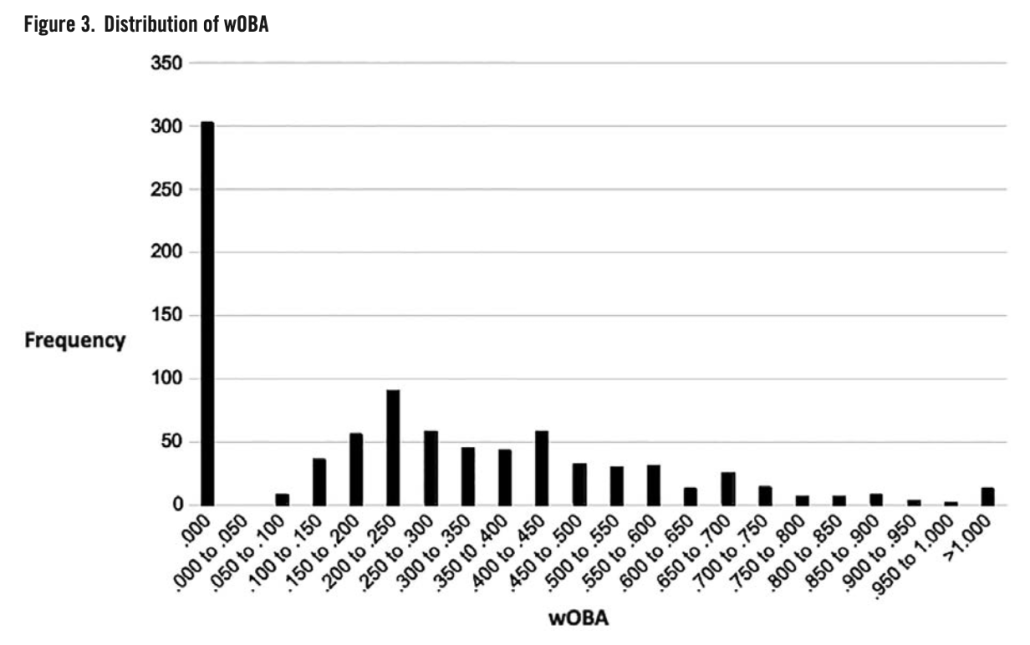
The distribution of wOBA for the 880 relief appearances in our database (Figure 3) is skewed and bimodal with the most frequent value being zero (n-303) and a secondary peak at .200–.250 (n=90).
Therefore, rather than use parametric analytic methods like ANOVA or linear regression, which assume a normal distribution, I used a more robust non-parametric analytic method—the Wilcoxon signed rank test, which makes no assumptions about the distributions being compared.13 In this method, the absolute value of non-zero differences in wOBA between each pitcher’s first appearance in a postseason series and his subsequent appearances (or groups of appearances) in the same series are ranked, and the sum of ranks (W) is calculated for pitchers who experienced an increase in wOBA after their initial appearance. For large samples like ours, the W statistic can be transformed as follows to a normally distributed Z-score:
Z=(W-n*(n+1)/4)÷SQRT(n*(n+1)*(2n+1)/24)
where n is the number of non-zero wOBA differences. All reported P-values are one-sided, with the null hypothesis being that the wOBA of opposing batters is not greater in a pitcher’s subsequent appearances than in his first appearance in a postseason series. Because the ALCS and NLCS cannot begin until the Wild Card and LDS are completed, it is impossible for a pitcher making his first appearance in the LCS or World Series to have faced the same opponent within at least a week.
The 880 individual relief appearances of each of the 244 pitchers in Figure 1 were classified according to the ordinal number of the appearance (first, second, third, fourth, etc.) and (for appearances other than the first in a series) according to their pitching load during the two days before a given appearance (defined as “red” for relievers appearing on consecutive days or facing five or more batters within the two days preceding an appearance) and “green” for all other relief appearances. (The selection of the cutoff between four and five PA is based on the observation that 4.2 PA was the mean for all 880 relief appearances.) Because wOBA are compared only within the same pitcher within the same series, differences in wOBA are not confounded by quality differences among pitchers. Table 2 illustrates the classification process for Aroldis Chapman of the Chicago Cubs in the 2016 World Series.14
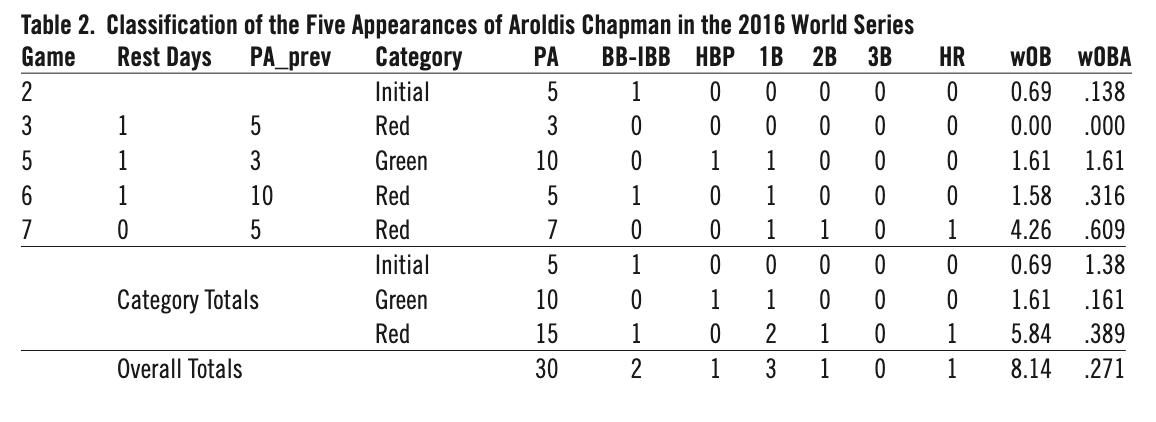
Overall, Cleveland batters made 30 plate appearances against Chapman in the 2016 Series; there were no IBB or sacrifice bunts. They collected two walks, one HBP, and five hits, the most damaging being a game-tying two-run home run by Rajai Davis in Game Seven. Chapman’s overall wOBA was a solid .271—but that doesn’t tell the whole story. His wOBA was less than .165 in his first three appearances, .316 in his fourth appearance, and a whopping .609 in his rocky fifth appearance. The fact that Chapman’s Game Six and Seven appearances came on consecutive days and that he had faced 10 batters in Game Five two days before Game Six may have contributed to his subpar performance in Game Seven. Concern about Chapman’s workload was expressed by contemporaneous commentators, particularly the aftereffects of his 2 2/3-inning save in Game Five, a 3–2 nailbiter that the Cubs had to win to stay alive.
Of course, one pitcher’s experience in one postseason series proves little. However, we shall see how this plays out among the 244 pitchers analyzed.
RESULTS
The cohort of 244 relief pitchers who made at least three appearances in a postseason series compiled a respectable .286 composite wOBA (1024.6 wOB in 3574 PA) in their 880 relief appearances. However, their average effectiveness (as measured by the wOBA of opposing batters) clearly declined over the course of a series. In Table 3, the wOBA for the second through the seventh appearance for each pitcher is compared with the wOBA for their initial appearance in the same series.
The severity of the performance decline increases from a .018 wOBA increase in a pitcher’s second appearance to a whopping .139 wOBA increase (P=0.054) for pitchers making their fifth series appearance. The number (3) of pitchers making six or seven appearances is too small to be analyzed. The .059 wOBA increase in the third appearance is highly significant (P=0.0053) and quantitatively larger than the TTOP for starting pitchers facing a lineup for the third time.15 The substantial wOBA increases for the fourth and the fifth appearances fall short of statistical significance (barely in the latter case) due to their smaller sample sizes. However, when the numbers for the second through seventh appearances are pooled to provide a large (244) sample size, the .297 composite wOBA is .041 higher than the .256 mean wOBA for the first appearance of the same cohort of pitchers—a highly significant difference (P<0.0001).
But Table 3 does not tell the whole story. The magnitude of the performance decline following a relief pitcher’s first appearance in a series depends on the spacing and length of a pitcher’s appearances. Specifically, has a pitcher had at least one day of rest since his preceding appearance? If he has had only a single day’s rest since his last outing, how many batters did he face in that appearance? In Table 4, the 636 (880-244) non-initial relief appearances are divided into four categories: 1) those coming after no days off, 2) those coming after exactly one day off but in which the reliever faced five or more batters in his most recent appearance, 3) those coming after exactly one day off and in which the reliever faced four or fewer batters in his most recent appearance, and 4) those coming after two or more days off.
In the first row of Table 4, we see that 180 of the 244 relievers made at least one appearance after pitching on the previous day. Opposing batters amassed a .310 wOBA in these appearances, in contrast to the .241 wOBA of these same 180 pitchers in their first appearance in the series. This .069 wOBA difference was highly significant (P=0.001). There were also 50 relievers who appeared following exactly one day of rest and who had faced at least five batters in their most recent appearance. Opposing batters lit up these pitchers for a .347 wOBA after compiling only a .216 wOBA against these same 50 pitchers in their first appearance in the series. This .131 wOBA difference was also statistically significant (P=0.005) despite the relatively small size of this cohort. The wOBA of opposing batters in the cohort of 94 pitchers who made at least one appearance after a single day’s rest but had faced four or fewer batters in their most recent appearance and n the cohort of 169 pitchers who made at least one appearance following two or more days of rest did not increase significantly after their first appearance in the series.
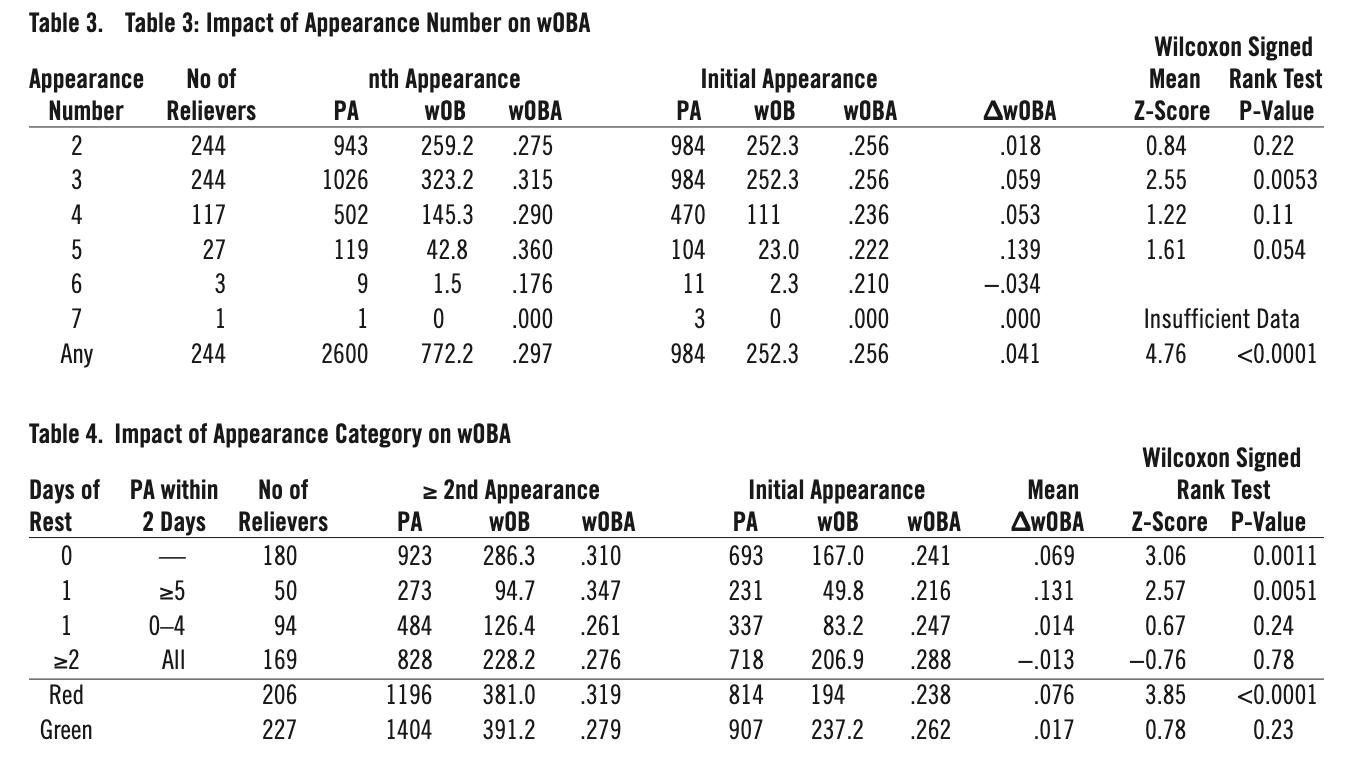
Based on the observed contrast between relief appearances made either on consecutive days or one day after facing at least five batters versus relief appearances made after a longer break, I combined the first two rows of Table 4 into a single category called “Red” appearances and combined the next two rows into a single category called “Green” appearances. Opposing batters compiled a .319 wOBA against the 206 pitchers who made at least one Red relief appearance—.076 higher than in their initial appearance of the series (P<0.0001). By contrast, opposing batters hit for a .279 wOBA against the 227 pitchers who made at least one Green appearance—only .017 higher than in their initial appearance of the series (P=0.23). Thus, based on the 244 pitchers in my database, each of whom made three or more appearances against the same team in a best-of-seven postseason series, managers need to heed the flashing red light when considering deploying a relief pitcher on consecutive days or one day after facing five or more batters in their previous outing. However, managers have a green light for deploying relief pitchers under scenarios in which they had at least two days rest or had been used lightly one day earlier.
DISCUSSION
There is little doubt that the conventional wisdom of limiting most starting pitchers to two turns through the order is generally a sound strategy during the regular season, when there are no seven-game series and fresh relievers can be easily shuttled in from AAA. Carrying a 13-man pitching staff and limiting the number of batters a starting pitcher must face not only avoids the TTOP but allows every pitcher to pitch at maximum effort while he is in the game, rather than to hold back to ensure he has something left for the later innings. But this calculus does not hold for postseason series, in which rosters are fixed and the opponent does not change. In the postseason, limiting starting pitchers in this manner inevitably opens the door to overwork and overexposure of relief pitchers.
My analysis cannot distinguish between the effects of overexposure of a relief pitcher who must face the same lineup repeatedly over the course of 4–7 games versus the effect of fatigue on performance. To address this issue, one would have to compare the effect of relievers working on short rest against the same versus differing opponents during the regular season. Josh Kalk in the Hardball Times has suggested that fatigue may affect different relief pitchers differently, hurting those who rely on fastballs or sinkers, and neutral for those who rely on sliders.16 But regardless of whether we are dealing with overexposure, fatigue, or both, relief pitchers’ diminished effectiveness in “Red Category” situations is something managers ought to consider in their postseason pitching decisions. Focusing only on the TTOP of starters in the LCS and WS, when a pitching staff must face the same team up to seven times in nine days without the luxury of streaming in fresh bullpen arms from AAA, is a recipe for trouble. A comparison of two classic winner-take-all World Series games 25 years apart illustrates the intervening sea change in postseason bullpen strategy (Table 5).17
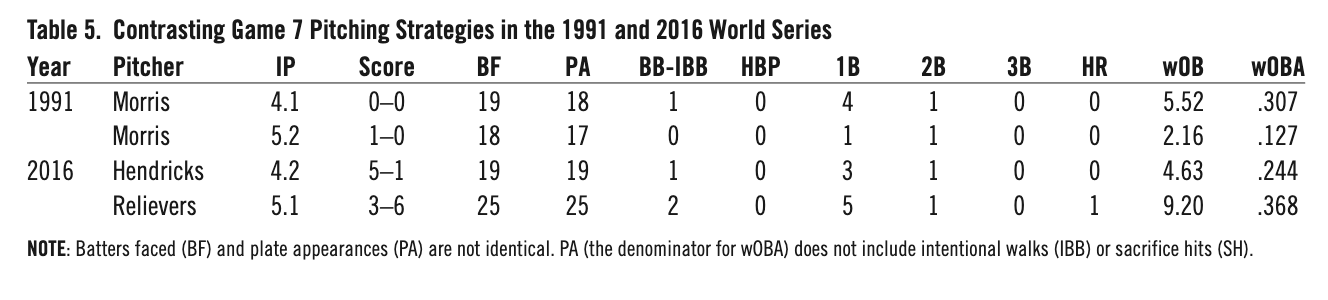
Game 7 starters, veteran Twins ace Jack Morris (18–12, 3.43 ERA) and budding Cubs ace Kyle Hendricks (16–8, 2.16 ERA), were each coming off highly successful seasons in 1991 and 2016, respectively, and had pitched well in their preceding World Series starts. Morris had given up 3 ER in 13 IP in Game 1 (a win) and Game 4 (no decision), while Hendricks had been used lightly, having given up no runs in 4.1 IP (no decision) in the Cubs’ Game 3 win. Hendricks’s short stint in WS Game 3 was atypical; before that, he had logged at least 5 IP in all of his 30 regular season starts and in two of four prior postseason starts in 2016.18,19 He had logged at least 6 IP in 21 of these previous 34 starts.
Both Morris and Hendricks were inefficient in the early innings of their Game 7 starts, finishing two full turns through the opposing batting order before completing the fifth inning, but had nevertheless entered the fifth inning relatively unscathed. Morris began the fifth inning of a scoreless game by putting Atlanta runners on first and third with one out to bring his wOBA to .307 for the game. But Twins manager Tom Kelly, blissfully unaware of the TTOP, allowed Morris to pitch out of trouble. Morris then proceeded to allow only two more hits in the ensuing 5.2 IP to complete a 1–0, 10-inning shutout. His .127 wOBA in his last two turns through the batting order was .180 less than that during his first 2.1 turns.
By contrast, Cubs manager Joe Maddon, acutely aware of the TTOP, lifted Hendricks in favor of veteran ace Jon Lester after he walked Carlos Santana with two outs in the fifth inning, despite the fact that Hendricks was well-rested, enjoyed a 5–1 lead, and had held Cleveland to a meager .244 wOBA up to that point. Lester, who had pitched six innings in Game 5 three days earlier, quickly allowed the inherited runner plus another run to score before finishing the inning. The overworked and overexposed Aroldis Chapman (Table 2) then replaced Lester with two outs and a man on first in the eighth inning and promptly blew the Cubs’ 6–3 lead before recovering to hold off any further damage through the ninth inning. Carl Edwards (third appearance) and Mike Montgomery (fifth appearance) held Cleveland to one run in the 10th inning after the Cubs had retaken a two-run lead.
Overall, the Cubs’ bullpen was torched for a .368 wOBA over the final 5.1 IP (.124 worse than Hendricks’s .244 wOBA). While things ended happily for both the 1991 Twins and 2016 Cubs, their bullpen strategies could not have differed more starkly.
The point of this illustration is not to praise Kelly or fault Maddon; both managers were merely following the conventional wisdom of their times. In 1991, even the most trigger-happy manager would not have considered removing his ace from a scoreless game in the fifth inning, but Kelly would not have looked so smart if Morris coughed up another hit or two and given Braves starter John Smoltz all the margin he needed to win the game and close out the Series.
Similarly, Maddon’s Game 7 strategy might have worked better had the Cubs not dug a 1–3 hole in Games 1–4 that left him little choice but to ride Chapman hard in Games 5–6. In general, the strategy of routinely removing an effective starter in the fifth or sixth inning when the batting order turns over for the third time may win some games early by rescuing starters from the TTOP, but it leaves a shortfall of IP that must be covered by overusing a limited pool of relievers later in the series. This analysis strongly suggests that the deleterious effect of using relievers in “Red” situations—as much as .076 in wOBA—substantially outweighs the deleterious effect—approximately a .030 increase in wOBA— of the TTOP on starters.
Thus, a manager who rigidly removes his starter after two turns through the batting order, regardless of how well he is pitching, will often find himself in Maddon’s predicament with no fresh relievers when the Series is on the line in Game 7—a short-sighted strategy at best. Protecting your starters from the significant but relatively small TTOP at all costs does no good if your best high-leverage relievers become fatigued and/or “old hat” to opposing hitters by the time they are needed in the deciding game.
In short, during the postseason far more than in the regular season, a manager must be mindful not only of the possibility of overextending his starters, but of the even more damaging possibility of overexposing his relievers to opposing batters. A rigid TTOP-based algorithm forbidding starting pitchers from being allowed to face batters a third time, no matter what, is ill-suited to the framework and roster constraints of the postseason.
DAVID J. GORDON, MD, PhD is a retired medical scientist and long-time Cubs fan, who joined SABR in 2016. Since 2016, he has authored six BRJ papers and a book called Baseball Generations (published by Summer Game Books). He has a keen interest in baseball history and in metrics to assess career value across historic eras.
Acknowledgments
I would like to thank my friend Richard Cohn, PhD, a statistical consultant from Chapel Hill, North Carolina, for guiding my statistical analysis to control for differences among pitchers without assuming normality of the distribution of wOBA changes.
Erratum
In the author’s previous contribution to the Baseball Research Journal, “Standardized Peak WAR,” one table and two figures were omitted. The corrected article is online at https://sabr.org/journal/article/standardized-peak-war-spw-a-fair-standard-for-historical-comparison-of-peak-value.
Notes
1 Pitchers in 1876 also threw underhand from behind a line 45 feet from home plate. “Major League Pitching Year-By-Year Averages,” Baseball-Reference, https://www.baseball-reference.com/leagues/majors/pitch.shtml.
2 “Player Pitching Season & Career Stats Finder (1876),” Stathead Baseball, https://stathead.com/baseball/player-pitching-season-finder.cgi?request=1&order_by=p_bfp&year_min=1876&year_max=1876&ccomp%5B1%5D=gt&cval%5B1%5D=1&cstat%5B1%5D=p_bfp.
3 “Major League Pitching Year-By-Year Averages,” Baseball Reference.
4 Michael Lewis, Moneybal The Art of Winning an Unfair Game (New York: W. W. Norton & Company, 2004).
5 David W. Smith, “Do Batters Learn During a Game?” Retrosheet, June 7, 1996; Tom M. Tango, Mitchel G. Lichtman, Andrew E. Dolphin, The Book: Playing the Percentages in Baseball (Washington: Potomac Books, 2007; Lichtman, “Baseball ProGUESTus: Everything You Always Wanted to Know About the Times Through the Order Penalty,” Baseball Prospectus, November 5, 2013, https://www.baseballprospectus.com/news/article/22156/baseball-proguestus-everything-you-always-wanted-to-know-about-the-times-through-the-order-penalty/.
6 Piper Slowinski, “wOBA,” FanGraphs, February 15, 2010, https://library.fangraphs.com/offense/woba/; Chris Teeter, “Pitcher’s Pitch-Type Arsenal and Getting Through the Order,” Beyond the Boxscore, January 15, 2014, https://www.beyondtheboxscore.com/2014/Lt15/5308808/pitchers-pitch-type-arsenal-and-getting-through-the-order.
7 Mitchel G. Lichtman, “TTOP and a Starting Pitcher’s Repertoire,” MGL on Baseball, November 11, 2013, https://mglbaseball.wordpress.com/2013/11/11/ttop-and-a-starting-pitchers-repetoire/; Ethan Moore, “Pitch Quality 3: Times Through The Order,” Prospects 365, July 8, 2020, https://prospects365.com/2020/07/08/pitch-quality-3-times-through-the-order/; Moore, “Pitch Quality 4: Solving the Times Through the Order Penalty,” Prospects 365, July 16, 2020, https://prospects365.com/2020/07/16/pitch-quality-4-solving-the-times-through-the-order-penalty/.
8 “Roy Halladay,” Baseball Reference, https://www.baseball-reference.com/players/h/hallaro01.shtml; Don Doxsie, “Joe McGinnity,” Society for American Baseball Reasearch, https://sabr.org/bioproj/person/Joe-McGinnity/.
9 “Player Pitching Game Stats Finder (1996-2013 Postseason Starters),” Stathead Baseball, https://stathead.com/baseball/player-pitching-game-finder.cgi?request=1&match=player_game&order_by_asc=1&order_by=name_display_csk&year_min=1996&year_max=2022&comp_type=post&team_game_min=1&team_game_max=165&player_game_min=1&player_game_max=9999&is_pitcher=1&role=GS&days_rest_comp=%3D&location=pob&locationMatch=is&min_temperature=0&max_temperature=120&min_wind_speed=0&max_wind_speed=90.
10 “Player Pitching Game Stats Finder (2014-22 Postseason),” StatheadBaseball, https://stathead.com/baseball/player-pitching-game-finder.cgi?request=1&match=player_game&order_by_asc=0&order_by=name_display_csk&year_min=2014&year_max=2022&comp_type=post&team_game_min=1&team_game_max=165&player_game_min=1&player_game_max=9999&is_pitcher=1&role=anyGS&days_rest_comp=%3D&location=pob&locationMatch=is&min_temperature=0&max_temperature=120&min_wind_speed=0&max_wind_speed=90.
11 Slowinski, “wOBA.”
12 “wOBA and FIP Constants,” FanGraphs, https://www.fangraphs.com/guts.aspx?type=cn.
13 Myles Hollander and Douglas A. Wolfe, Nonparametric Statistical Methods, 3rd Edition (New York: John Wiley & Sons, 2013), 40-55; “Wilcoxon Signed-Ranks Test for Paired Samples,” Real Statistics Using Excel https://real-statistics.com/non-parametric-tests/wilcoxon-signed-ranks-test/.
14 “2016 World Series,” Baseball Reference, https://www.baseball-reference.com/postseason/2016_WS.shtml.
15 Lichtman, “Baseball ProGUESTus.”
16 Josh Kalk, “Do relief pitchers suffer from pitching back-to-back days?,” Hardball Times, April 2, 2008, https://tht.fangraphs.com/do-relief-pitchers-suffer-from-pitching-back-to-back-days/.
17 “1991 World Series,” Baseball Reference, https://www.baseball-reference.com/postseason/1991_WS.shtml; “2016 World Series,” Baseball Reference, https://www.baseball-reference.com/postseason/2016_WS.shtml.
18 “Player Pitching Game Stats Finder (Kyle Hendricks Regular Season Starts),” Stathead Baseball, https://stathead.com/baseball/player-pitching-game-finder.cgi?request=1&match=player_game&order_by_asc=0&order_by=p_ip&player_id_hint=Kyle+Hendricks&player_id_select=Kyle+Hendricks&player_id=hendri001kyl&year_min=2016&year_max=2016&comp_type=reg&is_pitcher=1&role=GS&days_rest_comp=%3D&location=pob&locationMatch=is&min_temperature=0&max_temperature=120&min_wind_speed=0&max_wind_speed=90.
19 “Player Pitching Game Stats Finder (Kyle Hendricks 2016 Postseason Starts),” Stathead Baseball, https://stathead.com/baseball/player-pitching-game-finder.cgi?request=1&match=player_game&order_by_asc=0&order_by=p_ip&player_id_hint=Kyle+Hendricks&player_id_select=Kyle+Hendricks&player_id=hendri001kyl&year_min=2016&year_max=2016&comp_type=post&team_game_min=1&team_game_max=165&player_game_min=1&player_game_max=9999&is_pitcher=1&role=GS&days_rest_comp=%3D&location=pob&locationMatch=is&min_temperature=0&max_temperature=120&min_wind_speed=0&max_wind_speed=90.