

Baseball Championship Windows: How Long Are They?
This article was written by Douglas Jordan
This article was published in Spring 2018 Baseball Research Journal
INTRODUCTION
 It is not unusual to hear a sports fan or announcer say something like, “The window for this team is closing.” But what exactly does this expression mean? The general notion is that a team has a limited number of years when it can contend for a championship. Saying the window is closing implies that the team in question has already utilized some of those few years, and will only contend for a year or two more. Unstated, but also implied, is that if the team doesn’t win soon it will have to rebuild, and will therefore not contend for a substantial amount of time.
For example, in a blog post following the 2014 season, Andy Martino of the New York Daily News wrote, “In Los Angeles, they are already gossiping about changes, and in Washington, they probably should be. This is what happens when the two best teams in the league lose in the first round, reiterate old disappointments, and creep closer to the end of their championship windows.”1
Similarly, writing about the Royals in August 2016, Rustin Dodd of the Kansas City Star wrote, “The Royals’ core will remain intact for one more season, and club officials appear focused on maximizing the opportunities for another run in 2017. The window, they say, is still open.”2 These two quotations exemplify the widespread belief that championship windows are temporary, and teams that do not win before the window closes will not contend for many years.
The purpose of this paper is to examine the idea of championship windows analytically. Is the typical window a couple of years, five to six years, or longer than that? If we make a few assumptions, we can look at what baseball history says about how long teams have contended for championships.
WHY ARE THERE WINDOWS?
 The concept of a championship window is based on the idea that a team needs a core of talented veteran players to contend. These players form the nucleus around which other less talented and/or experienced players are arrayed. But the core players, as a group, can only be in their collective prime for a limited period before age takes its toll. Conventional wisdom says this will put a natural limit on how long any given group of players can compete for a championship. In addition, talented core players whose contracts expire during a team’s window may be lured away by generous offers from other teams. Martino says this explicitly in his blog post: “The Nats’ run is almost finished, with Jayson Werth nearly 36, Ryan Zimmerman breaking down, and the following core players set to be free agents after next season: Clippard, Zimmermann, Ian Desmond and Doug Fister.”
Martino’s argument is speculation about the future, but the Philadelphia Phillies provide a relatively recent example of the process in hindsight. The Phillies finished 12 games behind the Mets in 2006 before making five consecutive playoff appearances from 2007 to 2011. The team won the championship in 2008 but lost the World Series in 2009. They’d lost in the divisional round in 2007, they lost in the NLCS in 2010, and they lost in the divisional round again in 2011. The Phillies have failed to make the playoffs since then.
In hindsight, the team clearly had a five-year window to compete for a championship. Why did this window close? Because the core position players on the championship team, Jimmy Rollins (MVP in 2007), Ryan Howard (MVP in 2006), Chase Utley, and Pat Burrell, were past their primes or gone by 2012. This also happened with the key components of the pitching staff: Cole Hamels (2008 World Series MVP), Jamie Moyer, and Brad Lidge. This example seems to confirm the traditional wisdom. The window closed when core players got old or left. But is this typical? Is it reasonable to assume that a similar dynamic will result in a five-year window for most teams? This question is investigated by looking at championship windows throughout baseball history.
METHODOLOGY
The basic methodology employed is to examine how long championship windows have lasted historically. This study begins in 1903 and ends with 2016. Analysis is done at the franchise level. This means, for example, that the results for the Philadelphia, Kansas City, and Oakland versions of the Athletics franchise are treated as one data set. All other teams that have relocated are treated similarly. Teams are referred to by their current name even if that name has a shorter history than another name. This means the data for the Nationals, for example, include the 36 years the team played as the Montreal Expos, and only 12 years as the Washington Nationals. Expansion franchises will obviously have far fewer years of data than franchises that have been extant since 1903.
But in order to look at championship windows historically, it is necessary to define what is meant (in hindsight) by a window. This is problematic, as there is no formal definition of a championship window. The specific rules used in this study are described in detail below, but the underlying philosophy is straightforward. A given year counts as part of a window if the team contends that year. The team doesn’t have to win the World Series; it just has to be in contention.
The difficulty, of course, lies in specifying what it means to be in contention. The problem of defining contention is compounded by structural changes in baseball since 1903. Major League Baseball has evolved from a pair of single-division, eight-team leagues with only one playoff team from each league to one thirty-team association with two conferences (which still bear the historical designations of AL and NL). Each league has three five-team divisions with two wild-card teams that also make the playoffs. These changes in structure are dealt with in this article by having two slightly different definitions of contention for the periods 1903–68 and 1969–2016. The year 1969 is chosen as the dividing line because that is when baseball switched to two divisions within each league.
With this in mind, the specific rules used to decide if a given year is included in a championship window for the 1903–68 period are shown below. A year counts as part of a window (or starts a window) if the year meets any of the following conditions:
- The team finishes in first or second place in its league.
- The team finishes in third (or worse) place and five (or fewer) games behind.
- The team wins 90 (or more) games.
- Once established, a window stays open if there is a single down year that fails to qualify under any of the previous three rules, but two consecutive non-competitive years closes an open window.
 These rules require some elaboration. Teams are allowed to finish second, regardless of games behind during this period, because a second-place finish means the team was better than six (1903–60) or more (1961–68) other teams. Using only games behind to define contention might be misleading because some very good teams finished second, many games behind, when another team had an extraordinary season. For example, the Yankees appeared in every World Series between 1949 and 1958 except for 1954. That year, they finished eight games out of first place, so it would appear they were not in contention by that standard. However, the Yanks won 103 games in 1954, but they finished in second place because the Indians won an extraordinary 111 games. It would not be accurate to say that 1954 should not be included in a championship window under these circumstances.
Rule number two says the window stays open with a third-place finish if the team finishes five or fewer games out of first place. Using five games as the cutoff is somewhat arbitrary, but a team that finishes five games behind could have been two or three games behind going into the last week of the season and then lost a few games to finish five games back. That team was clearly in contention even if it finished in third place. The 90-win rule is included because it is possible for a team to not qualify under the first three rules while winning 90 or more games. For example, the 1963 Twins won 91 games and finished third, 13 games behind the Yankees. Even with the third-place finish, that’s still a very good season and should count as a window year.
Finally, rule four is included because even good teams can have a bad year due to injury or uncharacteristic poor play. The window stays open if this happens for a single year, but the window is assumed to have closed if this happens in two consecutive years. An example of a single year not closing a window is the 1964 Dodgers, who finished in sixth place, 13 games out of first place. That poor year does not close the window between the team’s championships in 1963 and 1965. An example of two consecutive years closing a window is the Cardinals’ two down years in 1965 and ’66, when they finished seventh, 16½ games back; and sixth, 12 games back, respectively. These two down years closed a window between the championships they won in 1964 and ’67.
The rules defining a year that qualifies as part of a window after 1968 have to be modified because there are fewer teams in each division starting in 1969. A second-place finish out of four, five, or six teams is not necessarily good enough to count as a contending year. The specific rules used to decide if a given year is included in a championship window for the 1969–2016 period are given below. As with the earlier period, any year that qualifies under any of the following rules counts as part of (or starts) a window.
- The team finishes in first place or gets in the playoffs as a wild-card team.
- The team finishes in second or third place and five (or fewer) games behind.
- The team wins 87 (or more) games.
- Once established, a window stays open if there is a single down year that fails to qualify under any of the previous three rules, but two consecutive non-competitive years closes an open window.
In this time period, 87 wins is used as a qualifying standard because, both before and after the switch to two wild-card teams in 2012, teams that won 87 games consistently finished within five games of playoff contention. The introduction of a second wild-card team in 2012 does raise an additional question: Should all teams that are within five games in the wild-card race be considered in contention? The problem is that some of the teams in that category have roughly .500 records. For example, in 2015, Houston was the second wild-card team in the AL with 86 wins. A team within five games of that mark would have finished at exactly .500 for the season. Is that good enough to be considered contending? Although this is another judgment call, these teams are not considered contending for purposes of this analysis. The general notion of in contention implies being an above average team. Being within five games of the last wild-card qualifier does not really meet that standard.
Using these rules, all major-league franchises were examined to see when each franchise had an open championship window historically. Any two consecutive years of being in contention opens a championship window and any two consecutive years of being out of contention closes a window.
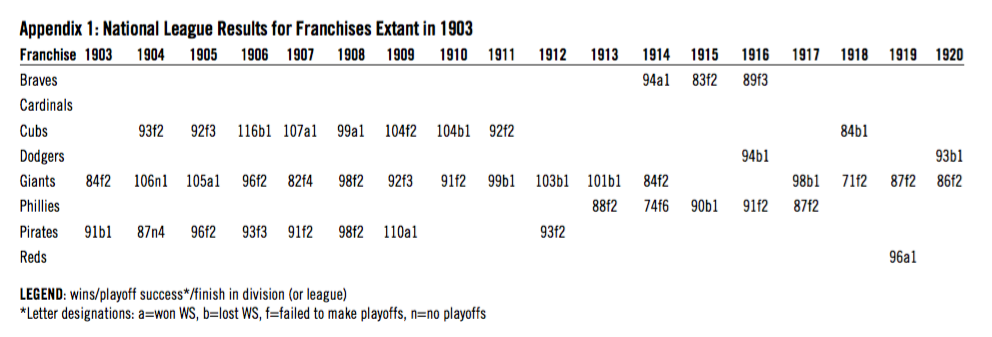
It is important to remember that having an open championship window and being in contention are not exactly the same thing because one down year does not close a window. For example, the 2013 Giants were a sub-.500 team (and therefore not in contention) but their championship window remained open that year because they won the World Series in 2012 and 2014. All data were obtained from Baseball-Reference.com. The full win-loss records and other raw data used in this research are interesting in themselves, but are too voluminous to be included in this article. Just a small subset of the data for the National League from 1903 to 1920 is shown in Appendix 1 to exemplify the raw data used.
RESULTS
The complete data set in the form shown in Appendix 1 is aggregated in order to determine how long championship windows have been open historically. The results are shown in Tables 1 and 2. The window lengths in these two tables are listed chronologically without specifying the years that window was open. For example, Appendix 1 shows that the Braves franchise’s first window was three years long, from 1914 to 1916. The Cubs’ first window lasted eight years, from 1904 until 1911. The first three in the Braves row and the first eight in the Cubs row of Table 1 show these window lengths without specifying when they occurred. Table 1 shows the complete results for the National League. Table 2 shows the results for the American League.
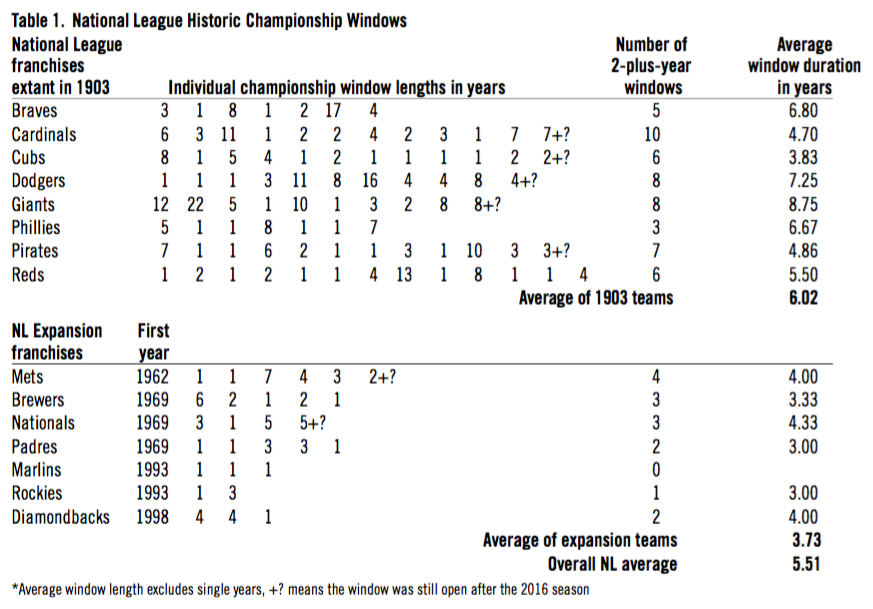
Table 1: National League Historic Championship Windows
(Click image to enlarge.)
Table 1 reveals that every NL team has had at least one single-year contention event. This phrase means that there was a single year where the team contended, sandwiched between two (or more) years of non-contention. But for purposes of this analysis, the question is: Should a single-year contention event be considered a window? Although this is debatable, single-year contention events will not be considered a window in this analysis, because the concept of a window closing implies an already open window. Therefore, a single-year contention event cannot be considered a true window. In terms of this paper, this means that single-year contention events (all of the 1s in Tables 1 and 2) are not included in the calculation of the average length of windows or the number of windows for each team in both tables.
So what can we learn from the data? In terms of number of windows, it’s not surprising that the expansion franchises have had fewer windows historically than the franchises that have been around since 1903. Among the latter, the Cardinals have had the most separate windows with 10, while the Phillies have had the fewest with three. The three longest windows are 22 years by the Giants (1917–38), 17 years by the Braves (1991–2007), and 16 years by the Dodgers (1970–85). The Giants have the longest average window duration at 8.75 years, while the average window duration of the 1903 teams as a group is just over six years. The average window duration for the expansion teams is 3.7 years, and the overall NL average window duration is 5.5 years. Seven of the NL franchises had windows that were still open after the 2016 season.
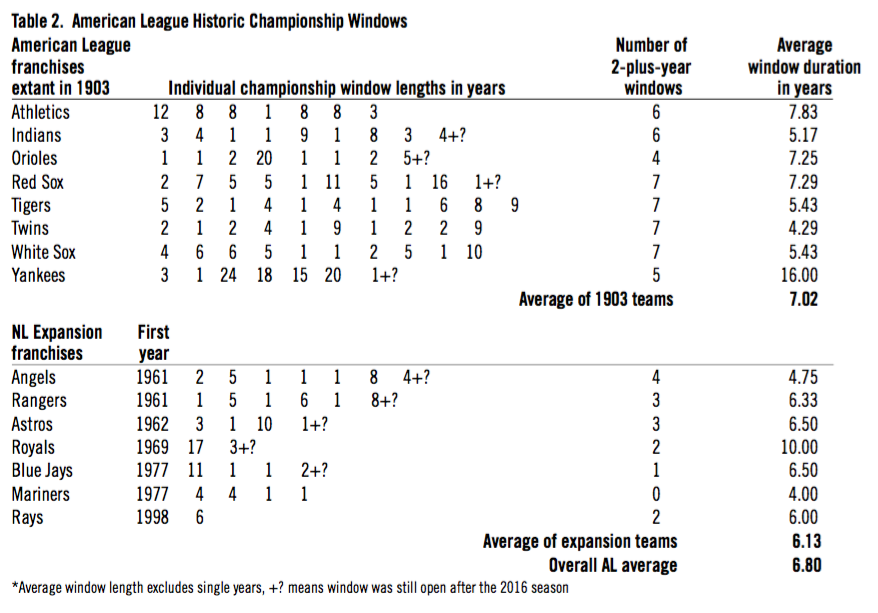
Table 2: American League Historic Championship Windows
(Click image to enlarge.)
Four AL franchises (Red Sox, Tigers, Twins, and White Sox) are tied at seven for the most individual windows. It’s not too much of a surprise that the Yankees own the longest window at 24 years (1920–43). The Yankees and the Orioles are tied for the second-longest AL window at 20 years (1993–2012 and 1964–83 respectively). The Royals and the Blue Jays have the longest windows among expansion teams at 17 years (1973–89) and 11 years (1983–93) respectively. This is in stark contrast to the NL, where none of the expansion teams even has a single double-digit window. In terms of average window duration, the five windows that the Yankees have constructed have an impressive average duration of 16 years. The expansion Royals are second in the AL with an average window duration of 10 years. The overall average window duration for the AL is 6.8 years, compared with 5.5 years in the NL. Nine of the AL franchises had a window that was still open after the 2016 season. The overall average window length for the two leagues combined is 6.14 years. The overall median window length is exactly five years.
DISCUSSION
The overall average of 6.14 years can be considered the answer to the original question of how long championship windows stay open historically. This number conforms to conventional wisdom and appears to be a reasonable answer. However, further consideration casts some doubt on this comfortable conclusion. Even though this average window length seems plausible, there is considerable dispersion of the data. At the low end, there are 25 two-year windows, while the longest window lasted an astounding 24 years. Therefore, the overall distribution of the data is examined in order to better understand the dispersion of window lengths. The results are shown in Table 3.
Table 3: Distribution of Window Lengths
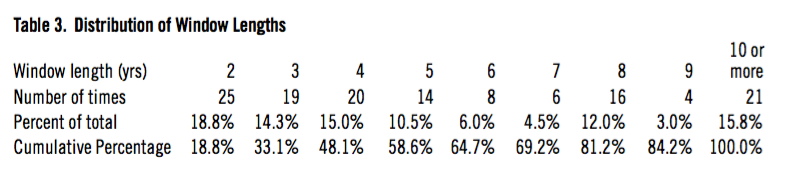
Table 3 shows that almost 20 percent of windows last just two years, and one-third of all windows exist for just two or three years. Just under half of all windows last two, three, or four years. This means (given a median to average window length of five to six years) that almost half of all windows are shorter than average. So it’s very common for windows to close sooner than five to six years. Just over 20 percent of windows exist for roughly the average of five, six, or seven years. However, in spite of the data being skewed toward window lengths of four or fewer years, there are also a lot of longer windows. Over 30 percent of all windows exist for eight years or more, and about one-sixth of all windows last for 10 or more years.
What do these dispersion data tell us? They tell us that the average window length of six years could be a misleading statistic. For example, after the 2016 season, the Cleveland Indians had a window that had been open for four years. Utilizing the data in this paper, a baseball writer or commentator might argue that the window for the Indians would be closing soon since the average window length is just six years. Although this sounds like a reasonable argument, the data show that many windows exceed the average and that it is entirely possible that the Indians’ window will last beyond the average length.
It should be noted that even though single-year contention events are not included in the data in Table 3, there are more of them than any other length of window. There are a total of 79 single-year contention events in Tables 1 and 2 and they make up about 37 percent of the 212 points in those two tables. This means that a previously non-contending team that suddenly has a season where it contends will only contend for a single year more than one-third of the time.
This is a sobering statistic for fans of formerly poorly performing teams that have a surprisingly strong season. There’s a good chance it won’t last more than that one year. And, for informational purposes, even though single-year contending events have not been included in the previous discussion, the average championship-window length when single-year contention events are included in the data is 4.23 years, with a median length of exactly three years. These numbers are compared to an average of 6.14 years and median of five years when single-year contention events are excluded.
THE IMPACT OF HIGH PAYROLLS
The overall championship window length of 6.14 years includes all major league teams. However, high-payroll teams have an advantage over low-payroll teams in terms of construction and maintenance of competitive rosters. Therefore, we can hypothesize that high-payroll teams will have longer championship windows than low-payroll teams. The data set used in the previous analysis allows this hypothesis to be tested. But before the results of that analysis are presented, the high-payroll elephant in the room (the Yankees) must be discussed. The Yankees’ average championship window length of 16 years is more than twice the average window length. Clearly, they are an outlier.
If the Yankees are removed from the data set, the overall average championship-window length for the rest of baseball is 5.76 years. This is a 0.38-year or 6.2 percent reduction by the removal of just one team. Which number, 6.14 years or 5.76 years, is a better reflection of reality, given that a good argument can be made that the Yanks are now, and have historically been, a special case? This is a tough call because it is always dangerous to arbitrarily remove data from any data set. Therefore, the data will be presented with and without the Yankees to show both cases.
In order to determine if high-payroll teams have longer window lengths than low-payroll teams, it is necessary to define what is meant by high payroll. Since payroll data for one year are not necessarily indicative of longer-term spending trends, the average of the last 15 years of payroll data is used to determine the top ten teams in terms of payroll.3 Not surprisingly, the Yankees, Red Sox, and Dodgers have the three highest average payrolls over the last 15 years. The average championship window length for the top ten payroll teams is 6.81 years. Removing the Yankees, the average window length for the nine remaining teams is exactly six years.
Although both of these numbers are higher than the similar number for all major league teams (6.14 years and 5.76 years respectively), the differences (especially without the Yankees) are not large enough to conclude that higher payroll teams have been able to consistently stay in contention better than low-payroll teams. Admittedly, this is a fairly simplistic way to look at this issue. An in-depth look at the question could be the subject of future research.
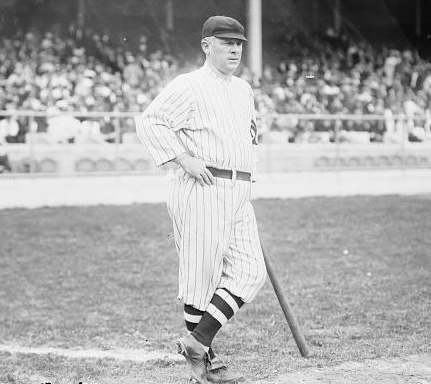 Given that the average championship window lasts five to six years, the question then becomes: How does a team keep a window open for 10 or more years? It’s clearly not easy to do, but there is one common feature in all of the teams that have accomplished it. That feature is superior management. One early example of superior baseball management was John McGraw, who managed the New York Giants from 1902–32. According to Leonard Koppett, “McGraw was exceptional in both his approach to the job, and the breadth of his influence.”4
According to the championship window rules in this paper, the Giants’ championship window was open for all but two of his 31 years managing the club. How were the Giants able to do that? Koppett argues that McGraw had a fierce will to win and instilled that ethos in his ballclubs. This, combined with his excellent judgment regarding a player’s capabilities, kept the Giants’ window open for most of McGraw’s tenure as manager.
All of the very long windows shown in Tables 1 and 2 were ultimately a product of excellent management. An entire paper could be written on each of those teams. And in fact, this is exactly what Mark Armour and Daniel Levitt do in their insightful book, In Pursuit of Pennants. Armour and Levitt argue, “Looking carefully, one can often identify differences between teams that consistently succeed and teams that struggle. Between evolving organizational frameworks and expanded or better sources of information, some teams have performed demonstrably better than others.”5
Each chapter of their book is focused on an example of an owner, general manager, or field manager (or some combination of those three people and the people who worked with them) who constructed a team that had sustained success over many seasons. Interestingly, the source of competitive advantage for the teams with extended success has varied over time.
A few brief examples from the book suffice to make the point. Jacob Ruppert created the first truly professionally run baseball organization and filled it with quality personnel. The great Yankees teams of the 1920s and ’30s were the result. Of course, Ruppert’s deep pockets and willingness to spend money also contributed. Branch Rickey was the first person to develop and take advantage of an extensive farm system for both the St. Louis Cardinals and Brooklyn Dodgers. Rickey also expertly exploited the formerly untapped pool of talented black players after Jackie Robinson’s debut in 1947.
The Big Red Machine was put together by Bob Howsam. Howsam’s trading expertise brought many of the great players on those teams aboard. How did he make all those great trades? He (and his full staff) studied not only what the Reds needed, but the needs of every other team also. More recently, Billy Beane and Theo Epstein have been able to successfully exploit baseball analytics. Although the details vary, these are all examples of how superior management utilized improved organization and/or informational advantages that ultimately resulted in sustained success on the playing field.
CONCLUSION
The results of this analysis show that the average length of a championship window is about six years, with a median length of five years. These figures conform to what is often anecdotally considered to be a team’s championship window. However, the average masks a wide variation in window lengths. About half of all windows last two, three, or four years, while about one-sixth of all windows are 10 years or longer.
The substantial number of long windows shows that championship windows don’t have to close just because a core of star players is aging. It is usually a lack of adroit management, primarily a failure to consistently find and integrate younger talent into an established team, that causes windows to close. The authors of In Pursuit of Pennants summarize the issue very well when they write, “But to create a long-term successful organization, management must also discover and institutionalize a competitive advantage, either by creating or by responding to an inflection point in the way the business operates.”6
DOUGLAS JORDAN is a professor at Sonoma State University in Northern California where he teaches corporate finance and investments. He’s been a SABR member since 2012. He runs marathons when not watching or writing about baseball. You can contact him at douglas.jordan@sonoma.edu.
Appendix 1: National League Results for Franchises Extant in 1903
(Click image to enlarge.)
Acknowledgments
I would like to thank two anonymous peer reviewers for their insightful comments. Their suggestions have improved the paper substantially.
Notes
1 Martino, Andy, “How will Los Angeles Dodgers and Washington Nationals seize what is left of their championship windows?” New York Daily News, October 8, 2014, http://www.nydailynews.com/blogs/baseballinsider/los-angeles-dodgers-washington-nationals-seize-left-championship-windows-blog-entry-1.1967785.
2 Dodd, Rustin, “Royals hope for fresh start in 2017, but championship window may be difficult to keep open,” Kansas City Star, August 6, 2016. http://www.kansascity.com/sports/mlb/kansas-city-royals/article94176677.html.
3 Baseball Cube, “Payrolls and Salaries,” http://www.thebaseballcube.com/extra/payrolls/. The top 10 teams in order of average payroll over the last 15 years, 2002–16, are: Yankees, Red Sox, Dodgers, Angels, Tigers, Phillies, Mets, Cubs, Giants, Cardinals.
4 Koppett, Leonard, The Man in the Dugout: Baseball’s Top Managers and How They Got That Way (New York: Crown Publishers, 1993), 43.
5 Armour, Mark L. and Levitt, Daniel R., In Pursuit of Pennants: Baseball Operations From Deadball to Moneyball (Lincoln: University of Nebraska Press, 2015), xiv.
6 Armour and Levitt, 399.