

Baseball’s Most Dominant Strikeout Pitchers
This article was written by J.P. Caillault
This article was published in 2004 Baseball Research Journal
Ever since Boston’s Pedro Martinez fired a one-hit, no-walks, 17-strikeout gem against then-defending World Series champion New York in Yankee Stadium in September 1999, a friend of mine has repeatedly said that he’d never seen, in the 30+ years he’s been watching the game, any pitcher be as consistently dominant as Martinez.
That made me wonder about which pitchers really were the most dominant and how to measure that dominance. The strikeout, symbolic of a batter’s complete futility against the pitcher, is one obvious measuring stick. Not the sheer number of strikeouts, but the frequency with which batters succumb to the dominant pitcher’s power.
Baseball fans have been bombarded by a barrage of new statistics over the last couple of decades and, as a result, are sophisticated enough to know that raw numbers, like the total number of strikeouts a pitcher racks up, are not necessarily indicative of the quality to be measured. For example, although Houston’s Roy Oswalt whiffed 206 batters last season, the Cubs’ Matt Clement (only 190 strikeouts) struck them out at a better clip, 9.45 per nine innings, compared to Oswalt’s 7.82 per nine innings.
But that simple correction to the raw number is really not sufficient to determine who was more dominant. And that’s the point of this article—there are additional factors (two of them) that must be taken into account if we truly want to determine which pitchers were baseball’s most dominant strikeout aces.
First, in order to compare pitchers across baseball’s different eras, the strikeout rate must be compared to the league average. Was NL Cy Young Award winner Randy Johnson’s 2001 season, in which he set an all-time major league record with a rate of 13.41 Ks per nine innings, really the most dominant strikeout season in baseball history? NL batters as a whole struck out 6.99 times per nine innings in 2001, so Johnson had almost twice the rate the league had.
But another Johnson, Hall-of-Famer Walter Johnson of the Washington Senators, was just as dominant back in 1924. Although “The Big Train” fanned batters at a league-leading clip of only 5.12 per nine innings, the league strikeout rate was a miniscule 2.68 per nine innings. The bottom line is that Johnson and Johnson had virtually the same strikeout rates when compared to their league averages!
The 1981 issue of the Baseball Research Journal featured an article by James P. Maywar in which he, too, compared pitchers’ strikeout per game rates with those of the league, but he took the difference between the two values rather than the ratio of the two; this is flawed because it favors pitchers in high strikeout eras.
For example, if a pitcher averaged 12 Ks per game when the league average was six per game, then he would be six per game better than the league. If another pitcher averaged six per game when the league average was two per game, then he’d only be four per game better than the league.
According to Maywar, the former would be the more impressive strikeout pitcher because his difference of six per game is larger than the latter’s difference of four per game. But the latter pitcher is three times better than average, while the former is only two times better than average.
The second correction that’s required is to calculate the strikeout rate per batter-faced-pitcher (BFP), not per nine innings (or 27 outs). Consider two pitchers who pitch the following two innings: pitcher A fans the first hitter he faces, gets the second batter to ground out, and whiffs the third man; pitcher B strikes out the leadoff hitter, gives up a double to the second batter, whiffs the third, walks the fourth, and fans the fifth. Three strikeouts in one inning for pitcher B, only two for pitcher A; so pitcher B has chalked up a rate of 27 strikeouts per 9 innings, while pitcher A only fans 18 per nine innings. But pitcher A struck out two of the three batters he faced (67%), while pitcher B only struck out three out of five (60%). Pitcher A in this example is actually the more dominant strikeout pitcher.
How about some real-life examples? In a game in June 2004, Colorado’s Jason Jennings struck out eight Yankees in 53 innings; a month later, San Diego’s David Wells struck out seven Royals in six innings. If we measured strikeout dominance strictly by Ks per inning, then Jennings would surpass Wells, 13.5 per 9 innings compared to 10.5 per 9 innings. But Jennings gave up 10 hits and 3 walks in that game, facing a total of 30 batters; Wells, meanwhile, pitched a nice four-hit, one-walk, six-inning effort in facing 21 batters. So Wells’ seven strikeouts against 21 batters (.333) was better than Jennings’s eight strikeouts against 30 hitters (.267).
We can see this effect clearly when looking at pitchers’ entire seasons, too. Take Minnesota’s Kyle Lohse’s stats from last season (111 Ks, 194 IP, and 883 BFP) and compare them with those of the Indians’ Jake Westbrook (116 Ks, 215q IP, and 895 BFP). Lohse struck out 5.15 per nine innings, while Westbrook only whiffed batters at a rate of 4.84 per nine innings. But Westbrook struck out .130 of the batters he faced (116/895), while Lohse struck out his opponents at a rate of just .126 (111/883).
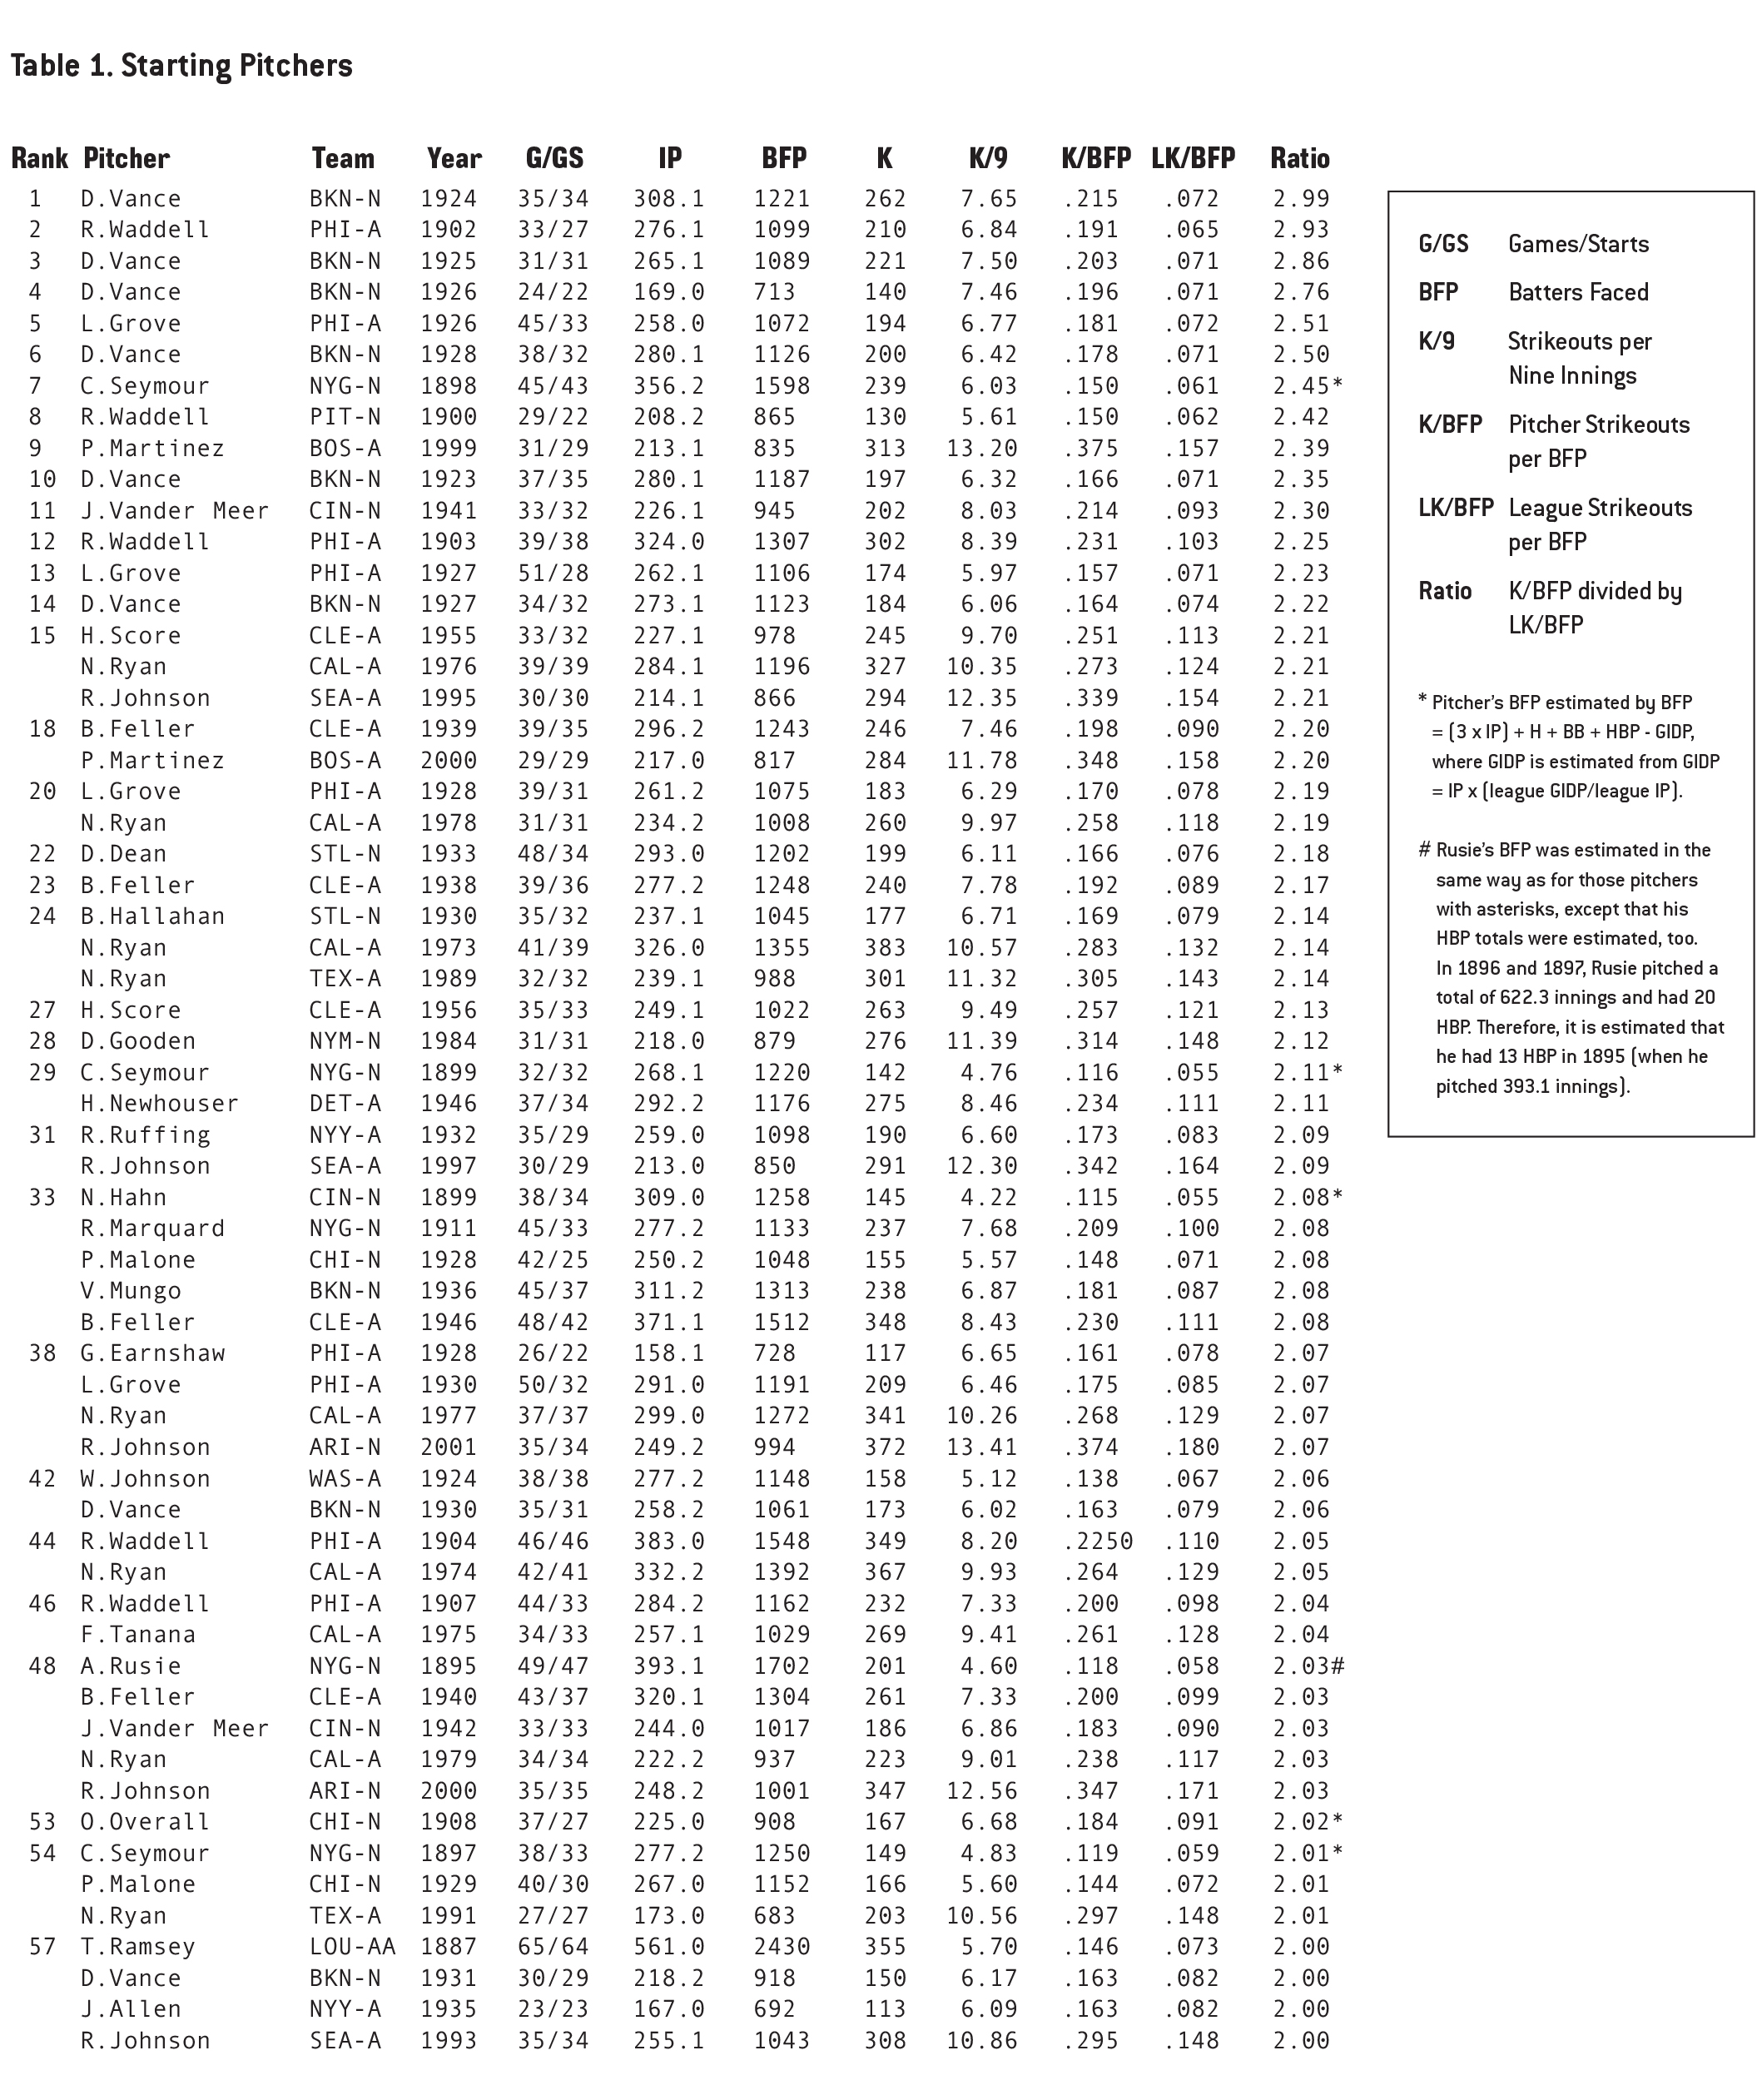
So which pitchers had the most dominant strikeout seasons in major league history? Where do multiple Cy Young Award winners Randy Johnson’s and Pedro Martinez’s recent great seasons rank on the all-time list? Table 1 lists all the seasons (60 of them) in which the ratio of a starting pitcher’s strikeout/BFP rate was at least double that of the league strikeout/BFP rate (in order to qualify, the pitchers had to have pitched at least one inning per team game and started at least 20 games).
The most dominant strikeout pitcher of all time was clearly Dazzy Vance of the 1920s Brooklyn Dodgers. His six seasons from 1923 through 1928 all rank in the top 14 all-time, including the best season ever (1924, when he was 2.99 times better than the league rate), three of the top four, and four of the top six! Vance had two other seasons on the top 60 list, too, for a total of eight. The second most dominant strikeout pitcher in baseball history was the Deadball Era’s Rube Waddell, who achieved the second highest single-season ratio ever (2.93, while pitching for Connie Mack’s Philadelphia Athletics in 1902) and two other seasons in the top dozen (another one with Philly in 1903 and one with the Pirates in 1900).
Other great pitchers who appear frequently at the top of the list are the Athletics’ Lefty Grove, who has three of the top 20 years (his 1926-28 seasons), and, predictably, all-time strikeout king Nolan Ryan, with two of the top 20 (both with California) and a total of eight times when he more than doubled the league rate.
The only active pitchers who appear on the list are, not too surprisingly, the Diamondbacks’ Johnson (five times) and the Red Sox’s Martinez (twice). In fact, the Boston ace’s fabulous 1999 season ranks as the 9th most dominant of all time, when he struck out batters at a rate 2.39 times better than the rest of the league. Martinez’s 2000 season also ranks in the top 20, as does Johnson’s 1995 season with Seattle. The outstanding season that Johnson had in 2001 (ratio of 2.07) also appears on the list, but only ranks in a tie for 38th place. (Walter Johnson’s 1924 season, by the way, is a just a notch behind, at 2.06.)
Compiling such a list generated many surprises, in terms of both those who appear on it and those who failed to make the cut. For example, Cy Seymour, perhaps best known for his spectacular hitting in 1905 when he won the NL batting championship while with Cincinnati, was a 19th-century strikeout king while pitching for the New York Giants (three times on the list, including the seventh most dominant strikeout season ever). The Reds’ Johnny Vander Meer, who forever locked up a place in baseball history when he hurled two consecutive no-hitters during the 1938 season, racked up the 11th most dominant strikeout season in 1941 and tied for 48th place with his 1942 season.
The most glaring absence is that of former single-season strikeout record holder Sandy Koufax. The Dodgers’ fireballing left-hander chalked up lots of Ks, but did so during the 1960s, when the strikeout rates rose dramatically, reaching record values that weren’t equaled again until the free-swinging 1990s. Other prominent strikeout artists whose names are missing from the list are Roger Clemens, Tom Seaver, Steve Carlton, and Sam McDowell. The reason for their absences is the same as that for Koufax: although they were outstanding strikeout pitchers, their high totals were achieved at times when strikeouts were easier to obtain than during the times when the pitchers who did make the list were pitching.
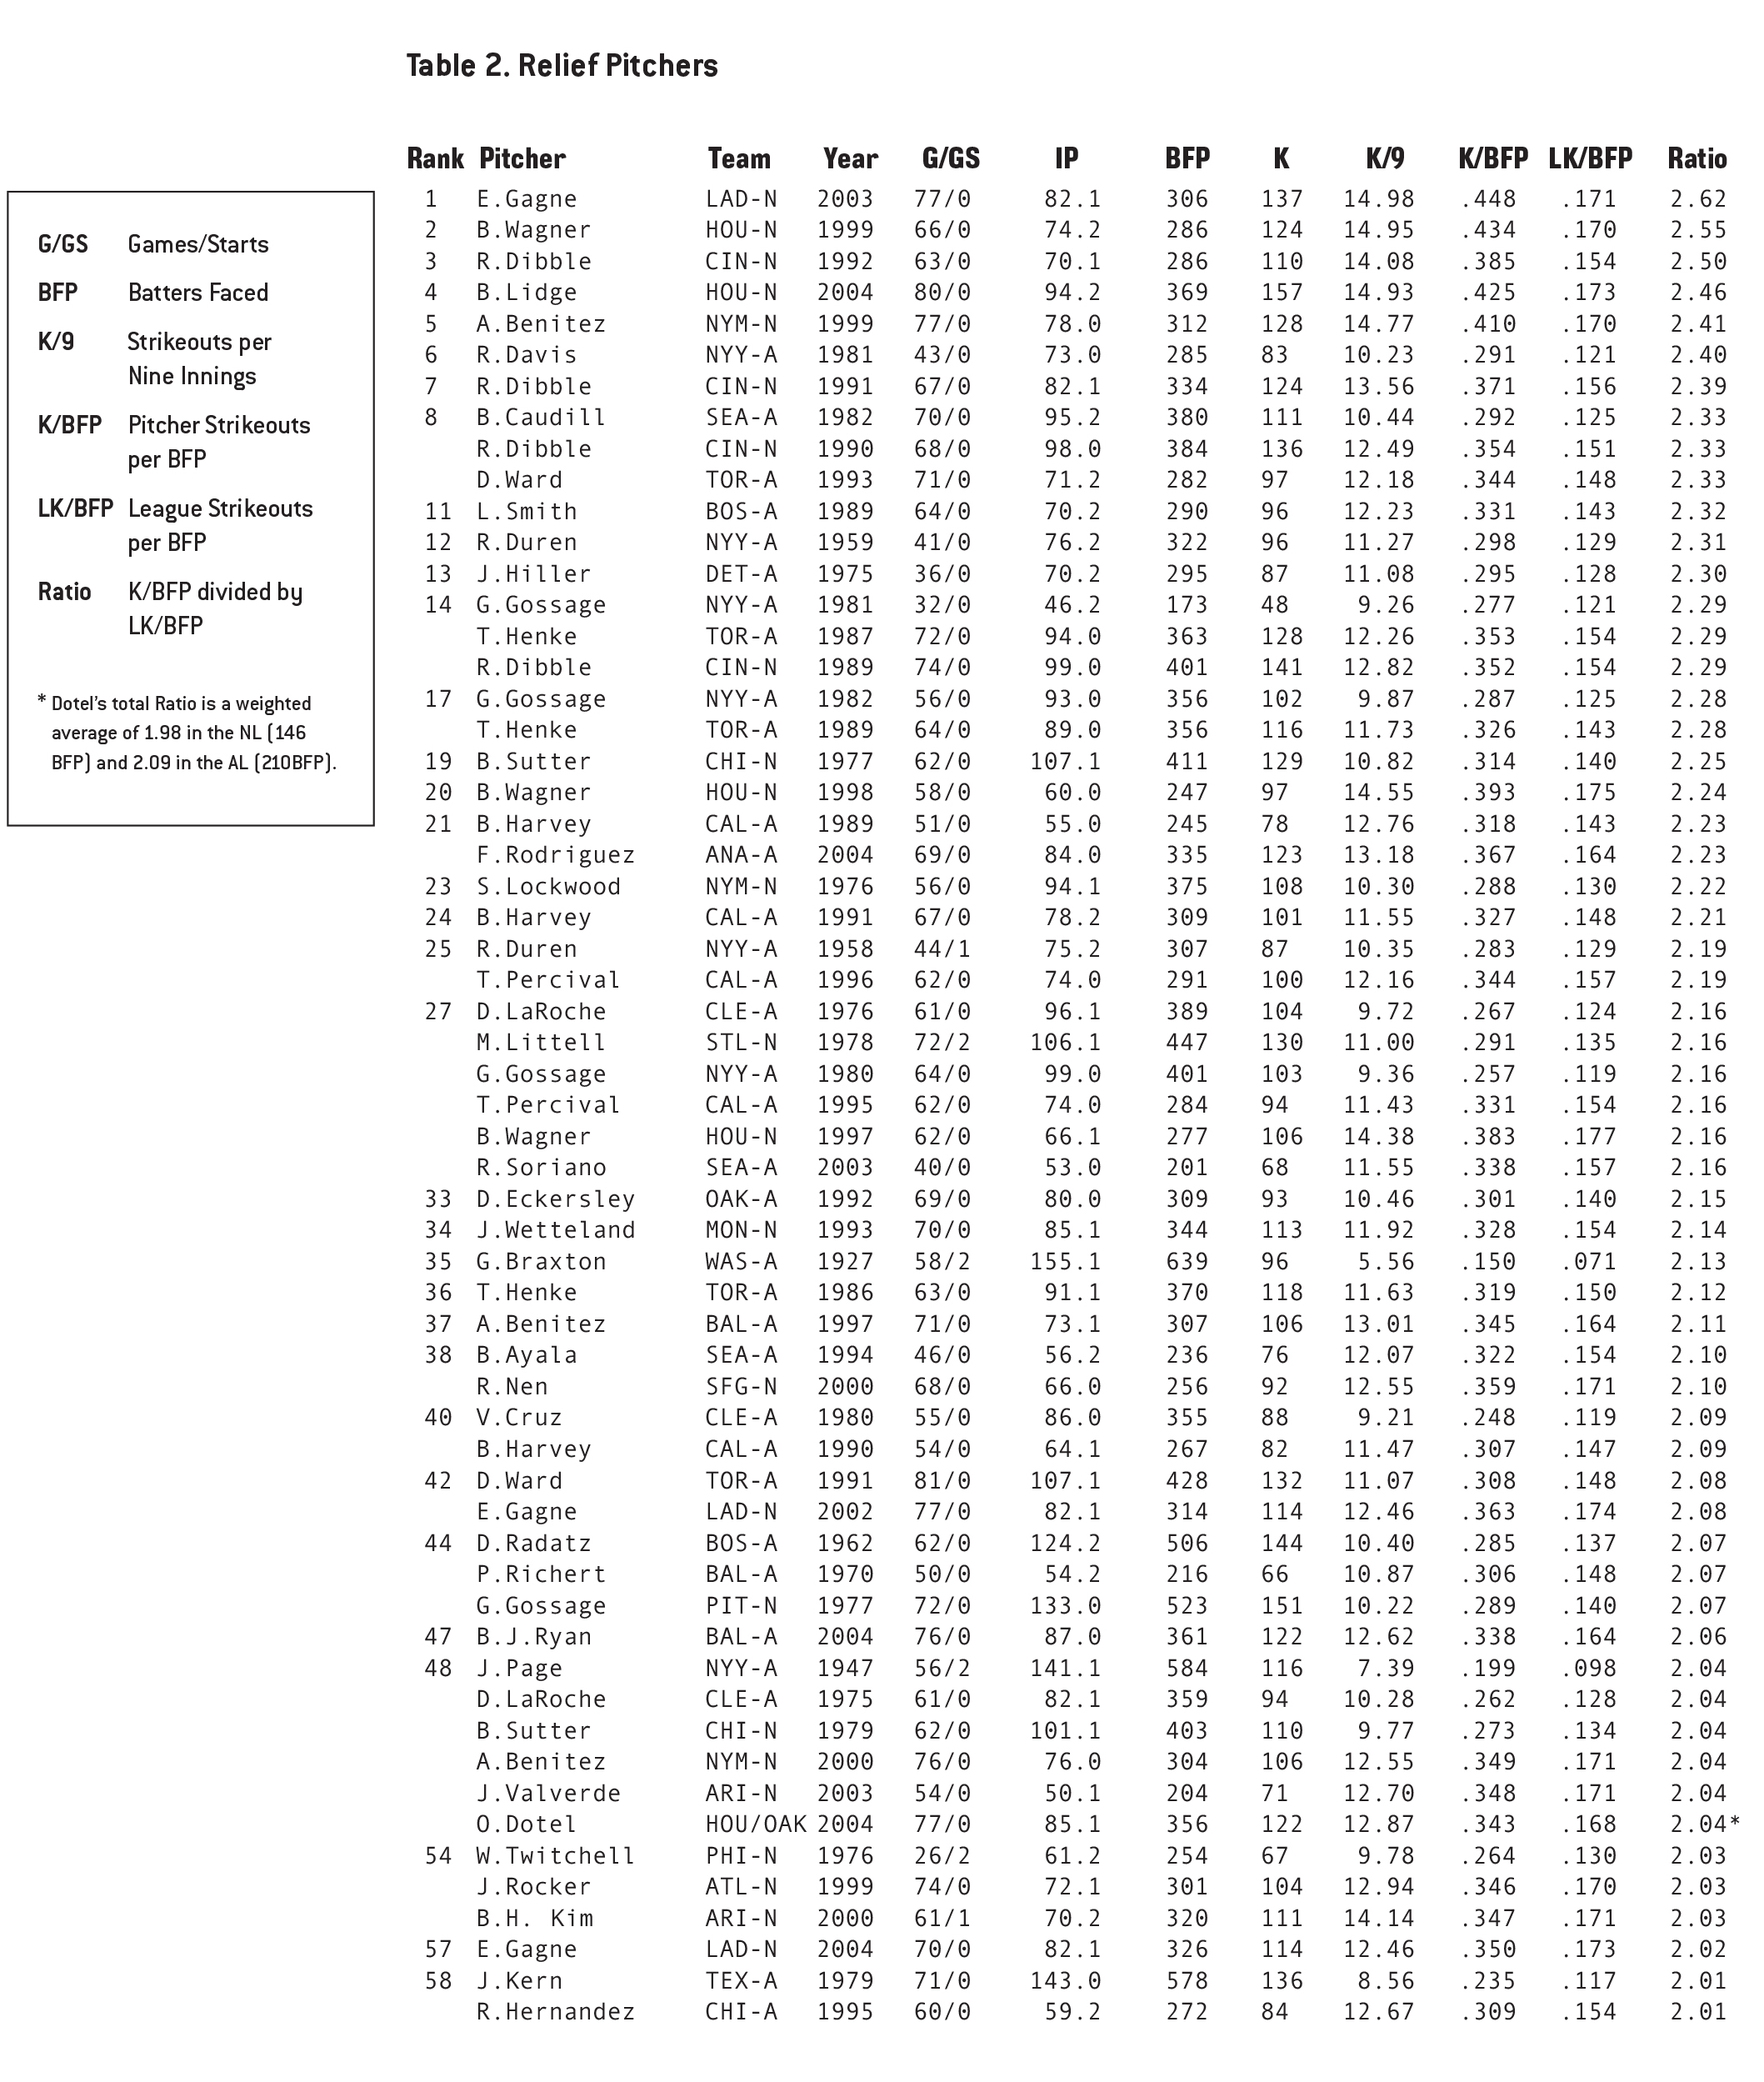
My friend whose comments about Pedro Martinez first got me interested in this project is a big Yankees fan and frequently reminisces about how awesome Goose Gossage was when he pitched for the Pinstripes back in the early 1980s. Those recollections of his made me curious about who really were the most dominant relief strikeout pitchers of all time. Table 2 lists all the seasons (59 of them) in which a relief pitcher’s strikeout/BFP rate was at least double that of the league strikeout/BFP rate (in order to qualify, the relief pitchers had to have pitched at least 50 innings in a season; the lone exception is Gossage’s 46.2 IP in the strike-shortened 1981 season).
The most dominant strikeout season ever by a reliever was that achieved by the Dodgers’ Eric Gagne in 2003. Not only did Gagne’s well-publicized 14.98 strikeouts per 9 innings break Billy Wagner’s record of 14.95 (set in 1999 with Houston), but Gagne also broke Wagner’s relievers’ record for best ratio of K/BFP vs. League K/BFP, 2.62 compared to 2.55. Although Gagne made the relievers’ list in 2002 and again in 2004 and Wagner also has two other seasons on the list (1997 and 1998), Rob Dibble’s four-year run from 1989 to 1992 with Cincinnati probably qualifies him as the most dominant strikeout pitcher among relievers. During that stretch Dibble attained the 3rd best season (ratio of 2.50), the 7th best (2.39), tied for the 8th best (2.33), and tied for the 14th best (2.29).
Gossage is the only other reliever besides Dibble to make the list four times (once with the Pirates and three times with the Yankees). But his peak ratio of 2.29 in 1981 gets him only as high as 14th place on the relievers’ list. In fact, his fellow Yankee bullpen ace that season, Ron Davis, struck batters out at a 2.40 clip compared to the league, the sixth most dominant season by a reliever in baseball history. Although current New York bullpen ace Mariano Rivera hasn’t yet had such a spectacular strikeout season, the Yankees franchise has a couple of other entries on the reliever list: Joe Page’s 1947 season (a ratio of 2.07) and Ryne Duren’s 1958 and 1959 seasons (2.19 and 2.31, the latter being the 12th best of all time).
A quick glance at the years on the two lists confirms what we already knew about the trend during the last few decades: the constantly increasing use of relief pitchers. Only five of the 59 seasons on the relievers’ list occurred prior to 1970, whereas the 60 seasons listed for starting pitchers are much more evenly spread out over the entire course of major league history. The other relief pitchers, besides Gagne, to make the list from the 2004 season were Brad Lidge (2.46, fourth best of all-time), Francisco Rodriguez (2.23), B.J. Ryan (2.06), and Octavio Dotel (2.04).
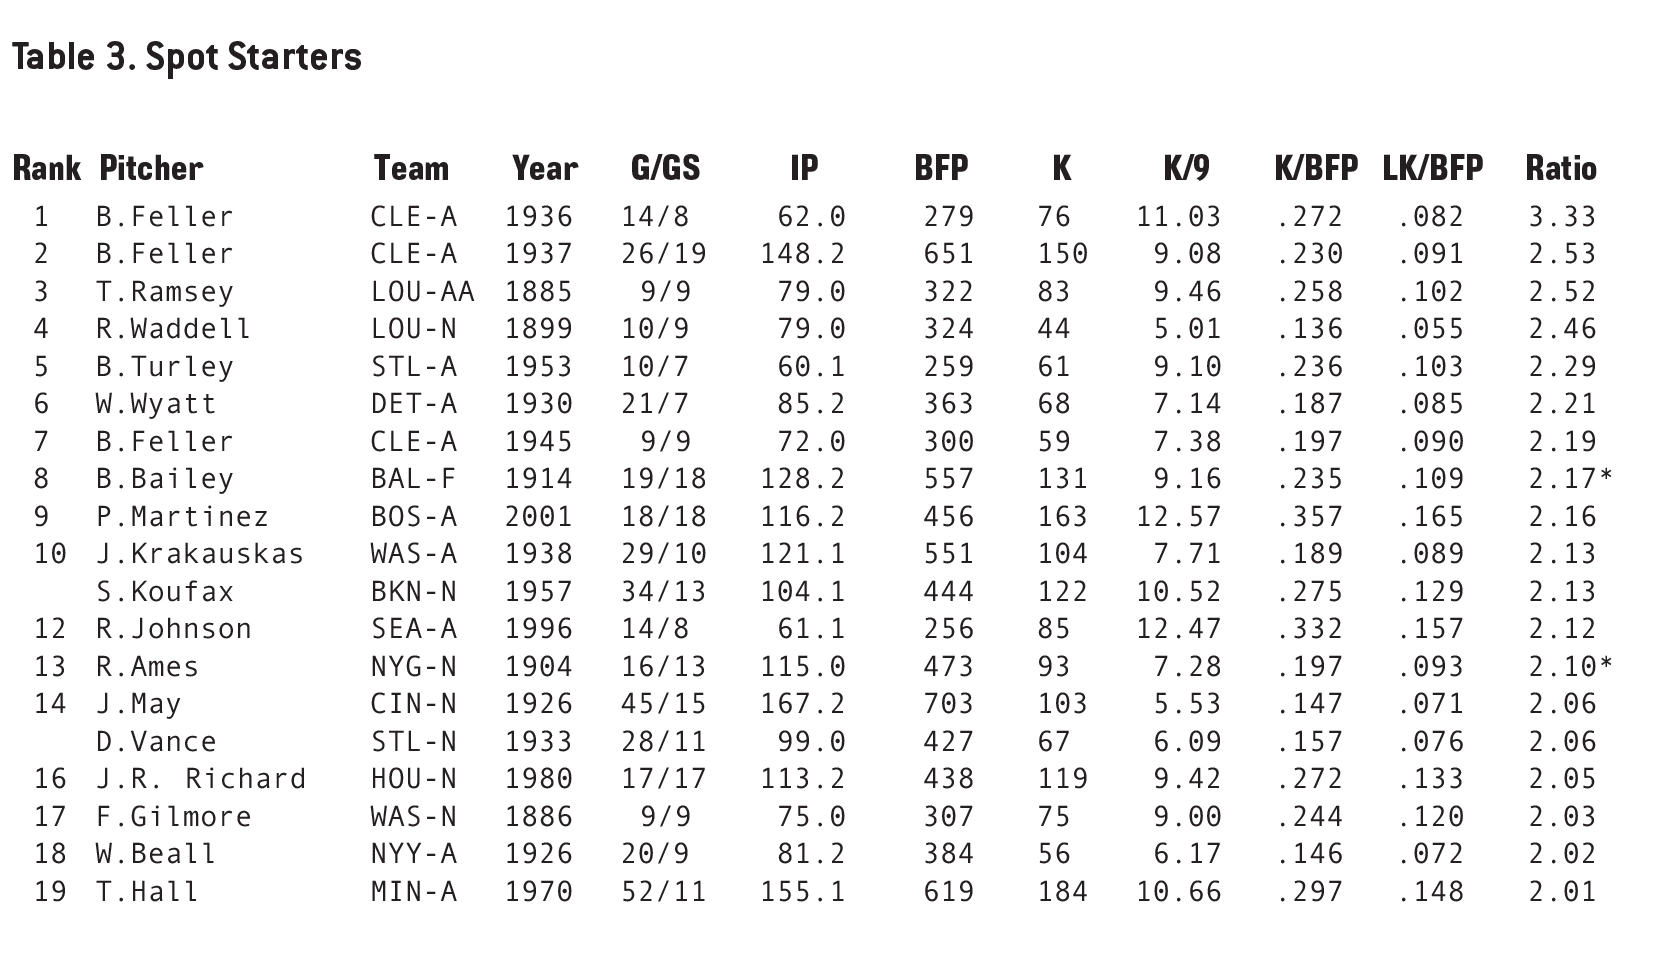
The final list (Table 3) is that of the pitchers who were caught in between the two categories—the spot starters. The 19 pitchers on this list pitched less than an inning per team game, but more than 50 innings and with at least 20% of their appearances in a starting pitcher’s role. At the top of the list is “Rapid Robert,” the Indians’ Bob Feller, who, as a 17- and 18-year old, set the AL aflame with incredible strikeout ratios of 3.33 and 2.53.
The familiar names of Dazzy Vance, Rube Waddell, Randy Johnson, and Pedro Martinez appear on this list, too. And, as usually happens when compiling statistics of this sort, completely unexpected results pop up: as hard as it is to believe, the totally obscure Washington Senators’ Joe Krakauskas had a season (1938) that was as dominant in strikeouts (ratio of 2.13) as the best Sandy Koufax could ever achieve (in 1957, when the Dodgers were still in Brooklyn).
The only pairs of teammates that appear on the three lists are: Lefty Grove and George Earnshaw of the 1928 Philadelphia Athletics (both starters), Dizzy Dean and Dazzy Vance of the 1933 St. Louis Cardinals (Dean was a 23-year-old starter, Vance a 42-year-old spot starter), the aforementioned relief duo of Gossage and Davis of the 1981 New York Yankees, and Randy Johnson (starter) and Byung-Hyun Kim (reliever) of the 2000 Arizona Diamondbacks.
As for the future, it wouldn’t be too surprising to see Eric Gagne’s relievers’ record broken (Houston’s Lidge came close last year), but a starting pitcher in these days of wildly high strikeout totals would have to punch out about 18 batters per game in order to match Dazzy Vance’s amazing 1924 season!
Sources
All of the data used for this article comes from the STATS All-Time Major League Handbook, the STATS All-Time Baseball Sourcebook, the annual STATS Major League Handbooks, and the ESPN or MLB websites. The league BFP totals do not appear in the Sourcebook, so they were estimated as follows: BFP = (3 x IP) + H + BB + HBP – GIDP.
Comparing this estimated value of league BFP with the actual value in the recent annual STATS Handbooks leads to agreement within about 0.1%, more than accurate enough for the calculations in this article. A few pitchers’ individual season BFP totals are not available in the All-Time Handbook, so those were estimated in a similar way, the key difference being that GIDP information is not available for individual pitchers. In those cases [marked with asterisks in the tables below], the GIDP totals were estimated by multiplying the pitcher’s IP times the GIDP rate of the league (league GIDP/league IP). Admittedly this is a rough estimate, but there are only eight occurrences on the lists above that fall into this data gap.
(Click images to enlarge)