

Batting Average by Count and Pitch Type
This article was written by Dean Stotz - J. Eric Bickel
This article was published in 2002 Baseball Research Journal
Many baseball coaches, sportswriters, and television announcers have commented on the fact that batting averages are low with two strikes or high with less than two strikes. For example, Thomas Boswell, in an article he wrote criticizing Ted Williams’ theory that you should take the first pitch, noted that “an analysis of nearly 100 of the top hitters in baseball suggests that the best [hitters] bat about 70 points higher and slug 130 points higher” on 0-0.1 From this Boswell claims that batters “should be swinging at a lot more first pitches,” that Ted Williams was a “dumbo” and that “most hitters are idiots.” Boswell defends his attack on Ted Williams by writing “Sorry, big guy. .. you made the call, so you’ve got to take the fall.”
Thomas Boswell is not alone. During both the 2000 and 2001 World Series, Tim McCarver, broadcasting for Fox Sports, used a graphic showing Major League hitters bat over 100 points lower with two strikes. Mr. McCarver was surprised by the poor performance of major league hitters in two-strike situations.
Andrew Torrez, in his book Off Base: New Insights into an Old Game, notes that the “average major leaguer hit .187 with two strikes, which is more reminiscent of the average pitcher.” Torrez goes on to argue that taking 1-1 makes sense for a “free-swinger” because if he would have swung at a pitch out of the zone, the count would have gone 1-2, “where he’s almost certain to be out.” Torrez suggests that this subtle insight separates good managers from mediocre ones.
Finally, USA Today noted, “All pitchers, virtually without exception, hold hitters to a lower batting average when the ball-strike count favors the pitcher. Batting averages tend to be about 140 points lower when the ball is put in play on a pitcher’s count, as compared to a hitter’s count.”3
We recently tested whether these same trends hold in college baseball by calculating the batting average(AVG) and slugging percentage (SLG) by count for Stanford Baseball (both Stanford and opponents batting) from 1998 through 2001.4 These results are illustrated in Figure 1.
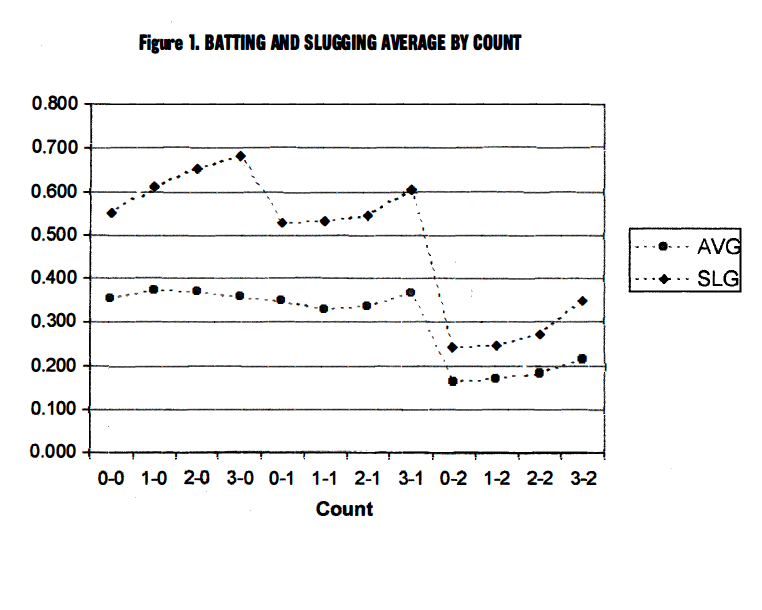
As you can see, both SLG and AVG are much lower with two strikes. For example, with less than two strikes, AVG and SLG are around .353 and .563, respectively. With two strikes, AVG and SLG drop to .183 and 276, respectively. In other words, batters hit 170 points lower and slugged 287 points lower with two strikes than they did with less than two strikes.
The overall AVG and SLG for our data set was .273 and.429, respectively. Therefore, batters hit 83 points higher and slugged 134 points higher on 0-0. That is amazing! Or, is it?
THE FALLACY
What is going on? Could it be that batters simply “lose it” with two strikes, as Boswell, McCarver, and Torrez conclude? Alternatively, could something else cause batting and slugging averages to be 170 and 287 points lower with two strikes?
The answer to this dilemma lies in the definition of batting average and the fact that it was not created to be used within a plate appearance. Batting average is the number of hits divided by the number of at-bats. There are four ways to have an at-bat with less than two strikes: hit, error, fielder’s choice, or batted out (the ball has to be put in play). However, there are five ways to have an at-bat with two strikes: hit, error, fielder’s choice, batted out, and strikeout (the ball is either put in play or the batter strikes out).
Given that it is impossible to strike out with less than two strikes, many more at-bats occur with two strikes. In fact, based on Stanford’s database, 47% of all ABs occur with two strikes. The remainder are more or less evenly split between the 0 and 1 strike counts. Dividing by the larger number of at-bats that occur with two strikes will produce lower AVG and SLG even for the exact same batting performance. Let’s look at an example (based on Stanford data) consisting of 1,000 pitches. Assume the 1,000 pitches break out as shown in Figure 2.
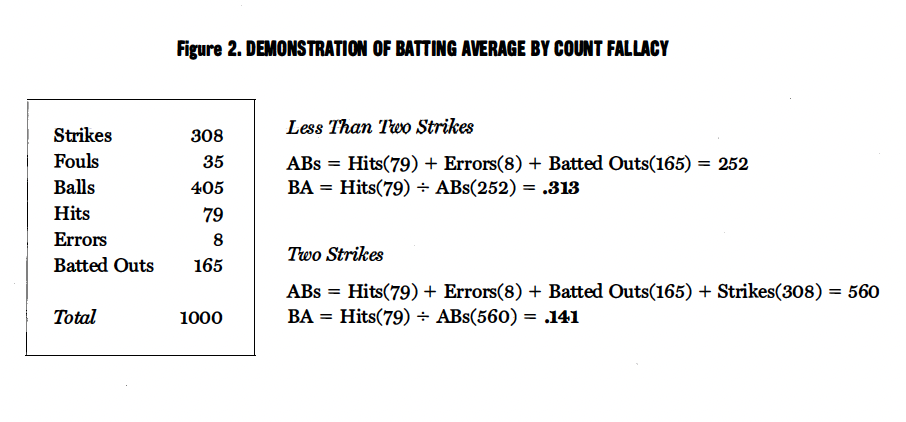
As shown above, if these 1,000 pitches were thrown with less than two strikes, they would have produced 252 at-bats and a batting average of .313 (79/252). Conversely, if these pitches were thrown with two strikes they would have produced 560 at-bats because the 308 strikes result in strikeouts! The corresponding batting average is only .141 — a difference of 172 points. A SLG example would produce similar results. In the interest of space, we will focus on AVG for the remainder of this paper. However, all our arguments apply with equal force to SLG.5
In both cases, batters got 79 hits out of 1,000 pitches or, more precisely, 79 hits out of 595 strikes (.132). Although batters are performing just as well with two strikes, their batting average is much lower. Therefore, it is a fallacy to conclude that batters perform poorly with two strikes simply because their batting average is low.
AVG in total is comprised of two-strike and non-two strike counts. Therefore, it is not at all surprising that AVGs are much higher with 0 or 1 strikes (e.g., 0-0) than they are in total. Therefore, you cannot conclude, as Boswell did, that batters “should be swinging at a lot more first pitches.”
THE REALITY
Given that batting average by count is misleading, how should we measure batters’ performance by count? How does the chance of getting a hit vary by count? By pitch type?
Performance by Count: To answer this question, we looked at every pitch thrown for a strike and measured how well batters handled those pitches.6 For example, based on Stanford’s database of over 76,000 pitches and 20,500 plate appearances, representing four seasons (1998-2001), batters took 49% of all 0-0 pitches thrown for a strike. They swung and missed 11%, fouled off 17%, put 15% in play for an out, and 8% in play for a hit. Figure 3 displays the number of hits per strike (HPS™) for every count.7
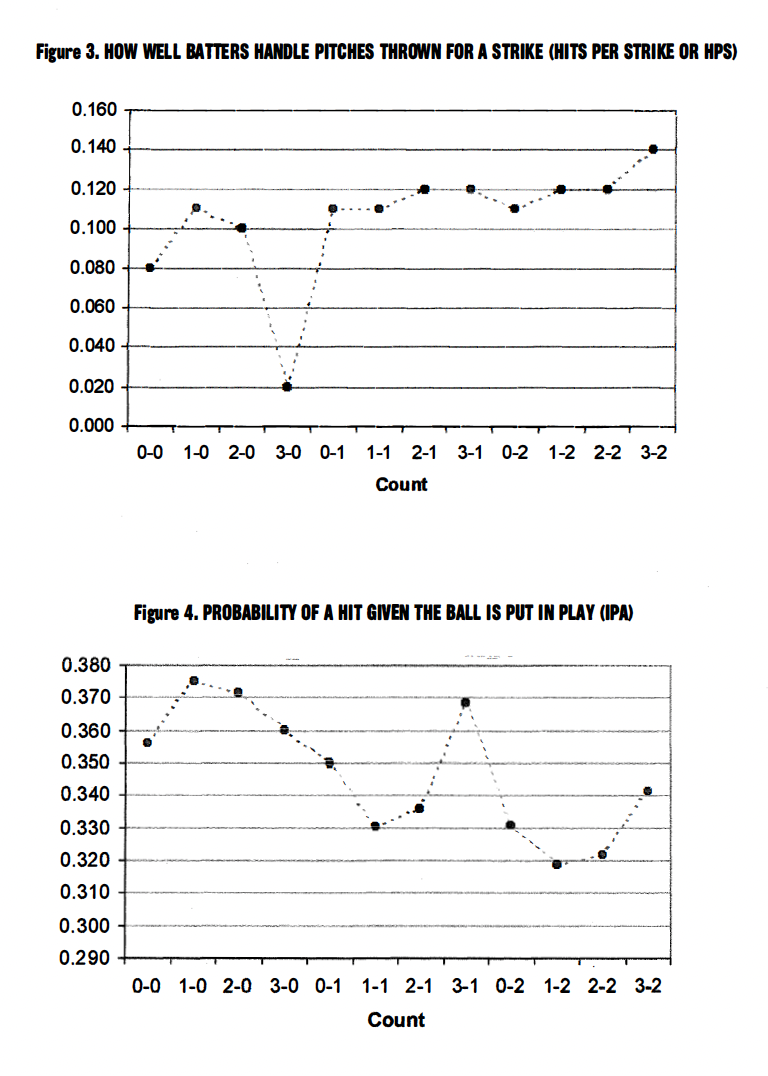
As you can see, the chance of getting a hit with two strikes is at least as high as every other count, except for 0-2. In fact, HPS for the two-strike counts is .123, while it is only .099 for the non-two strike counts.8 That is a difference of .024. Batters are more likely to get a hit (off a pitch thrown for strike) with two strikes than other counts. This is exactly the opposite relationship as suggested by AVG by count.
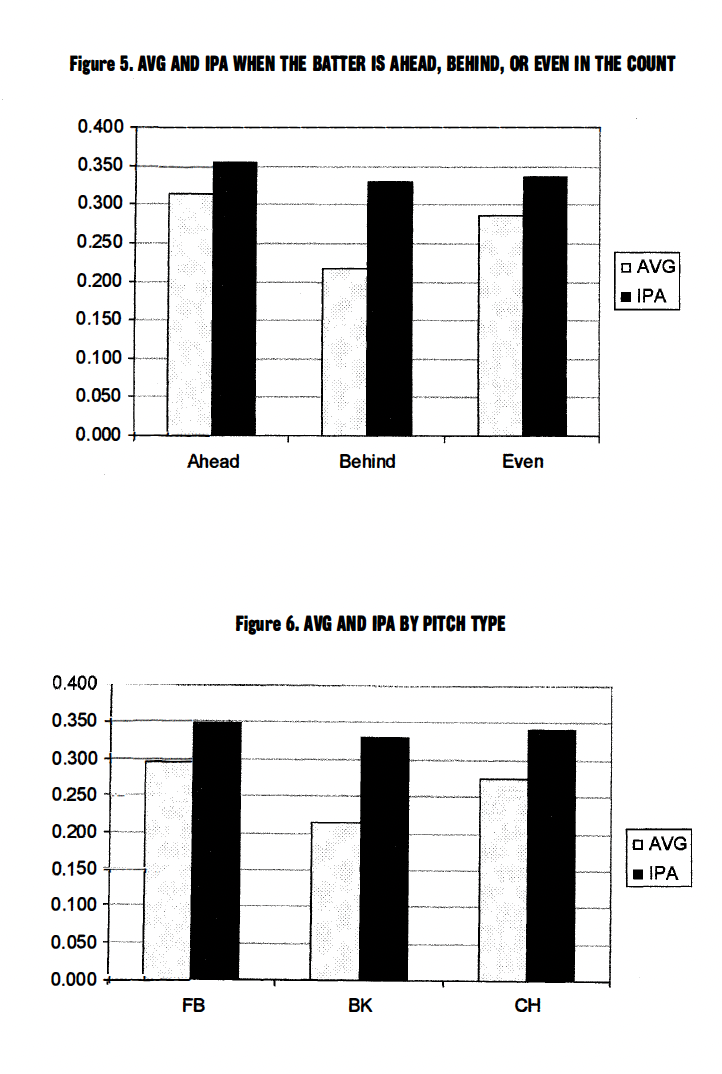
Given that batting average by count does not measure the chance the batter will get a hit, what does it tell us? Batting average by count with less than two strikes is simply the fraction of balls put in play that went for hits. Given enough data, we could think of this as the chance of getting a hit given the ball is put in play. Conversely, batting average with two strikes is the probability of a hit given the batter puts the ball in play or strikes out. Clearly, this will be lower than the chance of a hit if the ball is put in play, since no batter gets a hit when they strike out. Notice from Figure 1 that batting average with less than two strikes (or the probability of a hit if the ball is put In play) changes slightly by count for the non-two strike counts. Let’s call this the batters’ In Play AVG™ or IPA™ for short.9 We can calculate this statistic for two strikes by throwing out all the strikeouts and just looking at hits divided by balls put in play. We do this in Figure 4.
Batters have a .353 chance getting a hit if they put the ball in play with less than two strikes and a .326 chance if they put it in play with two strikes.10 This difference of .027 is a real effect. Batters are less likely to get a hit if they put the ball in play with two strikes. However, it is hardly the dramatic effect suggested by AVG.11
We should also highlight a point that should be clear by now. Batting average that is calculated based on whether the batter is ahead, behind, or even in the count will also be misleading. For example, the batter is behind in the count on 0-1, 0-2, and 1-2. Therefore, his batting average when behind will be low because it will be dominated by 0-2 and 1-2. To see this we refer back to Figure 1. Based on our Stanford data set, batters hit .313 when ahead (1-0, 2-0, 3-0, 2-1, 3-1, 3-2) in the count, .285 when even (0-0, 1-1, 2-2), and .218 when behind (0-1, 0-2, 1-2). Is this surprising? We hope not, since this is just another form of the batting average by count fallacy. Figure 5 presents batters’ AVG and IPA when they are ahead, behind, and even in count.
As you can see, hitting performance is not as poor when behind in the count as AVG suggests.
How about the chance of getting a hit if batters are thrown a strike when they are ahead, behind, or even in the count? Batters’ HPS was .113, .114, and .094. Batters are just as likely to get a hit off a pitch thrown for a strike when they are ahead in the count as when they are behind! AVG by count has misled us, again.
Performance by Pitch Type: Breaking down batting average by pitch type is also misleading because fewer fastballs and more off-speed pitches are thrown with two strikes. Therefore, batters will have a higher batting average off fastballs than off-speed pitches — even if they are just as likely to get a hit off of either pitch type. For example, based on our Stanford data set, pitchers throw 66% fastballs with less than two strikes and 56% fastballs with two strikes. In Figure 6 we present batters’ AVG and IPA by pitch type.
Notice the large decrease in AVG for BK, as we suspected. The difference between IPAs is much lower. There is a slight decrease for BK, which we would expect-batters should be less likely to get a hit off a BK put in play than a FB. However, the large difference in AVG between pitch types is primarily related to the problem of looking at batting average by count.
In addition, batters’ HPS for FB, BK, and CHs were .110, .087, and .106, respectively. In other words, batters were just as likely to get a hit off a CH thrown for a strike as a FB. The chance of getting a hit off a BK thrown for a strike is a bit lower.
CONCLUSION
Batting average and slugging percentage by count are highly misleading, because they imply that batters perform poorly with two strikes or incredibly well with less than two strikes. The low (high) AVG and SLG numbers with two strikes (less than two strikes) are simply defects of these statistics. This problem even affects AVG and SLG by pitch type.
Unfortunately, these defects are not widely appreciated and many within baseball have been misled. Thomas Boswell has even gone so far as to call the game’s greatest hitter a “dumbo” based on this misunderstanding. We are afraid there is only one dumbo here and it is not Ted Williams.
The defects of AVG and SLG by count are corrected by looking at batters’ HPS and IPA statistics. HPS demonstrates that batters are more likely to get a hit off a strike with two strikes than other counts. IPA highlights that batters are less likely to get a hit if they put the ball in play with two strikes or off a BK. However, this effect is much smaller than what is implied by batting average.
ERIC BICKEL earned his doctorate in decision analysis from Stanford University, where he met Dean Stotz. Eric’s primary interest is improving decision making in complex, uncertain environments. DEAN STOTZ is the associate head baseball coach at Stanford University, where he has been for 26 years. Eric and Dean founded Competitive Edge Decision Systems, which provides electronic pitch/hit charting and data mining software to amateur and professional baseball and softball teams.
NOTES
1. Thomas Boswell, “And the First Shall Be Best — The numbers Prove Ted Williams Wrong: You Should Swing at the First Pitch,” Inside Sports, August 15, 1993: 58-65.
2. Andrew Torrez, Off Base: New Insights into an Old Game. Emeryville, CA: Woodford Publishing, 1999.
3. Matt Olkin, “Keep Running Until They Tag You,” USA Today.com, March 28, 2001.
4. We do not claim that AVG and SLG are the best way to measure hitting performance.
5. One real effect that shows up in SLG by count is the fact that batters average more bases per hit with fewer strikes and more balls — to see this simply divide SLG by AVG, which yields bases per hit (BPH™). BPH is a trademark of Competitive Edge Decision Systems.
6. We performed this analysis using Competitive Edge Decision Systems’ ChartMine™ software system and their HandleIT™ statistic. Stanford has used ChartMine since 1998. See www.edgedec.com for more detail.
7. HPS is a trademark of Competitive Edge Decision Systems.
8. Weighted average based on the number of strikes thrown on each count.
9. In Play AVG and IPA are trademarks of Competitive Edge Decision Systems.
10. Weighted average based on the number of balls put in play on each count.
11. Thanks to an anonymous referee of this paper, we understand that this trend holds in MLB as well.