

Better Yardstick: Rating Results vs. Total Plate Appearances
This article was written by Neil Munro
This article was published in 1984 Baseball Research Journal
ONE CATEGORY of batters’ statistics that is most useful for the analysis of offensive production and yet is rarely listed in the baseball guides or encyclopedias is total plate appearances. Six separate elements make up plate appearances – official times at-bat, bases on balls, sacrifice hits, sacrifice flies, hit by pitch, and awarded first base on defensive interference or obstruction.
Some difficulty arises in tabulating career records of total plate appearances for many players because the category of interference is largely unrecorded for most seasons. Since 1913 a batter has been exempted from an official at-bat if the catcher interfered with him while he was attempting to swing at a pitch. However, data on such instances are scarce prior to 1959, and the recorded occurrences are complete for both major leagues only since 1963. Situations involving interference represent by far the smallest figures among the six categories, and in the great majority of cases, the plate-appearance leaders for the season were awarded no interference calls. All statistics in the accompanying tables omit this category for the years prior to 1959.
The records for hit by pitch also are incomplete to some extent, but all statistics in this category are known for both leagues since 1909. All players listed in the career leaders table include complete hit-by-pitch data except for Honus Wagner. His plate-appearance totals include hit by pitch only for the last nine years (1909-1917) of his career.
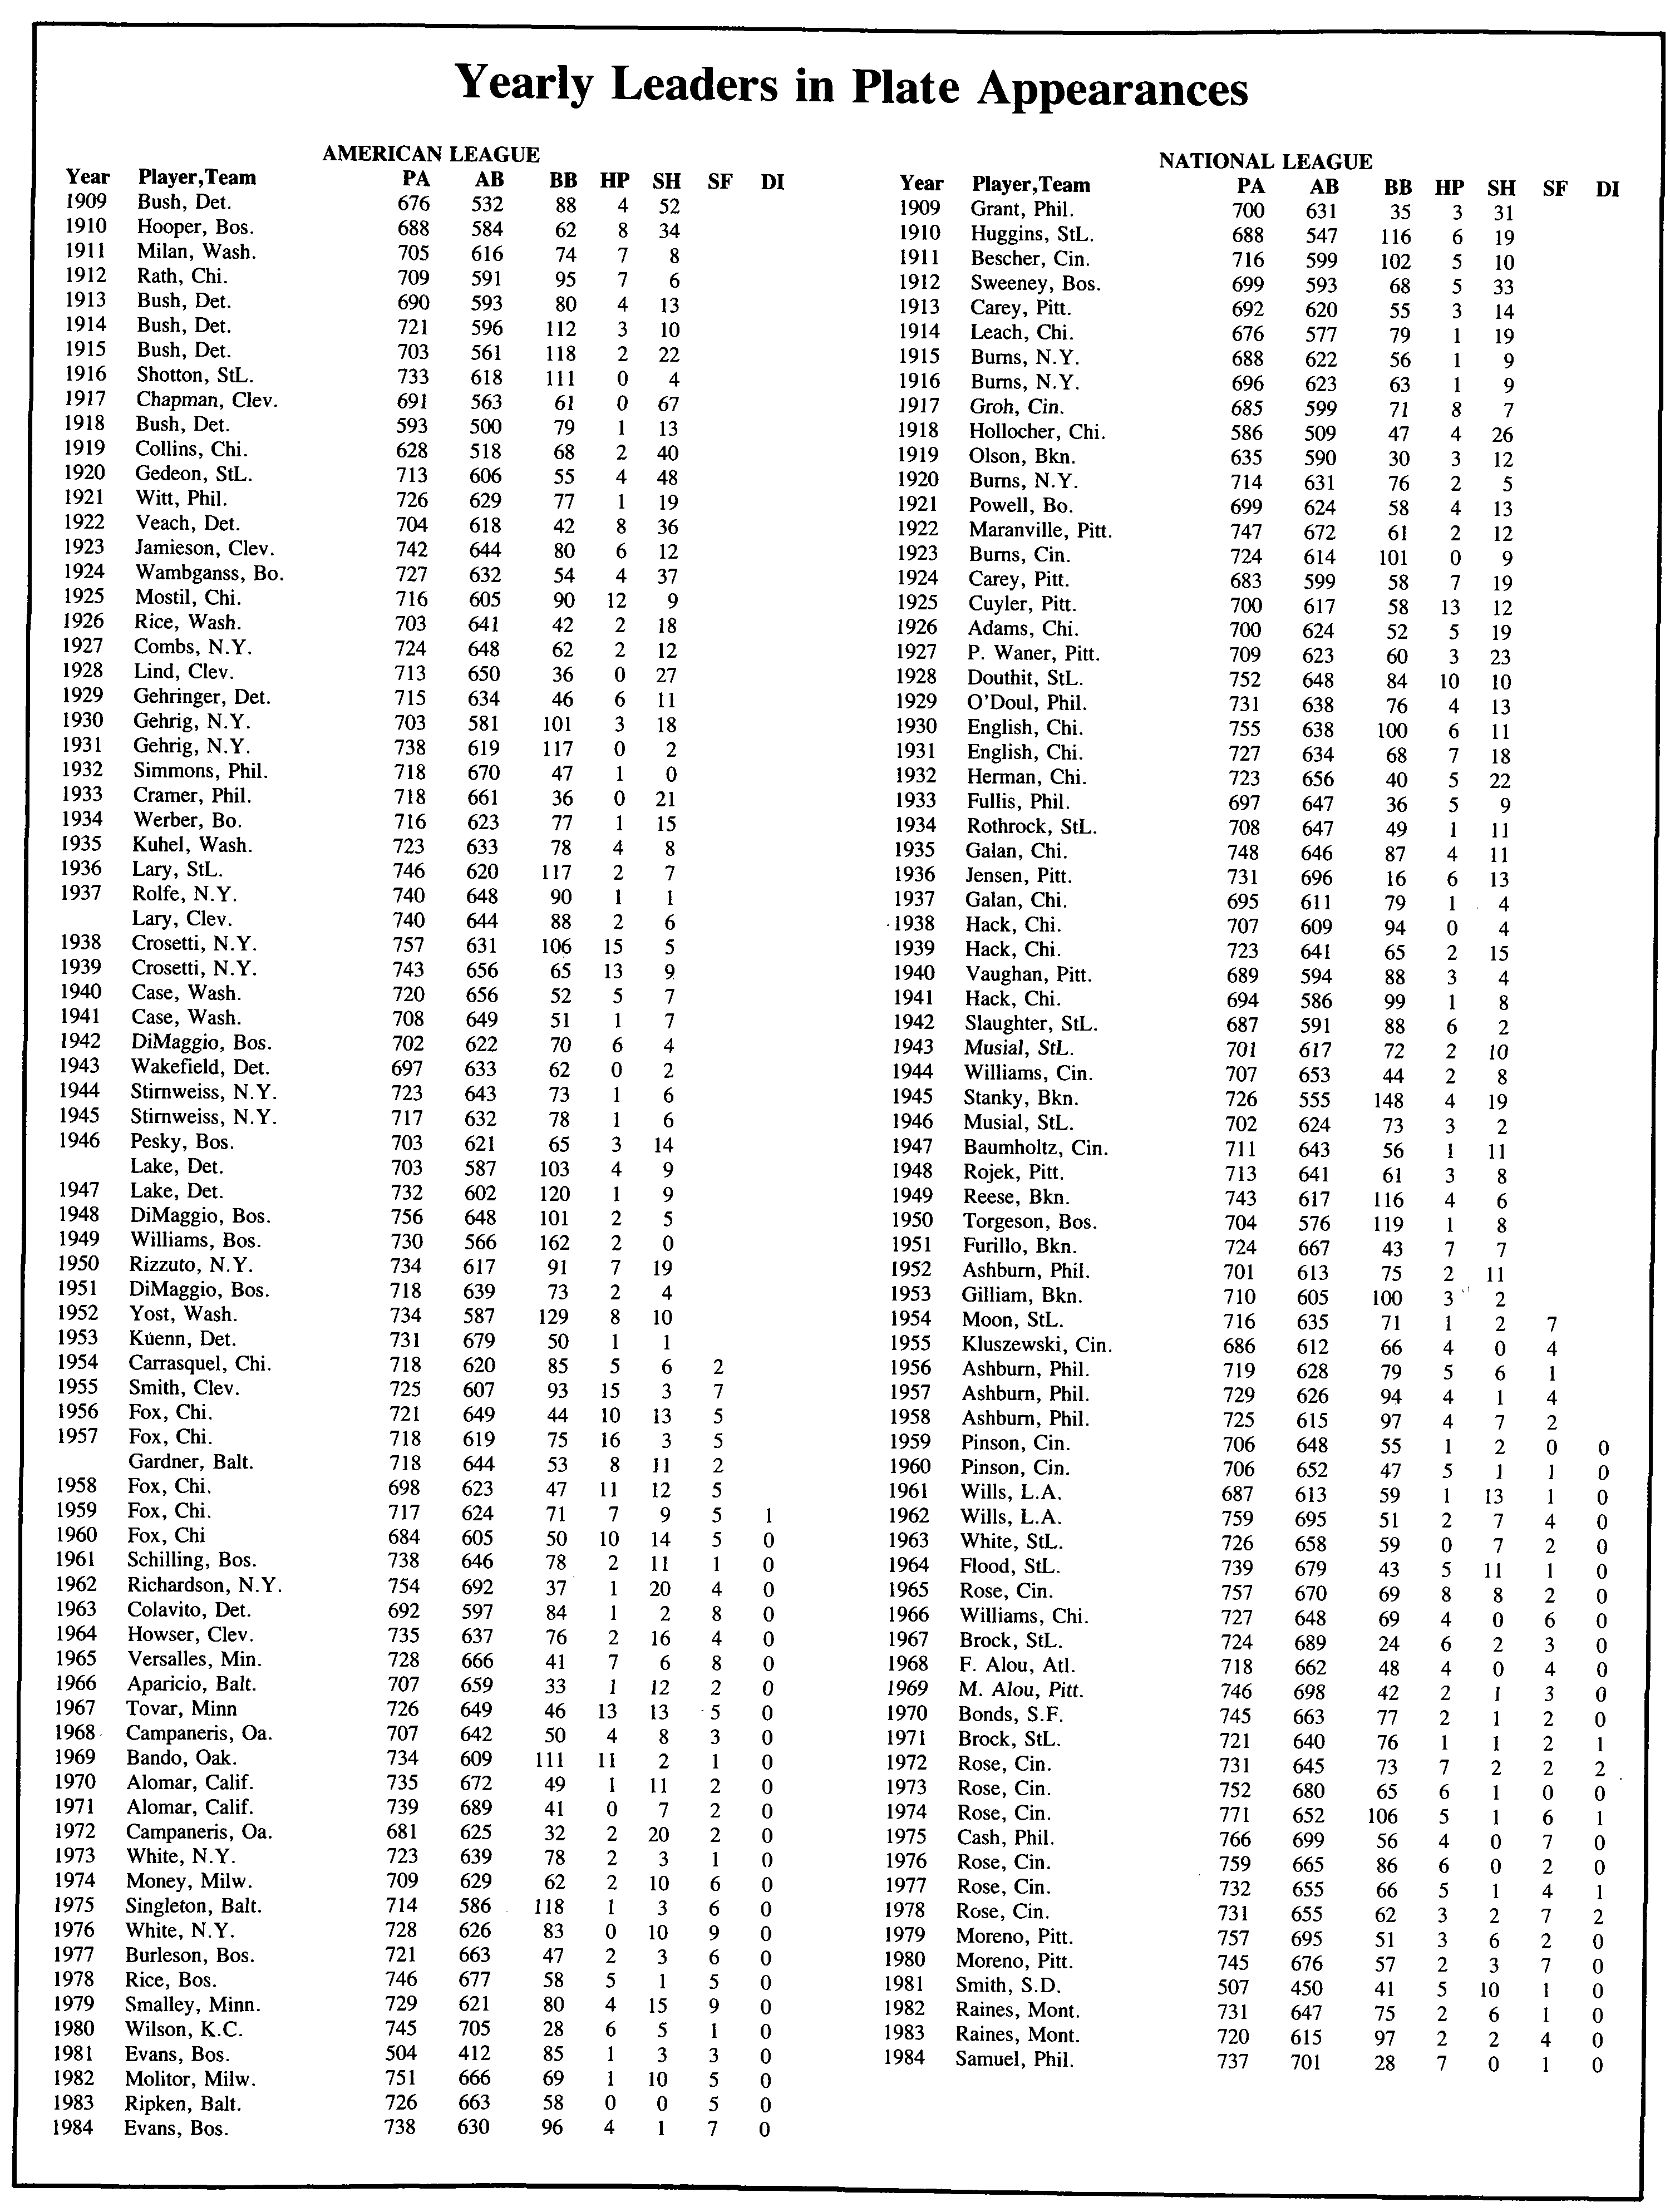
The yearly leaders in appearances in the accompanying tables are shown only for the seasons from 1909 to date. The prior years are omitted because the frequency of batters being hit by a pitch was quite high during the early part of this century and even greater for the pre-1900 period. A listing of yearly leaders for any season prior to 1909 would certainly omit some appearances because it was extremely rare for a player to go through the entire season without being hit by a pitch.
Of greater concern is the fact that for many years the correct plate-appearance leader cannot be identified because of the absence of certain data. Pete Palmer is currently heading a SABR effort to complete the hit-by-pitch statistics from newspaper accounts of games for the period, and the complete listing of season leaders may be available at some future date.
Although the rules concerning sacrifices have changed several times over the last 90 years, the ability to determine the number of plate appearances for batters has not been affected, and the season and career records for those playing since 1894 can be determined. The major changes in the sacrifice rules have concerned whether sacrifice flies have been (a) counted with sacrifice bunts under the category of sacrifice hits, (b) tabulated as a separate category, or (c) simply included as official times at-bat. The important fact is that they have been recorded in some categories that can be accounted for.
The factors most affecting a player’s number of plate appearances in a season are much the same as those which determine the number of at-bats that a player obtains. While the leaders in plate appearances often are the same players who lead in at-bats, there are a number of significant exceptions. Players enjoying a high frequency of bases on balls and, to a lesser extent, those who often are hit by a pitch or are frequently called upon to sacrifice can set the pace in plate appearances without being near the top in official times at-bat. Eddie Stanky and Eddie Yost are examples of players who led in appearances but never registered as many as 600 at-bats in a season.
The league leaders in plate appearances will generally have the following characteristics and roughly in this order of importance:
1-They will play in all or nearly all of their team’s games that season.
2-They will bat at or near the top of the batting order.
3-They will not be taken out of games for offensive or defensive replacements.
4-They will play for a team with above-average offensive production.
5-They will play for a team with below-average pitching.
While most season leaders in plate appearances batted first or second in the lineup, Ted Williams, Lou Gehrig, and Ted Kluszewski among others led their league while hitting in the heart of the batting order. Excluding the shortened 1918, 1919, and 1981 seasons, the player who topped his league while participating in the fewest number of games was Dom DiMaggio, who played in only 146 of the Red Sox’ contests in 1951. The plate-appearance leader appearing in the most games was Maury Wills with 165 for the 1962 Dodgers. He also had one of the highest totals of plate appearances with 759.
The record for most plate appearances in a season belongs to Pete Rose, who went to bat 771 times in 1974. The following year Dave Cash with 766 and Rose with 764 had the second and third largest number of appearances in a season. The American League season leader is Frankie Crosetti, who accumulated 757 appearances for the Yankees in 1938 while playing in a 154-game schedule.
Pete Rose topped the National League a record seven times, while Nellie Fox led or tied for the lead in the American League on six occasions.
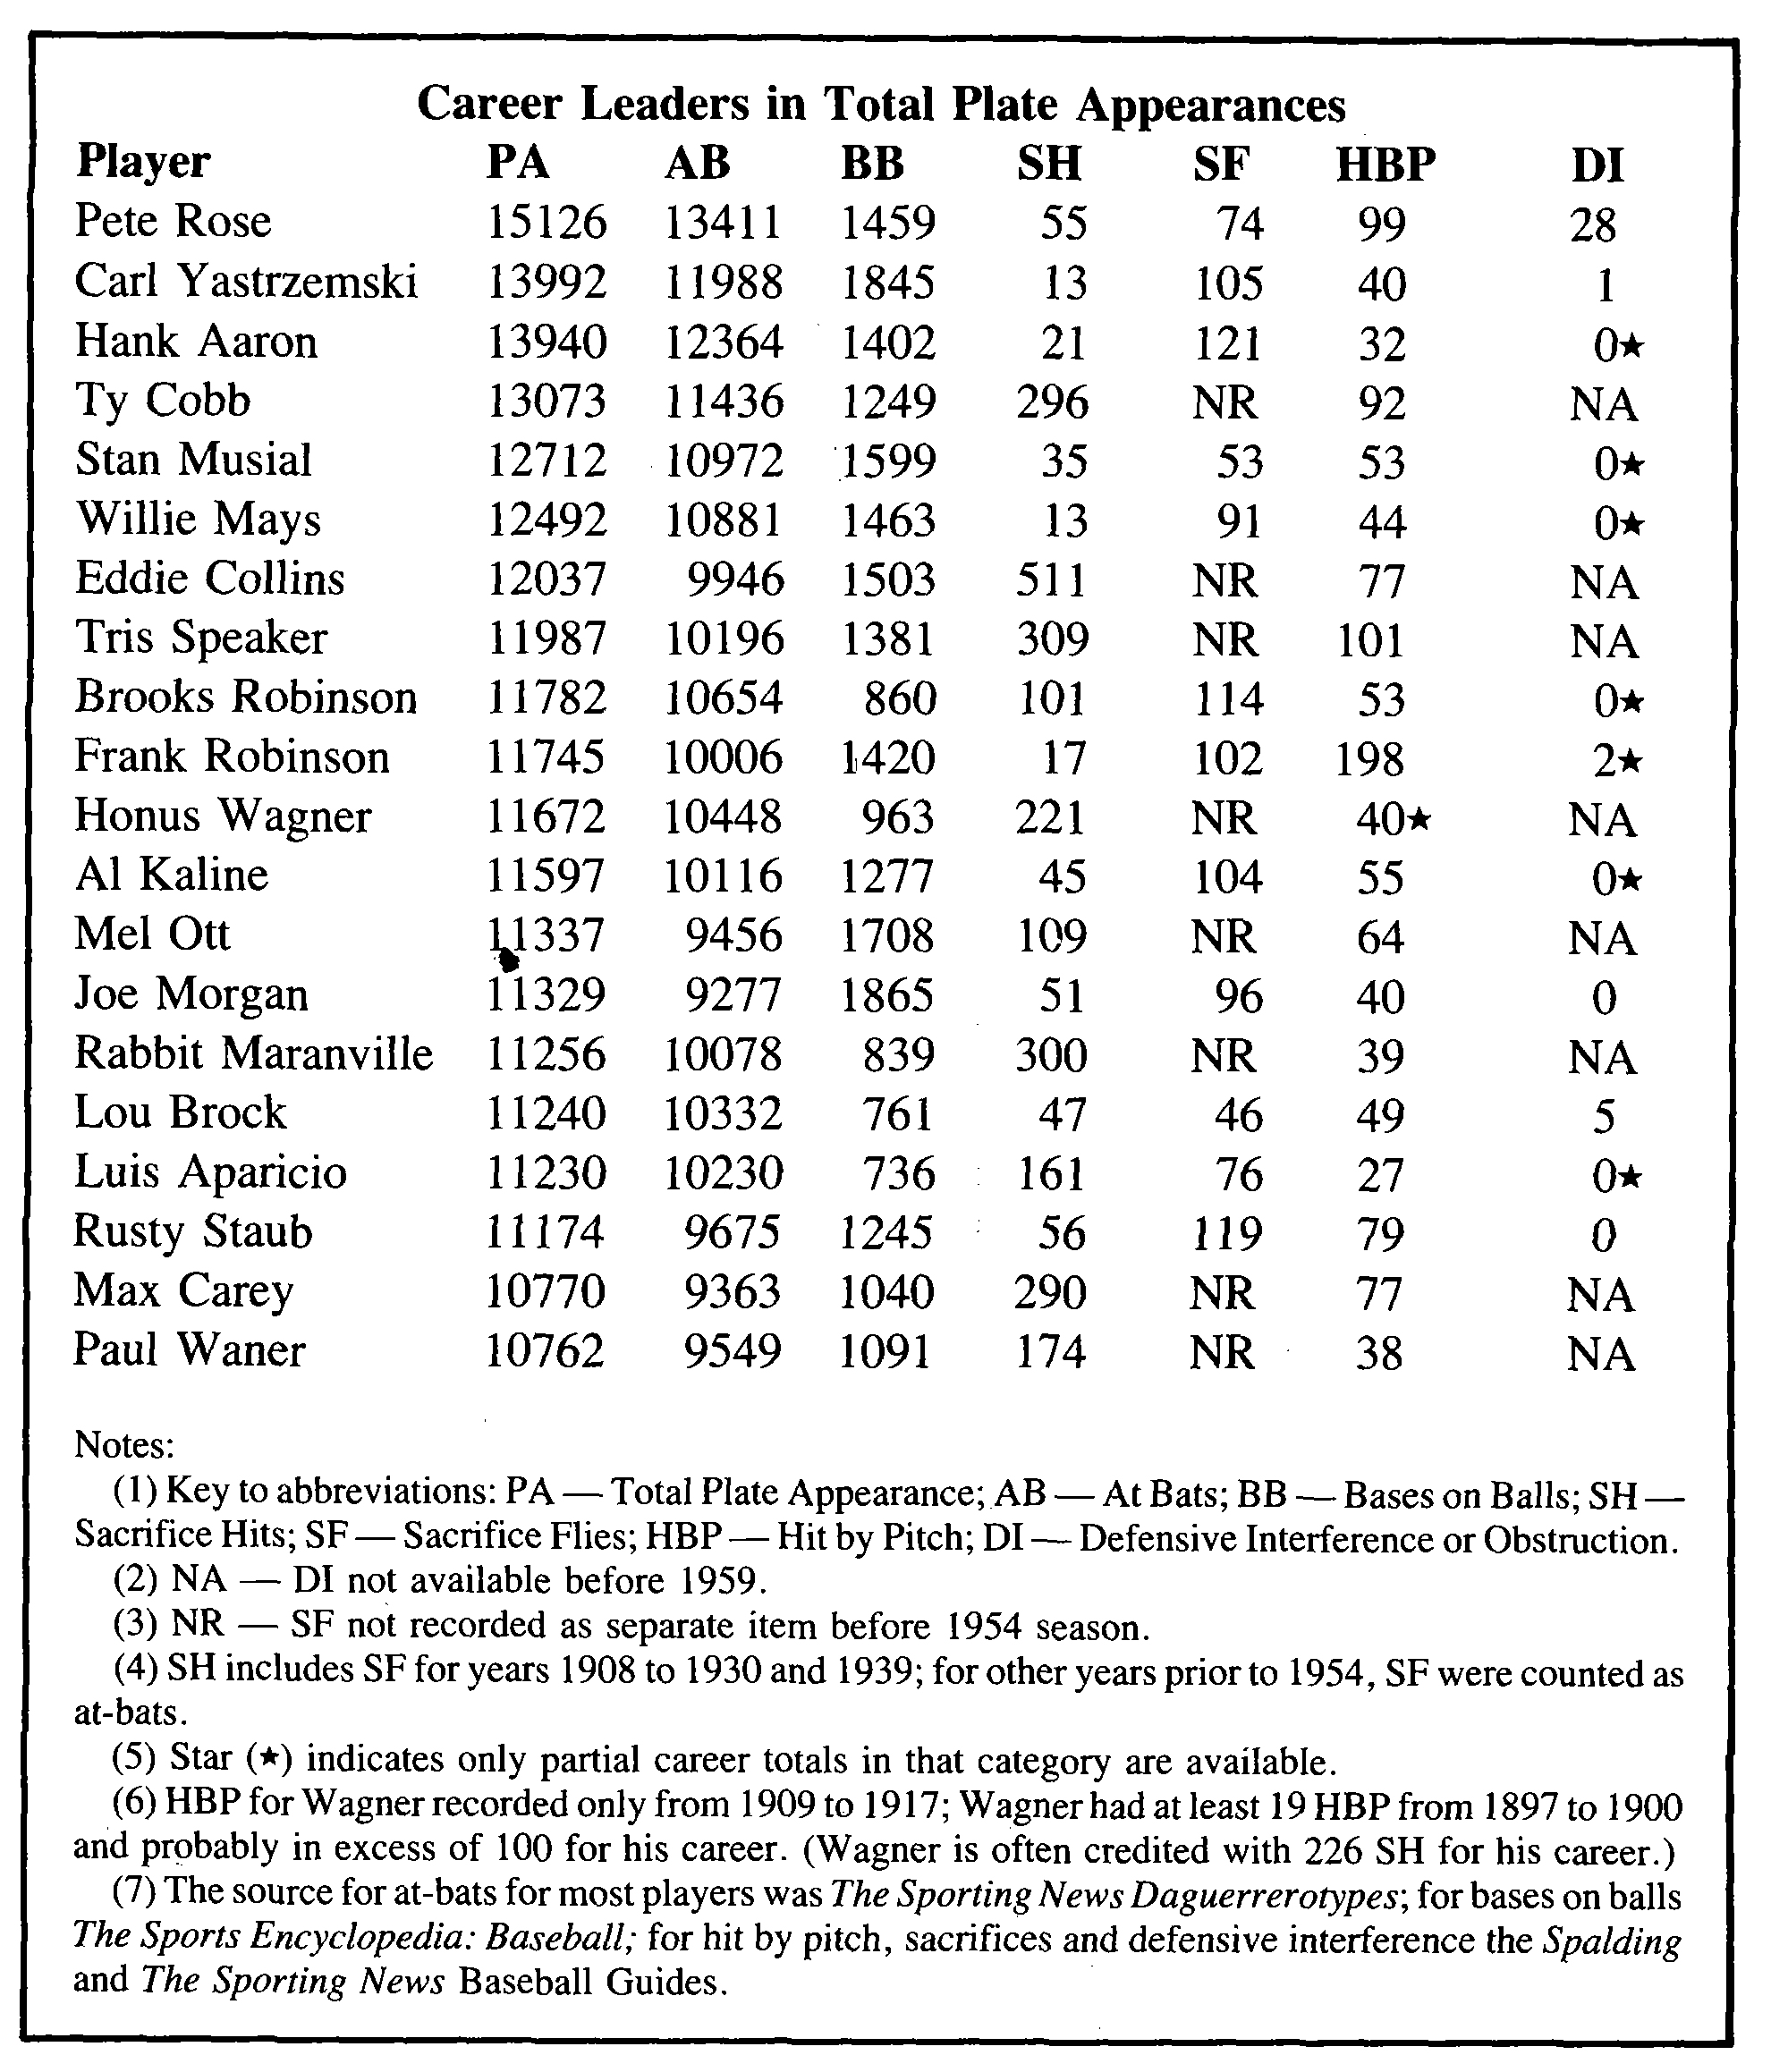
Rose also is the career leader in plate appearances with 15,126 through the 1984 season. This is well over 1,000 ahead of runner-up Carl Yastrzemski. In all, some 39 players had accumulated more than 10,000 career plate appearances by the close of the `84 season.
(Click image to enlarge)
It would seem appropriate to use plate appearances – rather than at-bats – in determining the frequency of occurrence in many other areas of batting statistics. For example, virtually all sources base the home-run-percentage leaders on the number of homers per at-bat rather than per plate appearance. The use of the latter would provide a better picture of the probability that a home run would be hit by the player.
Following are breakdowns of the career frequency home-run leaders (based on 5,000 at-bats or 6,000 plate appearances) using both methods:
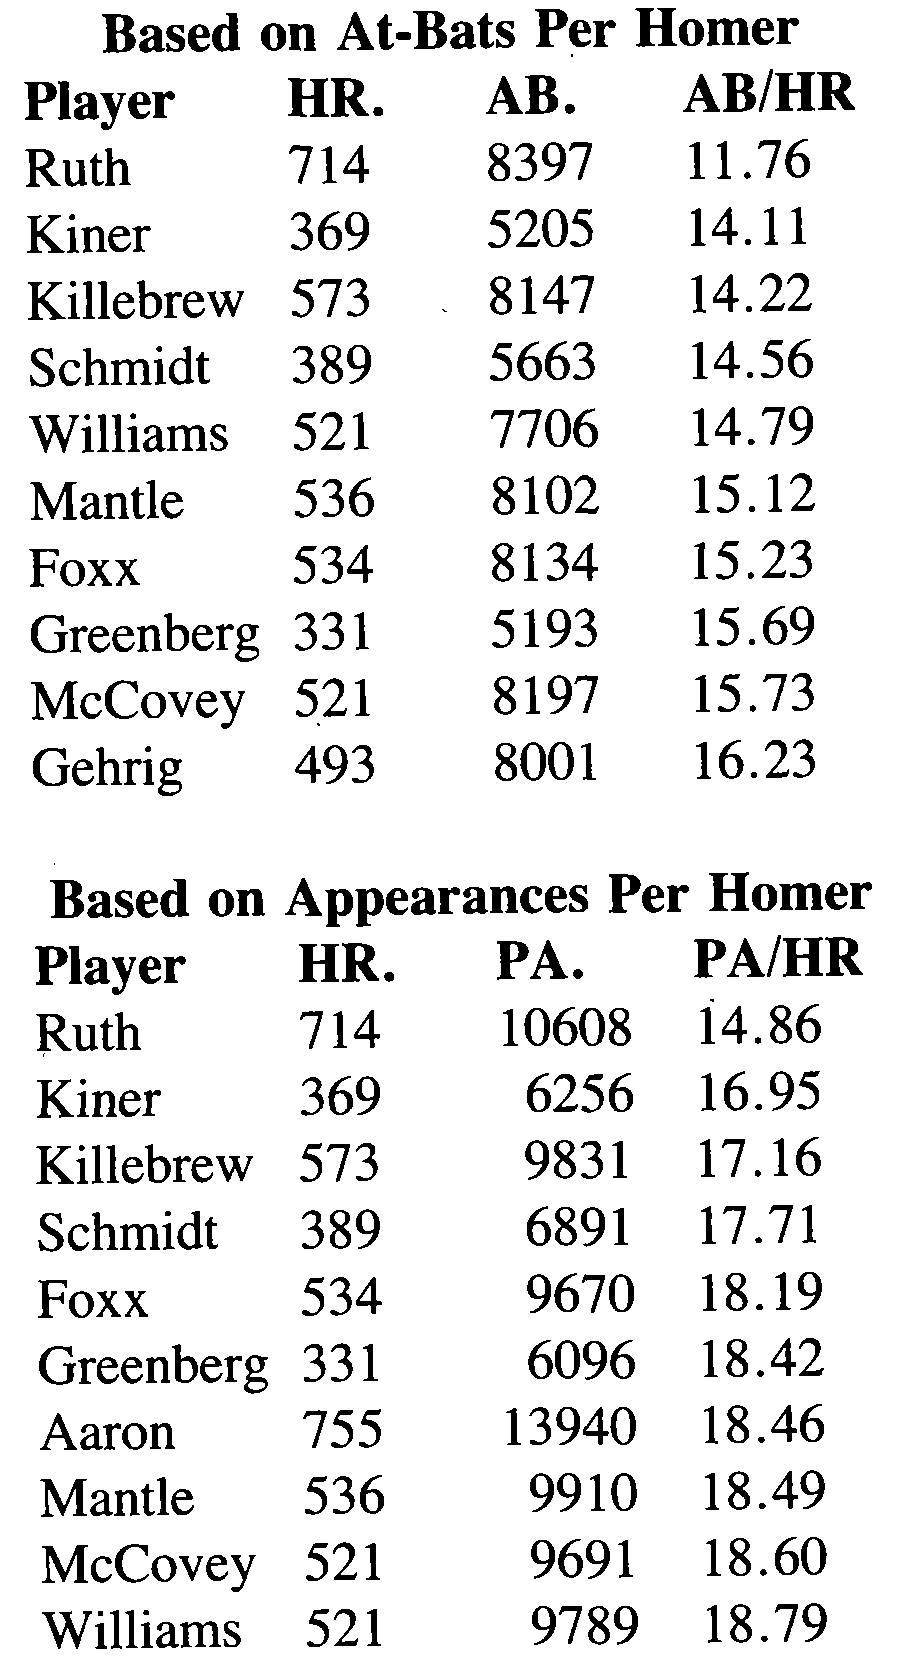
Ruth, of course, leads all players in frequency of home runs no matter which method is employed, but there is considerable rearrangement among the others in the top ten. Surely it is more meaningful to state the Babe hit a home run once every 14.86 trips to the plate rather than saying he hit one every 11.76 at-bats.
Players also are sometimes rated for fewest at-bats per RBI, but again a better picture of RBI productivity is given in terms of fewest plate appearances per run batted in. This is especially true because sacrifice flies always will produce an RBI and bases on balls occasionally will do so, too. The all-time leader in fewest plate appearances per RBI is Hank Greenberg, who averaged 4.78 PA per RBI over his career. Greenberg rates third on the career at-bats per RBI chart.
(Click image to enlarge)