

Coming from Behind: Patterns of Scoring and Their Relation to Winning
This article was written by David W. Smith
This article was published in Fall 2009 Baseball Research Journal
At the annual SABR convention in 2003, in Denver, I presented my analysis of game scores in relation to overall team success.1 The inspiration for that study was the common assertion that the ability to win close games is an indication of “clutch” performance and that better teams will stand out in these games over the course of a season. In fact, I found that success in close games is not an especially good predictor of the best teams and that the ability to win games by a large margin is much more closely related to overall winning percentage.
That study in 2003 was based entirely on the final score of each game. This leaves open some large questions relating to the pattern of scoring within a game. Some questions that were suggested then were
- How important is it to get an early lead?
- Do good teams come from behind more often?
- Do wins in the last at-bat indicate a strong team?
I have now examined these more subtle features by using line-score data. The information came from several sources: Retrosheet and STATS, Inc., provided the greatest portion, while Mike Grahek, John Agius, Ed Hartig, and Luke Kraemer generously pitched in as well. I am very grateful for this help. Much of this information is already on the Retrosheet website. (See table 1.)
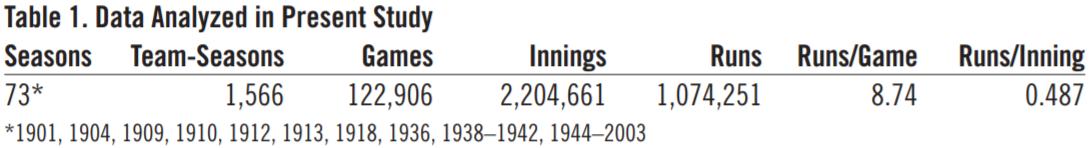
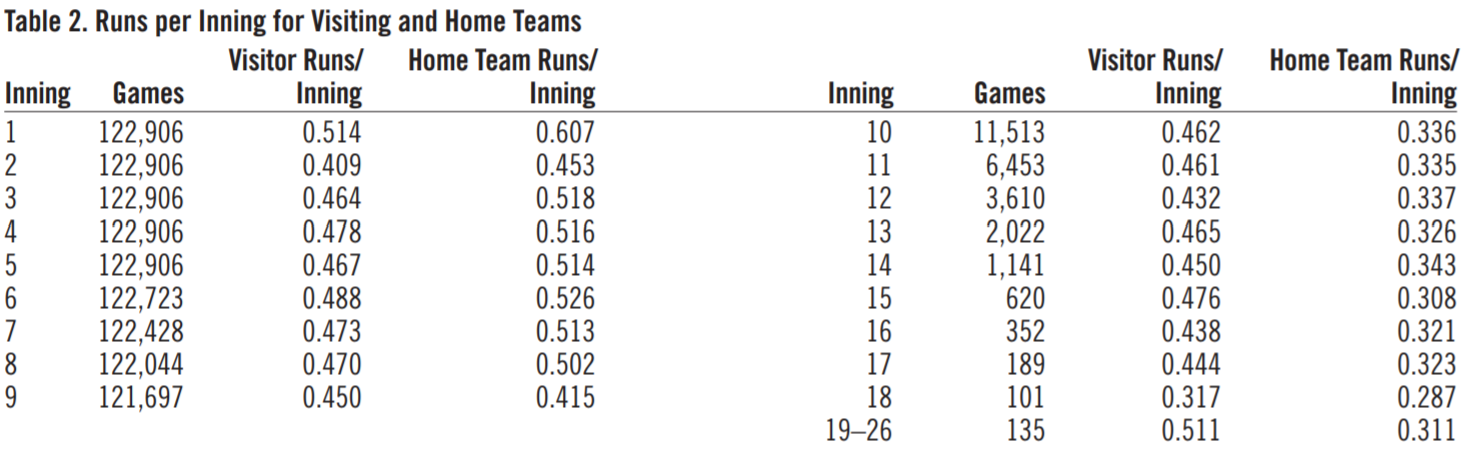
Table 2 presents a summary of the basic run-scoring data by inning for all games from these 73 seasons. There are several interesting features. First, note that the highest-scoring inning for both home and visitor is the first. There is a substantial drop-off in the second inning, probably because the bottom of the order is involved. The home team scores more in each inning from the first through the eighth, but then the trend reverses. For the ninth inning and all extra innings, the visitors outscore the home team.
How do these facts fit into the winning of games? That, after all, is our ultimate question. The conventional wisdom is that the home team has an advantage by batting last, but let’s see just how big that advantage is. (See table 3.)
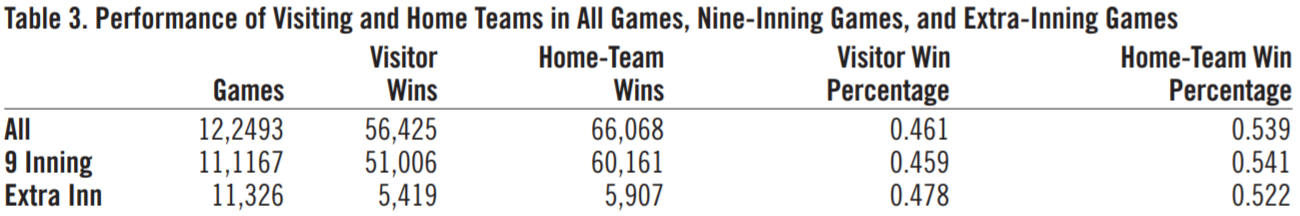
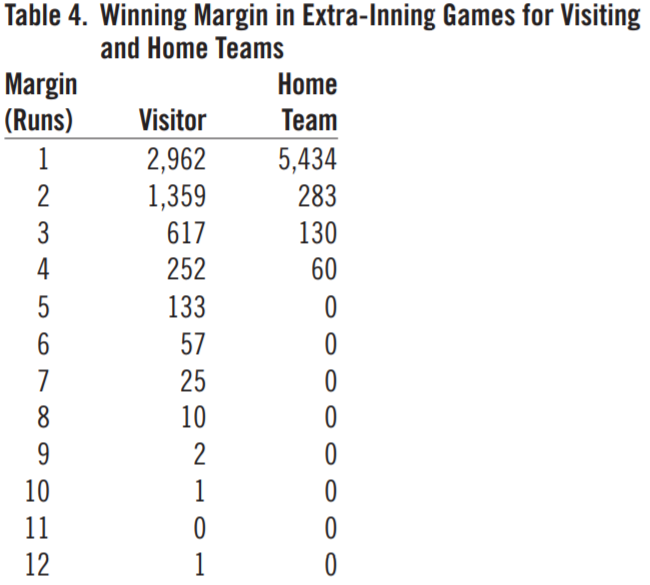
As expected, the home team does do better, though, perhaps surprisingly, its advantage decreases in extra-inning games. In fact, we may ask why the home team wins more than half the time, given the distinct scoring advantage the visiting team has in the ninth inning and later. The answer, of course, is that the rules are a bit different in extra innings, with the game ending if and when the home team takes the lead, whereas the visitors keep batting, no matter how many runs they score. This argument applies to the ninth-inning differences as well. This suggestion is borne out by the data in table 4, which shows the winning margin, for visiting and home teams, in extra-inning games. The only category in which the home team dominates in extra innings is the one-run victory. Four is the maximum possible margin by which the home team can win in extra innings. In extra-inning games decided by more than one run, the visiting team wins many times more than does the home team and wins many games by more than four runs.
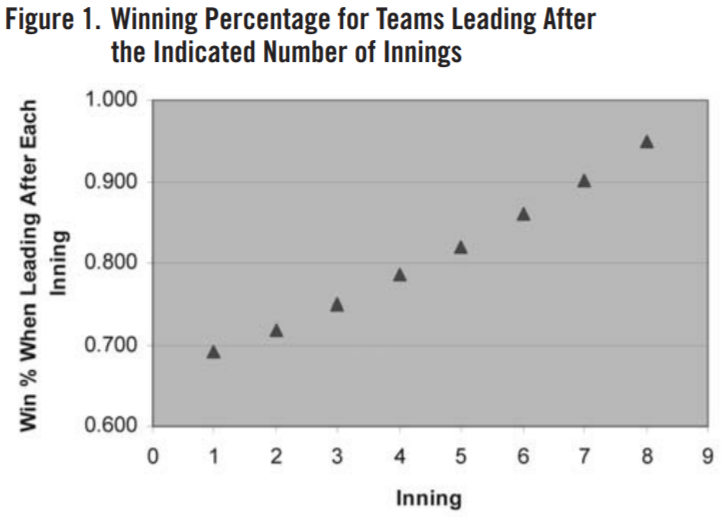
Let’s turn now to the value of an early lead. Figure 1 presents the winning percentage of all teams across all seasons when leading after a given number of innings. The pattern is striking. Teams that lead after the first inning win nearly 70 percent of the time, and the winning percentage gets consistently better with each passing inning. A lead after eight innings holds up 95 percent of the time. This is a point worth keeping in mind the next time you hear an announcer praise a team for the way its great bullpen gets the job done.
Of course, the size of the lead matters as well, as shown in figure 2.
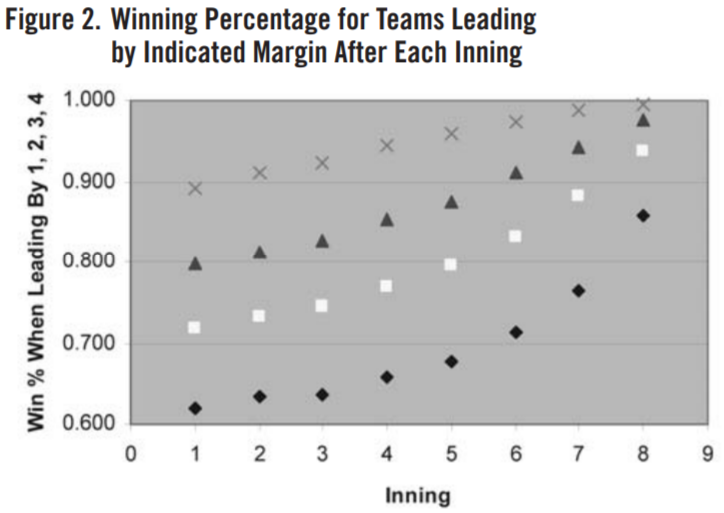
A lead of four runs at the end of eight innings has been converted to a win 99.5 percent of the time. The raw numbers are 44,324 wins and only 213 losses in the 73 seasons examined.
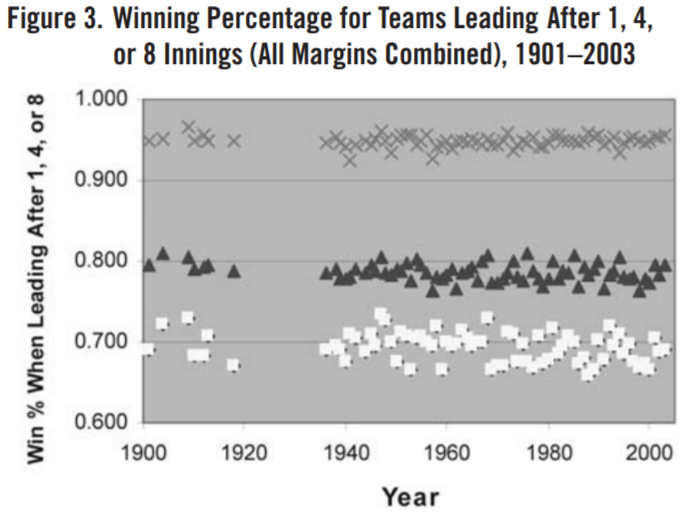
Of course, a modern reality is bullpen specialization, with every team feeling obligated to find a closer to preserve the ninth-inning lead. I therefore analyzed this question across the last century to look for any obvious patterns. As figure 3 shows, there are no discernible differences from 1901 through 2003 (data shown for leads of all sizes after one, four, and eight innings). What this says about the necessity of a closer is interesting, though not our main topic here.
The final approach to this question of success when leading after eight innings is to examine individual teams—an apt subject to investigate, as on broadcasts we hear so much about preserving leads late in the game. In the 73 years studied, there were 1,566 team-seasons. Of these, there were 40 teams that never lost a lead after eight innings. The number of wins ranged from 97 for the 1954 Indians to 34 for the 1981 Mets. Here are all the times with unblemished marks in at least 80 games.
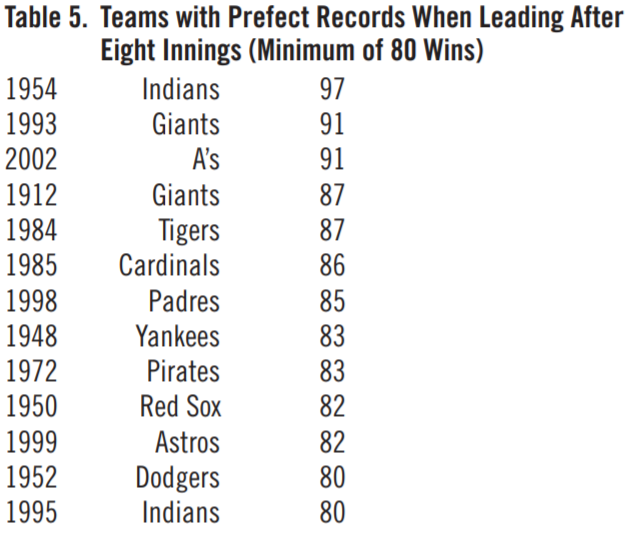
By the way, the 1998 Yankees had the largest number of wins when leading after eight, but they lost once, for a mark of 102—1 in these situations.
The flip side of this is to ask what teams have the worst marks when leading after eight innings. This will give us some perspective on the good performances. The answer is in table 6.
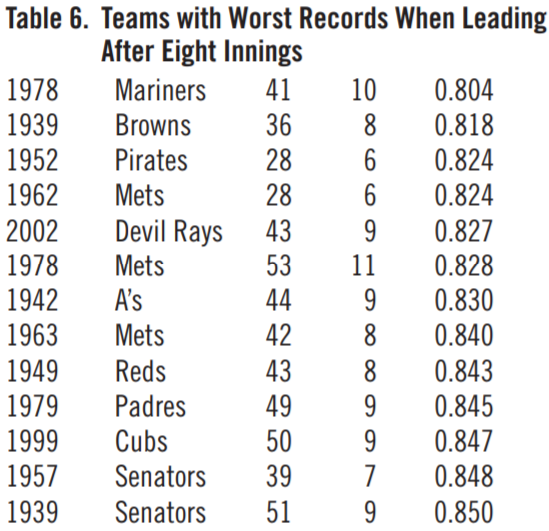
There are some teams there that are easily recognizable as pretty poor, but note that the worst performance I could find was for a team that still won more than 80 percent of its games in these situations. There were only four teams that lost 10 or more times when leading after eight innings, with the 1978 Mets being the only team with 11 losses.
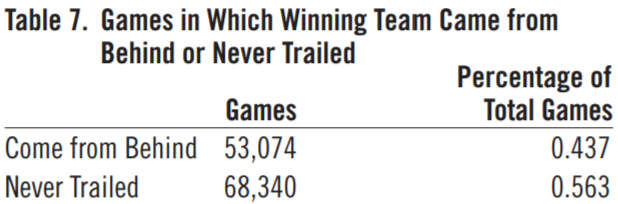
Another achievement that is often associated with successful teams is the ability to win games by coming from behind. A win of this type is to be distinguished from one in which the lead never changed hands. Table 7 presents the raw data.
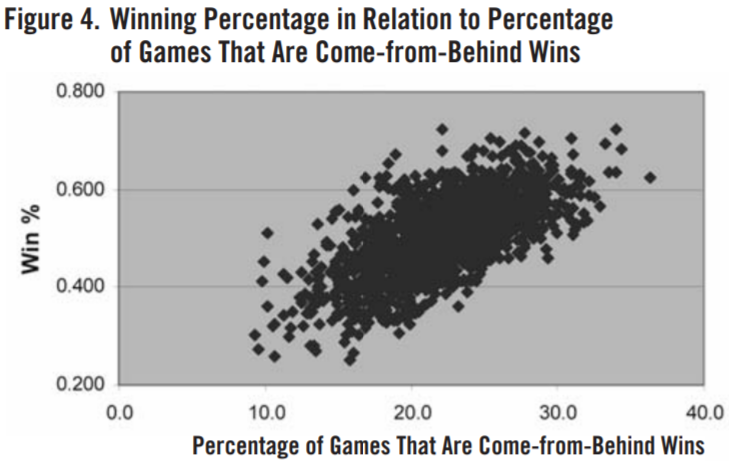
Do the better teams win more games in which they come from behind? Figure 4 presents each team’s winning percentage in relation to the percentage of games in which they came from behind to win. The relation is moderately strong, with a correlation coefficient of 0.65.
The other side of this coin is the relation between winning percentage and the percentage of games in which winner never trailed. These results are shown in figure 5.
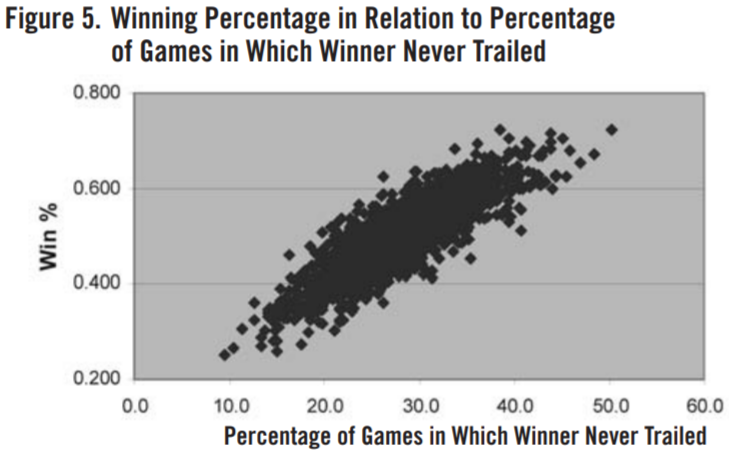
This relation is much stronger, with a correlation coefficient of 0.86. This result is in good agreement with my earlier finding (in 2003) that indicated that winning by a large margin is a better predictor of success than is winning close games.
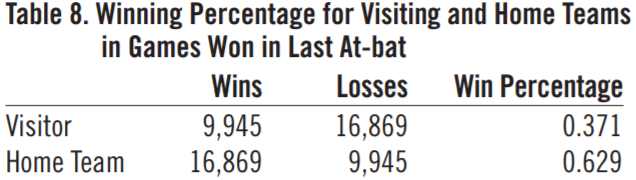
The final topic I will address is the matter of winning in the last at-bat. This is certainly exciting and announcers generally praise it strongly. But once again the question is whether it has long-term meaning as a predictor of team success. First, the raw numbers are in table 8. The huge differences between visitors and home are not unexpected.
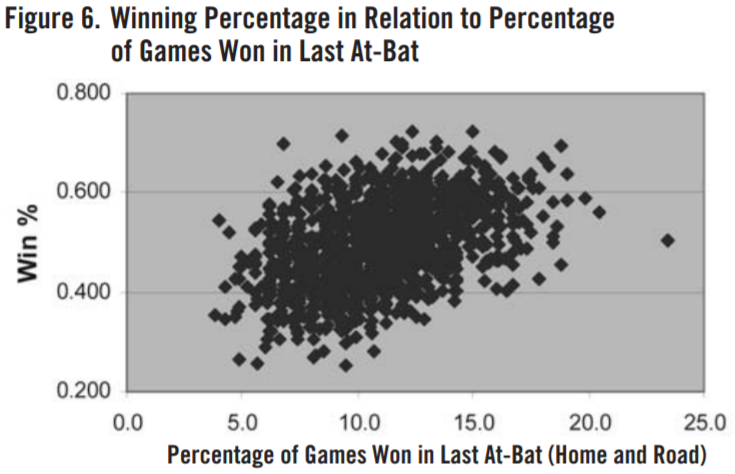
The value in overall success is shown in figure 6. The relation is moderate, with a correlation coefficient of 0.42. The values here are combined for home and road for each team; the relation is even weaker if they are considered separately.
CONCLUSIONS
- Home teams score more in each of first eight innings.
- Visiting teams score more in each extra inning.
- An early lead is very valuable.
- The introduction of the closer has not changed the ability of teams to preserve late-inning leads.
- Coming from behind and winning in the last at-bat is only moderately important.
- The most successful teams get the lead and keep it.
- Total scoring is by far the best predictor of overall success.
Acknowledgments
This article is based on a presentation at the annual SABR convention in July 2004. A version of this is posted at www.retrosheet.com.
Notes
1 David Smith, “Do Good Teams Really Win More of the Close Games?” www.retrosheet.org/Research/SmithD/WinClose.pdf.