

Competitive Balance in the Free Agent Era: The Dog That Didn’t Bark
This article was written by David J. Gordon
This article was published in Fall 2020 Baseball Research Journal
This paper examines competitive balance in the free agent era by comparing the old reserve clause system versus the modern collectively bargained system.
Baseball’s reserve system began modestly on September 29, 1879, when the National League owners introduced a new rule that would eventually be incorporated into every player contract and would allow each franchise to retain the services of five designated players for the following season.1 Their explicit intent was to hold down labor costs and thereby insure franchise stability: “The financial results of the past season prove that salaries must come down. We believe that players in insisting on exorbitant prices are injuring their own interests by forcing out of existence clubs which cannot be run and pay large salaries except at a large personal loss.”2
Indeed, the movement of players from team to team, even in midseason, had helped sink the old National Association (1871–75) four years earlier, as weaker teams were often unable to complete their schedules, generating a revolving door of failed and replacement franchises. However, having gained a foothold, the NL pushed the “reserve clause” concept forward aggressively, gradually increasing the number of reserved players and instituting a rigid salary structure in 1889. This set off a mass rebellion, led by John Montgomery Ward and his Brotherhood organization, which formed a rival league in 1890.3 Indeed, the 1890 Players League was but one of five new leagues that challenged the NL’s dominance in the first 35 years of the reserve rule—along with the American Association (1882–91), Union Association (1884), American League (1901–present), and Federal League (1914–15).
The competition from each new league provided a temporary boost in player salaries, but in time each new league either joined the NL in adopting the reserve rule or went out of business.4 In 1922, the US Supreme Court in effect gave its imprimatur to the reserve rule by holding MLB exempt from the Sherman Anti-Trust Act of 1890.5 Subsequently, the reserve rule’s encroachment on player freedom grew ever more onerous and monopolistic and eventually encompassed all players who signed contracts in professional baseball, even those on minor league rosters, binding each player in perpetuity to the team that held his contract. MLB’s anti-trust exemption was upheld as recently as 1972, when the US Supreme Court ruled against Curt Flood, 5–3.6 However, the courts also ruled that MLB was subject to regulation by the National Labor Relations Board and in 1975 upheld arbitrator Peter Seitz’s decision to grant free agency to two players, Dave McNally and Andy Messersmith, who had played without contracts that season, thereby ending the reserve system as it had been constituted and forcing the owners to create the system of arbitration, seniority, and free agency in place today.7
During those 96 years, the rationale for the reserve rule shifted subtly.8 In 1956, economist Simon Rottenberg wrote, “The defense most commonly heard is that the reserve clause is necessary to assure an equal distribution of playing talent among opposing teams; that a more or less equal distribution of talent is necessary if there is to be uncertainty of outcome, and that uncertainty of outcome is necessary if the consumer is to be willing to pay admission to the game. This defense is founded on the premise that there are rich baseball clubs and poor ones and that, if the players’ market was free, the rich clubs would outbid the poor for talent, taking all the competent players for themselves and leaving only the incompetent for other teams.”9 Never mind that the reserve rule system did not prevent the 1956 New York Yankees from winning their 22nd AL pennant and 17th World Series in 36 years!
Rottenberg argued that competitive balance would be preserved in a free market, because rich teams would be constrained by diminishing returns from hoarding excessive talent and because each team’s success ultimately depends on a competitive environment. Even under the reserve rule, he argued, rich teams have a competitive advantage in acquiring and retaining talent via amateur signings and trades. “It seems, indeed, to be true,” he concluded, “that a market in which freedom is limited by a reserve rule such as that which now governs the baseball labor market distributes players among teams about as a free market would.”10 Now, 45 years after the replacement of the old reserve system with the modern collectively bargained system, in which player movement and compensation is less constrained, we have the opportunity to assess the impact of this change on competitive balance.
METHODS
This article will address two important aspects of competitive balance:
- Static Parity: Are the pennant races in each league closely contested each year?
- Dynamic Parity: How much upward and downward mobility exists from year to year? Are there perennial “haves” and “have-nots” or is there genuine hope for the teams at the bottom?
Lack of static parity is no fun for the fans of losing teams, but as Cubs and Astros fans can attest, dynamic parity is what keeps fan interest alive through the lean years.
Static Parity
I have used two methods to evaluate static parity:
- The simplest metric is to count the number of outstanding, good, average, poor, and terrible teams in each season. In periods of relative balance, the percentage of teams in or near the middle rises and the percentage of outstanding and terrible teams falls. In periods of relative imbalance, the percentage of teams at either extreme grows, and the middle of the distribution shrinks. I have used a >600 winning average (98-64 in a 162-game season or 93-61 in a 154-game season) as the lower threshold for “outstanding,” a > 0.550 winning average (90-72 in a 162-game season or 85-69 in a 154-game season) as the lower threshold for “good,” a < 0.450 winning average 72-90 in a 162-game season or 69-85 in a 154-game season) as the upper threshold for “bad,” and a < 0.400 winning average (64-98 in a 162-game season or 61-93 in a 154-game season) as the upper threshold for “terrible.” Teams with a winning average below 0.550 but above 0.450 are considered “average.”
- The Noll-Scully ratio (NS) provides a more sophisticated and comprehensive way to quantify competitive balance. This metric is the ratio of the observed standard deviation of winning percentage in a league to the “theoretical ideal” standard deviation of a league in which all the teams have equally talented rosters.11 In the “perfect parity” scenario, it is as if each game were decided by a coin flip. The standard deviation of winning average in such a league is the mean winning average divided by the square root of the average number of games played per team (not counting ties). This comes out to 0.0393 when the mean winning average is 0.500 and each team plays 162 games but was higher in strike-shortened seasons and before expansion, when the schedule was shorter. A league that was so balanced that the outcome of every game was random would not generate much interest. Obviously, a sport generally thrives best in a competitive environment in which there are clear favorites and underdogs but where the underdogs stand a fighting chance.12 Historically, NS ratios in MLB have ranged from 1.25 to 3.3 but have remained mostly between 1.5 and 2.5 since 1960. I have combined both major leagues in my analyses to smooth out yearly fluctuations and to guarantee a mean winning average of 0.500 even after the introduction of interleague play. Since the NS ratio measures the top-to-bottom spread of all MLB teams, not just the parity of teams at the top, a low NS ratio does not guarantee close pennant races, nor does a high NS ratio preclude this possibility (especially with divisional play and wildcard teams).
Dynamic Parity
I have used three methods to evaluate the even more important issue of dynamic parity:
- I have compared Pearson correlation coefficients of winning percentages in seasons separated by one to five years during different historic periods. The greater the dynamic parity, the faster the correlations decline toward zero.
- I have compiled a simple descriptive tabulation of the longest streaks of winning and losing seasons by individual teams at different points in MLB history.
- I used a standard life table method, introduced by Kaplan and Meier to analyze survival curves in clinical trials using a non-parametric long-rank (chi-squared) statistic to assess statistical significance, to compare the “longevity” of streaks of winning and losing seasons in different eras.13,14 As applied to baseball winning (or losing) streaks, one calculates the cumulative probability that a streak survives for a given number of consecutive seasons and compares streaks that begin in different historic eras.
I have confined my analysis to post-1900 since MLB franchises and leagues were not stable before then. All the team records are taken from Baseball-Reference.com.15 I have used the Student t-test to assess statistical significance of differences between means in NS ratio and inter-season correlation coefficients in different historic periods. Microsoft Excel built-in functions STDEV.P, CORREL, and T.TEST were used to calculate all standard deviations, correlation coefficients, and t-tests, respectively.
RESULTS
Static Parity
In Table 1, I have divided MLB history into three periods: the pre-expansion era (1901–60), a transition period (1961–75), in which MLB underwent rapid growth with the old reserve rule still intact, and the modern free agency era (1976–2020).
Table 1: Distribution of Winning Averages in Three Historic Periods
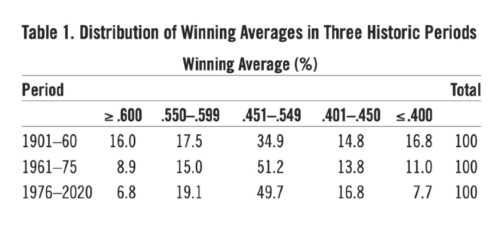
“Extreme” teams (with winning average exceeding .600 or below .400) were more than twice as frequent before the 1961 expansion as after the 1975 downfall of the reserve rule. About half of all post-1975 teams resided in the middle part of the distribution, compared with 35% of all pre-1961 teams. Thus, competitive balance clearly did not suffer from the introduction of voluntary free agency. However, competitive balance during the 1961-75 transitional period more closely resembled the post-1975 than the pre-1961 period. It therefore seems that the post-1960 increase in competitive balance anteceded the modification of the reserve rule and was not caused by it.
The more sophisticated Noll-Scully (NS) ratio analysis confirms this general picture (Figure 1).
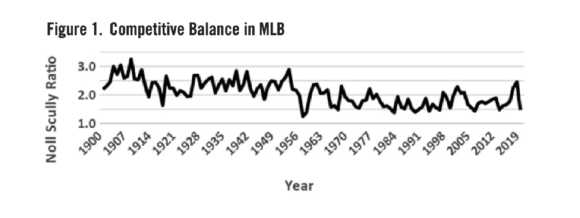
The drop in NS ratio seems to have taken hold sometime between 1958 and 1966, with the exact timing muddled by expansion-related spikes in 1961–62 and 1969. The average NS ratio was 2.36 in 1901–60 versus 1.75 in 1976–2020; the difference was strongly statistically significant (P < 0.0001). The high NS ratio during the pre-expansion era pre-dated the Yankees dynasty of 1921-64 and did not differ systematically between the two major leagues.16 Indeed, NS ratio often exceeded 3.0 in the Deadball era, reaching an all-time high of 3.29 in 1909, when five out of 16 teams, led by the 110-42 Pirates won > 60% of their games, and four teams, “led” by the 42-110 Senators, won < 40% of their games. Despite the introduction of eight expansion teams in 1961-75, the average NS ratio during this period was 1.90, significantly less than in 1901–60 (P < 0.0001), and not statistically different from the 1976–2020 average.
My analysis also confirms that the small uptick in NS ratio in the first decade of the twenty-first century, attributed by Baumer and Zimbalist to an increasing competitive advantage enjoyed by the large market teams, has continued in 2011–20.17 The NS ratio for both leagues combined increased from 1.64 in 1980-99 to 1.82 in 2000-20. The difference in means was statistically significant (P = 0.02), although the test for a linear trend was not (P = 0.30). There was a recent surge in NS ratio in the AL to 2.77 in 2018 and 2.89 in 2019, thanks to three 100-win and three 100-loss teams in each season; the NS ratio remained below 2.0 in the NL, which had only one 100-win team (the Dodgers) and one 100-loss team (the Marlins) in 2019 and none of either in 2018. The NS ratio for both leagues combined reached 2.45 in 2019, its highest level since 1954, but fell back to 1.47 in the pandemic-shortened 2020 season.
Dynamic Parity
There is more to competitive balance than a series of static snapshots of the distribution of winning averages in a succession of seasons. Any meaningful analysis of competitive balance must bring dynamic parity into the mix. While greater static parity implies that bad teams don’t have to climb as far to become contenders (and that good teams don’t have to fall as far to slip from contention), one must also have a high enough season-to-season turnover rate to give realistic hope to the fans of have-not teams. Most fans will tolerate a terrible team for a few years if those lean years are followed by a similar period of excellence.
A useful way of approaching dynamic parity is to analyze how closely team winning averages are correlated from one season to another and how quickly this correlation dissipates over time. In Figure 2, I have plotted the mean correlation of team winning averages in seasons separated by one to five years during the three eras defined above—the pre-expansion era (1901–1960), the transitional period between the first expansion and the overthrow of the old reserve system (1961–75), and the modern free agency era (1976–2020).
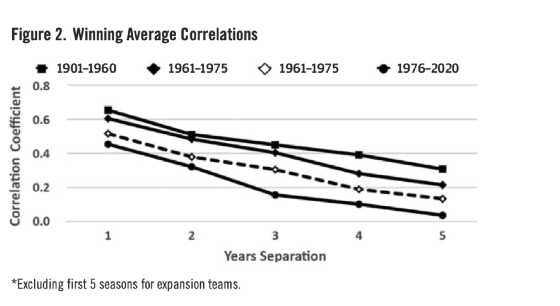
Since each correlation coefficient includes two seasons, only teams that were in existence during both seasons were included in each calculation. Because most new expansion have little upward mobility in their early years, the correlation coefficients for 1961–75 was calculated both including (solid line) and excluding (dashed line) the first five seasons of the eight expansion teams debuting in that period. Omitting the first five seasons of the six post-1975 expansion teams made no difference.
As would be expected, within each era the correlations of winning averages in two seasons grow weaker as the seasons are further separated in time, reflecting the arrival, emergence, decline, and departure of key personnel. However, the correlations were consistently far stronger in 1901–60 than in 1976–2020 (P < 0.0001). Indeed, in the pre-expansion era, the winning average was correlated by 30% (on the average) with its winning average as long as five years later. By contrast, in the modern free agency era, the winning average of a given team was essentially uncorrelated (on the average) with its winning average five years later. The correlation coefficients from the transitional period (1961–75) are intermediate between those of the pre-expansion and free agency eras.
Because this relatively short 15-year period included the introduction of eight expansion teams, the correlation coefficients are strongly influenced by whether one includes or excludes the first five seasons—mostly dismal—of these teams. With expansion teams included, the correlation coefficients do not differ significantly from those of 1901–60 and differ significantly (P = 0.001 to 0.014) from those of 1976–2020. However, the situation is reversed when those new expansion teams are excluded; the correlation coefficients do not differ significantly from those after 1976 and differ significantly (P = 0.007 to 0.04) from those before 1960. Note that correlation coefficients during the current era (1976–2020) are unaffected by whether the first seasons of the 1977, 1993, and 1998 expansion teams are included. This reflects both the relatively small number of such teams (six in 44 years) and the rapid success of the Diamondbacks (1998) and Marlins (1993), who won the World Series in their fourth and fifth seasons, respectively.
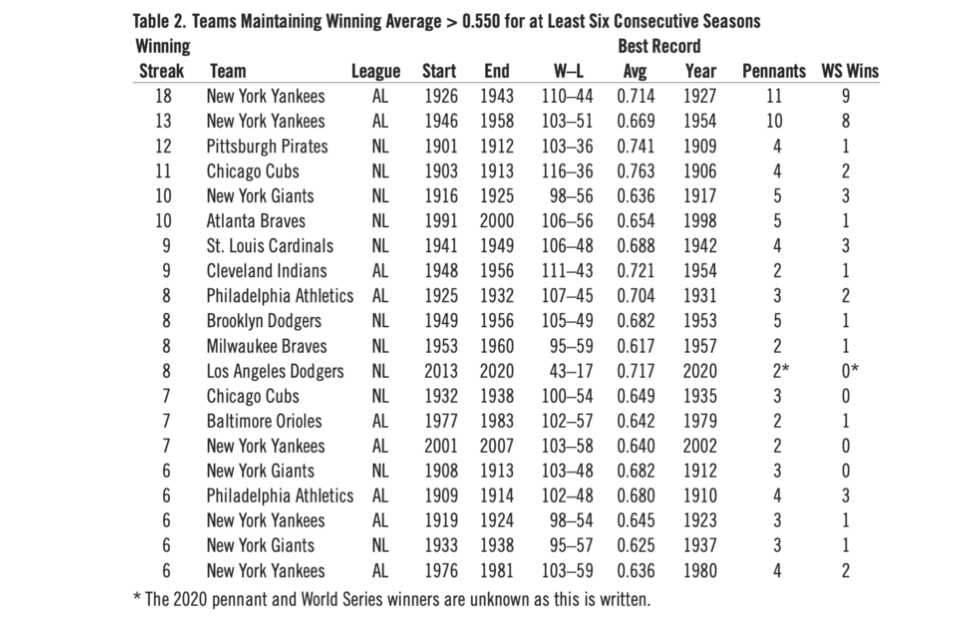
Because of the simultaneous improvements in both static and dynamic parity, we now see far fewer long streaks of winning and losing seasons now than we did before 1960. Table 2 lists the 20 teams in modern MLB history that have maintained a 0.550-plus winning average for six or more consecutive seasons.
Table 2: Teams Maintaining Winning Average > 0.550 for at Least Six Consecutive Seasons
(Click image to enlarge)
All but five of these long winning streaks (and 10 of the top 11) were compiled before 1960. The longest post-1960 winning streak, 10 seasons, was by the 1991–2000 Atlanta Braves, who won five NL pennants and one World Series during that decade-long streak. However, five pre-expansion teams compiled even longer winning streaks, led by the 1926–43 Yankees, who won 11 AL pennants and nine World Series in 18 years, and the 1946–58 Yankees, who won 10 AL pennants and eight World Series in 13 years. But it wasn’t just the Yankees. In the NL, the 1901–12 Pirates, the 1903–13 Cubs, and the 1916–25 Giants, each compiled double-digit winning streaks, in which they won a combined 13 pennants and six World Series.
The longest consecutive streak of 0.600-plus seasons since 1961 is five, by the 1972-76 Big Red Machine. No other post-expansion team had more than three consecutive 0.600-plus seasons, although the 2017–19 Astros are currently working on a three-season streak. By contrast, four pre-expansion teams—the 1947–57 Yankees, the 1904–10 Cubs, the 1941–46 Cardinals, and the 1928–32 Athletics—each had streaks of five or more consecutive 0.600-plus seasons. Although static parity was slightly worse in 2000–19 than in 1980–99, dynamic parity has been better than ever. All 30 MLB teams have reached the postseason at least once since 2000, with 20 different teams reaching the World Series and 13 different teams winning it. Only three teams—the 2000-01 Yankees, the 2008-09 Phillies, and the 2010-11 Rangers—won consecutive pennants during this period, and no team since the 1998–2000 Yankees has won consecutive World Series.
On the other side of the coin, 26 teams have endured losing streaks of six or more consecutive seasons with a winning average < 0.450 (Table 3).
Table 3: Teams Enduring Winning Average < 0.450 for at Least Six Consecutive Seasons
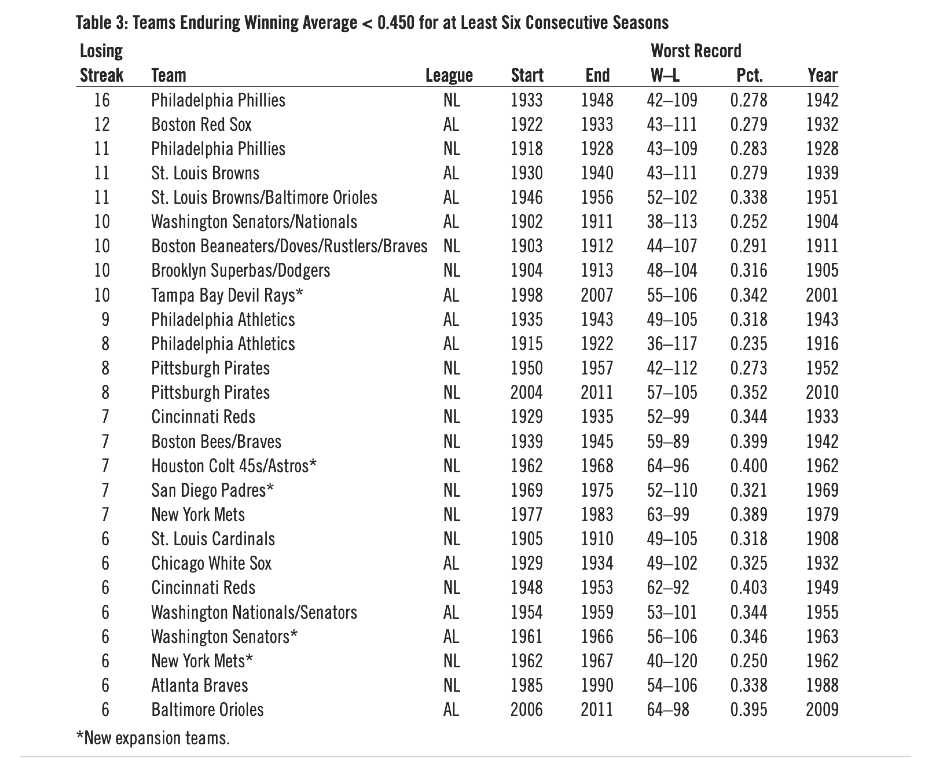
(Click image to enlarge)
Five of these streaks belonged to new expansion teams, topped by the 1998–2007 Devil Rays. Seventeen others, including nine of the top ten, took place before the 1961 expansion. Established teams endured only four post-1960 losing streaks of six or more seasons—the 2004–11 Pirates, the 1977–83 Mets, the 1985–90 Braves, and the 2006–11 Orioles. All four teams made the postseason within five years after their losing streaks ended; the 1986 Mets and 1995 Braves won the World Series.
Fans of the inept 2019 Tigers, Orioles, Marlins, and Royals teams should consider themselves lucky when they compare their situation to that of the long-suffering fans of the hapless 1918–48 Philadelphia Phillies, who won more games than they lost only once (78–76 in 1932) in a span of 31 years. Fans of the 1937–67 Athletics, 1930–59 Browns/Orioles, 1947-66 Cubs, 1917–45 Braves, 1919-36 Red Sox, and 1947–61 Nationals/Senators/Twins didn’t fare much better. Since 1960, only the 1969–74 Padres, the 1961–64 Senators, and the 1962–65 Mets—all new expansion teams—have suffered through more than three consecutive sub-0.400 seasons.
Figure 3 shows Kaplan-Meier plots of the longevity of streaks of winning and losing seasons during these three periods of baseball history. In Figure 3A, winning seasons are defined as those in which a team’s winning average > 0.550; in Figure 3B, losing seasons are defined as seasons in which a team’s winning average < 0.450. Streaks that overlap two historic periods are considered to belong to the period in which they began.
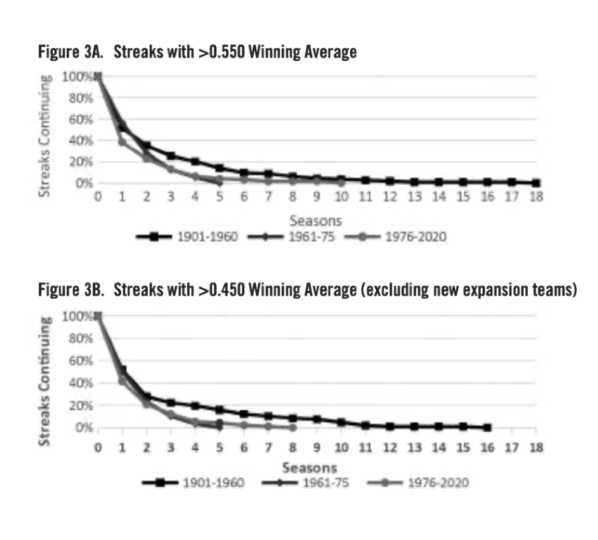
(Click image to enlarge)
Streaks that were ongoing at the end of the 2019 season, are treated as “censored” observations. Losing streaks by first-year expansion teams are not included in Figure 3B. Thus, the 1998–2007 Devil Rays, the 1962–68 Astros, 1969–75 Padres, the 1961–66 Senators, the 1962–67 Mets, the 1977–81 Blue Jays, 1977–81 Mariners, the 1969–72 Pilots/Brewers, the 1969–70 Royals, the 1993–94 Rockies, the 1961 Angels, the 1969 Expos, 1993 Rockies, and 1998 Diamondbacks all got a mulligan.
It is clear once again that teams were able to sustain longer winning streaks (and forced to endure longer losing streaks) in 1901–60 than in 1976–2019. The differences between these two periods are statistically significant both for winning streaks (Chi-squared = 5.37 (1 df), P < 0.025) and losing streaks Chi-squared = 4.48 (1 df), P < 0.05). The 1961–75 transitional period between the first expansion and the end of the reserve clause again resembled the post-1975 period more than the pre-1961 period, although the sample size was too small to reach statistical significance. Thus, the observed change in dynamic parity, like the observed change in static parity, appears to have antedated the modification of the reserve rule. A similar analysis of streaks of seasons with winning averages above 0.600 or below 0.400 gave qualitatively similar results, but the sample sizes were smaller, and the differences between time periods were not statistically significant.
DISCUSSION
Competitive balance in MLB has clearly not collapsed in the 44 years since Peter Seitz handed down his historic decision; in fact, competition is significantly more balanced than it was under the old reserve system. The Yankees no longer dominate the AL, and more teams than ever before reach the World Series. Both static and dynamic parity have improved markedly, accompanied by the near disappearance of extended dynasties and perennial losers. The overwhelming dominance of the Yankees in 1921–64 undoubtedly contributed to the competitive imbalance in those seasons, but competitive imbalance was as evident in the NL (where no single team dominated) as in the AL, and was even more extreme in 1901–20, before the Yankees won their first pennant.
Furthermore, the introduction of divisional play in 1969 and the addition of wild card teams in 1995 and 2012 has expanded the postseason from 12.5% (2/16) of all teams before 1960 to 33.3% (10/30) after 2012 and has enabled more teams to reach the postseason, over and above any improvements in the underlying parity of competition. Thus, many lesser teams, including four with a sub-0.540 winning average—the 1973 Mets (0.509), the 2006 Cardinals (0.516), the 1987 Twins (0.525), and the 1997 Indians (0.534)—have reached the World Series since the start of divisional play, and two (the 2006 Cardinals and 1987 Twins) have won the World Series.
So, what happened circa 1960 that might account for the observed improvement in competitive balance? I believe that the game-changer was greater parity in financial resources, due primarily to two interrelated factors:
- Migration/Expansion: Starting in 1953, the second MLB teams in crowded two-team cities like Boston, St. Louis, and Philadelphia began to leave for greener pastures, thereby tapping into new markets and allowing the teams that stayed behind to thrive. This trend accelerated in 1958 when the Dodgers and Giants left New York for California, thereby opening up rich new markets and giving MLB a coast-to-coast scope for the first time. Then in 1961–77 MLB expanded into the south (Atlanta, Houston, and Dallas), west (Anaheim, San Diego, Oakland, and Seattle), and Canada (Montreal and Toronto), as well as adding Minneapolis and replacing departed teams in New York, Kansas City, and Milwaukee. This geographical expansion gave every team an ample uncontested territory from which to draw fans and created a national audience for the product.
- Television:18,19 Baseball games were first televised commercially in the 1950s, mainly locally in the larger markets, and took a distant back seat to ticket purchases as a source of revenue. There was a national TV game of the week on Saturday afternoons as early as 1953, but telecasts were blacked out within 50 miles of any major league stadium and not every team signed on. As late as 1962, TV revenue totaled $16.8, only $4 M of which was generated by national telecasts and benefited mainly the richer teams. However, this all changed in the 1960s and 1970s. Local TV revenues increased to $22.5 M in 1971 and $39 M in 1980. Even more importantly, national TV revenues, which were shared among all teams, grew to $18 M in 1971 and $41 M in 1980. By 1983, MLB’s combined $153.7 M in local and national TV revenue accounted for more than 30% of MLB’s $500 M total annual revenue. Revenue from television and other media has continued to grow since then.
By 1980, each team had not only a viable local market, but a guaranteed share of an ever-growing revenue stream with which to compete for talent. While small-market teams like the Reds, Royals, and Brewers were still not on an equal footing with behemoths like the Yankees and Dodgers, they could compete as never before for top talent.
The creation of new revenue streams was accompanied by new streams of African American and international talent. Although Jackie Robinson broke the “color barrier” in 1947, integration was slow to take hold. Only 12 African American players reached the major leagues by 1950—eight of them with the Dodgers and Indians, who (not coincidentally) rose from futility to become two of the most successful teams of the late 1940s and 1950s; the Red Sox did not integrate until 1959.20 Even in 1957, 10 years after Jackie Robinson, baseball still had only 6.7% African Americans and 5.2% Latinos; by 1980, these percentages had climbed to 18% and 10%, respectively.21 While these new sources of talent were offset in part by the need to staff a 50% increase in the number of teams (from 16 to 24), the influx of minority players was disproportionately rich in exceptional talent, as measured by the number of Hall of Famers and by metrics like JAWS.22
A third contributing factor to the increase in competitive balance was the implementation of the annual amateur draft in 1965, which gave small-market teams access to top amateur talent without having to match the large-market teams dollar for dollar.23 Since it takes time for amateur talent to reach the major leagues, the arrival of the amateur draft in 1965 cannot explain the drop in NS ratio, which was already evident by the mid-1960s. But it did not take long for the draft’s positive impact on the upward mobility of losing teams to be felt. Charles Finley’s 1971–75 Oakland A’s were the prototype of a longtime (1937–67) losing team using the new amateur draft to build a winner. Reggie Jackson (second overall pick in 1966), Vida Blue (second round pick in 1967), Sal Bando (sixth round pick in 1965), Gene Tenace (20th round pick in 1965), and Ken Holtzman (acquired in a 1971 trade for Rick Monday, the first overall pick in 1965) were core players on this three-time World Series champion.
So what was the impact of free agency on competitive balance? While the observed improvement in competitive balance began with the reserve clause still in place, the specter of the calamitous destruction of competitive balance and the consequent failure of small-market teams, frequently raised to justify the reserve clause, utterly failed to materialize when the reserve system was overturned in 1975. As Sir Arthur Conan Doyle might have put it, free agency was “the dog that didn’t bark.”24 Indeed, exactly as Rottenberg had predicted in 1956, the replacement of MLB’s reserve system by a relatively free market changed only the distribution of money between players and owners, not the distribution of talent among teams.25
Starting in 1974, when Catfish Hunter was declared a free agent on a technicality, the Yankees used the new free agent system to acquire the services of Hunter, Reggie Jackson, and Rich Gossage, who joined a strong core of Thurman Munson, Graig Nettles, Willie Randolph, Ron Guidry, Sparky Lyle, Mickey Rivers, and Chris Chambliss to run off four pennants and two World Series championships in 1976–81. But is this is really so different than the Yankees’ purchase of Babe Ruth’s contract from Harry Frazee, the financially distressed owner of the Red Sox for $100,000 in 1919, or their acquisition of Joe DiMaggio’s contract from the San Francisco Seals (PCL) for cash and four obscure players in 1934, or the acquisition of Roger Maris from the Kansas City Athletics (their go-to patsies in the 1950s) in 1959 in a lopsided trade? The main difference is that Hunter, Jackson, and Gossage—not the owners of their teams—got paid.
Recent articles by Edwards and Calandra have raised concern about the adverse impact of “tanking” on competitive balance during the past decade.26,27 First, let us clarify what we mean by the term “tanking.” I would use that term to describe the systematic dismantling of a competitive team by financially motivated personnel moves that relegate that team to winning fewer than 40% of its games in the near future. Connie Mack, who dismantled championship teams in 1915 and again in 1932–35, was the prototypical tanker, and (without the benefit of an amateur draft) the rebuilds took 14 and 30+ years, respectively. Within living memory, Wayne Huizenga’s dismantling of the Marlins after their 1998 World Series Championship is a more successful example of tanking; they won another World Series in 2003. Note it is not tanking when a bad team trades veterans for prospects. That is merely what smart GMs have been doing since 1900, when the last-place New Your Giants trade fading Hall of Famer Amos Rusie for unproven 20 year-old Christy Mathewson, who helped pitch them to five NL pennants and three second-place finishes in 1904–13.28
Among the five teams that lost 100+ games in 2018 and/or 2019, only the Marlins and White Sox fit the definition of tankers. After assuming ownership of the Marlins, Derek Jeter dismantled a team that was coming off two disappointing 79- and 77-win seasons in 2016–17, trading its core of young stars (Stanton, Ozuna, Yelich, and Realmuto) to pare payroll and secure last-place finishes and attendant high draft picks in 2018–19. Rick Hahn similarly dismantled a 78-win 2016 White Sox team by trading three of their best players (Sale, Eaton, and Quintana), but these trades were motivated more by the prize prospects they received in return (Moncada, Kopech, Giolito, Dunning, Jimenez, Cease) than by financial considerations.
The Orioles were already terrible (28–69, 0.289) when they kicked off their rebuild by trading Manny Machado on July 18, 2018, and actually improved slightly (to 54–108, 0.333) in 2019. Other than trading Verlander for prospects on August 31, 2017, the Tigers’ fall to 100+ losses in 2019 was due more to the aging and decline of its core stars (especially Miguel Cabrera) than to salary-dumping trades. The Royals’ fall to 100+ losses in 2018–19 was entirely due to the decline and departure of the core stars from its 2015 championship team, not tanking.
Thus, it is incorrect to hold tanking responsible for the confluence of four 100-loss teams in 2019, which brought the NS ratio to its highest level since 1954. It is also premature at best to deem a two-year spike in NS ratio that was confined to the AL (2.77 in 2018 and 2.89 in 2019) a harbinger of a long-term trend. The AL NS ratio exceeded 2.0 only one other time since 2004 in the AL (2.08 in 2013) and not at all in the NL (where the highest NS ratio since 2004 was 1.99 in 2015). Linear regression analysis shows no statistical evidence of a significant positive trend in NS ratio since 2000 in either league or in both leagues combined. Thus, the recent spike in the AL’s NS ratio is consistent with the large normal year-to-year fluctuations throughout MLB history (Figure 1). And as stated earlier, dynamic parity has never been better. Ask any Cubs or Astros fan if spending three years in the tank was worth it.
While a significant and sustained rise in NS ratio to pre-expansion levels would be undesirable, I am optimistic that this will not happen, because of limitations in the efficacy of the tanking strategy. Most teams are already growing increasingly reluctant to trade top prospects, even for established stars. Furthermore, teams like the Rays and A’s have modeled creative ways to compete on a limited budget without tanking. Also, it is not clear that tanking can work for multiple teams simultaneously since there are only so many high draft picks to go around and some don’t pan out. To paraphrase Yogi Berra, nobody will go there anymore if it gets too crowded.29 MLB can always institute an NBA-style draft lottery to discourage tanking, but I doubt that this will be necessary.
CONCLUSION
Baseball’s competitive balance, which left much to be desired in 1901–60, improved markedly by the mid-1960s. This improvement was manifest both in the decreased frequency of teams at either extreme of the spectrum of winning percentage each season and in greater dynamic turnover of winning and losing teams from season to season. These favorable changes in competitive balance are probably attributable mainly to MLB’s expansion to new markets and the explosion of television revenues in the 1960s and 1970s. The influx of new talent streams of African American and Latino players and the implementation of the amateur draft in 1965 also contributed to this improvement.
We cannot know the impact of a true unrestricted free market on competitive balance, since baseball replaced the reserve system, not with a free market, but with negotiated Collective Bargaining Agreements (CBA) that still allow teams to control players until they accrue six years of major league service and to trade non-vested players without their consent. The current CBA also includes salary arbitration, a luxury tax on “excessive” team payrolls, compensatory draft picks, and an amateur player draft with closely regulated bonuses. However, contrary to the gloomy and self-serving predictions of the reserve rule’s apologists, competitive balance in MLB has not only survived but thrived without that system’s onerous constraints on player movement and compensation. The reserve rule’s overthrow in 1975 did nothing to impede MLB’s newfound competitive balance, which has continued to the present day.
DR. DAVID J. GORDON is a retired NIH epidemiologist, who specialized in the conduct and analysis of cardiovascular clinical trials. Since his retirement in 2016, he has pivoted to his longtime love of baseball, writing articles for the Baseball Research Journal on the Deadball era, racial parity in the Hall of Fame, and the impact of free agency on competitive balance and a soon-to-be-published book called Baseball Generations. Dr. Gordon is currently working on a book, based on his NIH experience, analyzing the causes of the 80% decline in heart attack deaths in the US since the 1960s.
Notes
- Edmund P Edmonds, “Arthur Soden’s Legacy: The Origins and Early History of Baseball’s Reserve System,” Albany Government Law Review, 38 (2012). http://scholarship.law.nd.edu/law_faculty_ scholarship/390.
- David J Berri, Martin B Schmidt, Stacy L Brook, “Baseball’s Competitive Balance Problem,” The Wages Of Wins: Taking Measure of the Many Myths In Modern Sport, (Stanford, CA: Stanford Business Books, 2007), 46–68.
- John Montgomery Ward (1887), “Is the Base Ball Player a Chattel?” Lippincott’s Magazine, V40: 310–19.
- James Quirk, Rodney D, Fort, Pay Dirt: The Business of Professional Team Sports (Princeton, NJ: Princeton University Press, 1992) 180–83.
- Wikipedia, Federal Baseball Club v. National League, https://en.wikipedia.org/wiki/Federal_Baseball_Club_v._National_League
- Wikipedia, Flood v. Kuhn, https://en.wikipedia.org/wiki/Flood_v._Kuhn.
- Roger I. Abrams, “Arbitrator Seitz Sets the Players Free,” SABR Baseball Research Journal, Volume 38 (1992), Number 2: 79–85.
- Sky Andrechek, The Case for the Reserve Clause, Sports Illustrated, January 14, 2010, https://www.si.com/more-sports/2010/01/14/andrecheck-freeagency.
- Simon Rottenberg, “The Baseball Players’ Labor Market,” Journal of Political Economy, Vol. 64, No. 3 (1956): 242–58.
- Rottenberg.
- Quirk and Fort, 245–48.
- Quirk and Fort, Chapter 4.
- EL Kaplan, P Meier, “Nonparametric estimation from incomplete observations.” Journal of the American Statistical Association. 53 (282) (1958): 457–481. doi:10.2307/2281868. JSTOR 2281868.
- Wayne W LaMorte,“Comparing Survival Curves,” Survival Analysis (Boston University School of Public Health, 2016) http://sphweb.bumc.bu.edu/otlt/MPH-Modules/BS/BS704_Survival/BS704_Survival5.html.
- Baseball-Reference.com, https://www.baseball-reference.com/teams.
- Berti, Schmidt, and Brook, Tables 4.1–2, 51–52.
- Benjamin Baumer, Andrew Zimbalist, “Chapter 6,” The Sabermetric Revolution, (Philadelphia: University of Pennsylvania Press, 2014).
- Wikipedia, Major League Baseball on Television, https://en.wikipedia.org/ wiki/Major_League_Baseball_on_television.
- Quirk and Fort (1992), 505.
- Wikipedia. List of first black Major League Baseball players, https://en.wikipedia.org/wiki/List_of_first_black_Major_League_Baseball_players.
- Mark Armour, Daniel R. Levitt, “Baseball Demographics 1947–2016,” SABR Biography Project.
- David J Gordon, “Racial Parity in the Hall of Fame,” SABR Baseball Research Journal, 47 (2018): 49–57.
- Wikipedia, Major League Baseball Draft. https://en.wikipedia.org/wiki/Major_League_Baseball_draft.
- Mike Shotnicki, “The Dog that Didn’t Bark: What We Can Learn from Sir Arthur Conan Doyle About Using the Absence of Expected Facts,” BrieflyWriting.com, July 25, 2012, https://brieflywriting.com/2012/ 07/25/the-dog-that-didnt-bark-what-we-can-learn-from-sir-arthur-conan-doyle-about-using-the-absence-of-expected-facts.
- Rottenberg.
- Craig Edwards, “Baseball’s Competitive Balance Problem,” FanGraphs, November 18, 2019. https://blogs.fangraphs.com/baseballs-competitive-balance-problem.
- Will Calandra, “The MLB Has a Competitive Balance Issue, and It’s Related to Money and Payroll Inequalities,” The Georgetown Voice, February 18, 2020. https://georgetownvoice.com/2020/02/18/the-mlb-has-a-competitive-balance-issue-and-its-related-to-money-and-payroll-inequalities.
- Baseball-Reference. Christy Mathewson page. Transactions. https://www.baseball-reference.com/players/m/mathech01.shtml.
- Houston Mitchell., “Yogi Berra Dies at 90: Here Are Some of His Greatest Quotes,” Los Angeles Times, May 12, 2015. https://www.latimes.com/ sports/sportsnow/la-sp-sn-yogi-berra-turns-90-quotes-20150512- story.html.