Did Sign Stealing Make A Major Difference in the 1951 Pennant Race?
This article was written by David W. Smith
This article was published in 1951 New York Giants essays
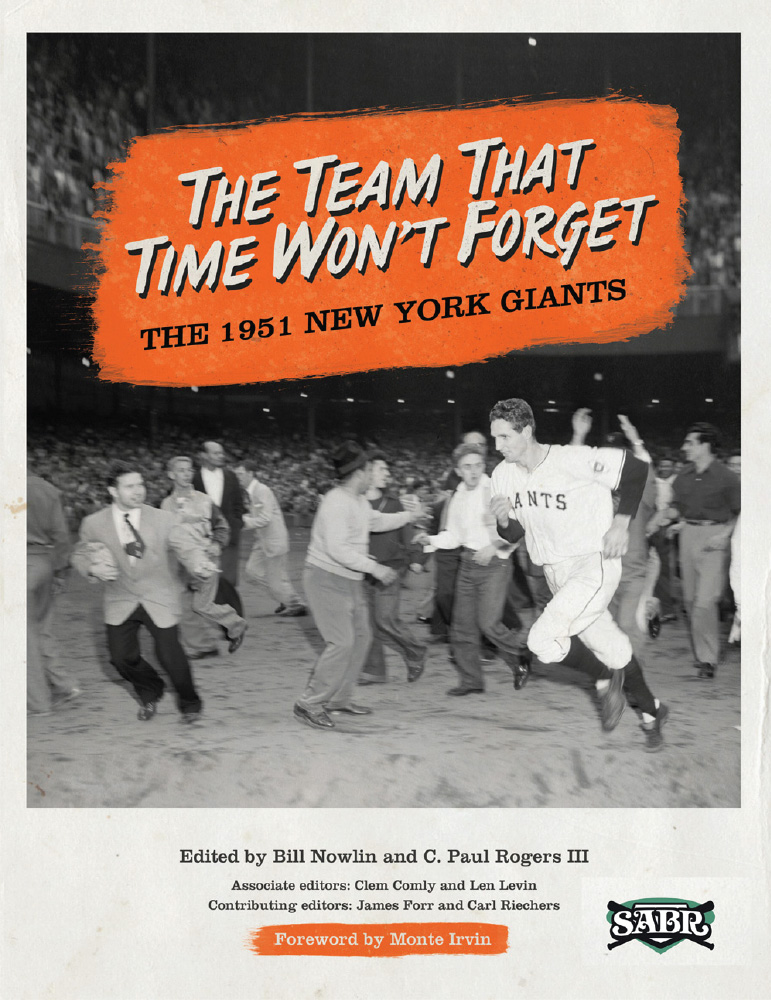 The end of the 1951 National League pennant race is legendary and well known even to casual baseball fans. The final game of the playoff series between the Brooklyn Dodgers and New York Giants is arguably the most famous baseball game ever played. In fact its significance goes even further, as it has been the subject of many sociological and psychological treatises. We have seen a number of 50th anniversary celebrations and analyses.
When Bobby Thomson lined Ralph Branca’s 0-and-1 fastball into the left-field stands, a permanent link between the two men was established in baseball lore, made more vivid by radio announcer Russ Hodges’ nearly delirious description of the play: “The Giants win the pennant,” etc. Although this dramatic ending is central for most people, there is much more of interest that took place in the late summer and early fall of 1951, the first full year of the United States’ presence in the Korean “Police Action.” What happened to put Thomson and Branca together on center stage? Why were so many people caught up in this daily struggle with such passion? Or, to put it more formally, what is the relevant context that will help us to understand why it is still discussed so widely half a century later?
There have been a number of books providing comprehensive records of the daily activities of the two teams.
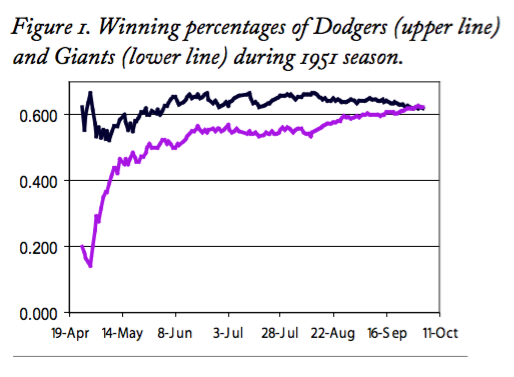
Within the 1951 season, there were several different phases in the relative fortunes of the Dodgers and the Giants. After their near-miss in 1950 at the hands of Dick Sisler and the Phillies, the Dodgers came out determined to make amends in 1951. They started on a positive note by winning five of their first six, but hovered just above the .500 mark until early May, when they put on a burst that took them past the .600 level on May 23; they stayed there for the rest of the season. They jockeyed back and forth with the Boston Braves for first place throughout the first four weeks of the season, but took over by themselves on May 13 and remained on top until October.
The Giants, on the other hand, had a terrible start. After splitting their first four games with the Braves, they came home and were swept by the Dodgers, starting a 10-game losing streak that ended on April 30 with a win over the Dodgers in Ebbets Field. At that point they were 3-12 and were in last place, seven games out. However, by May 23, the day the Dodgers passed .600 for good, the Giants had improved to 17-19, 4½ games behind the Dodgers in a fifth-place tie with Philadelphia. Figure 1 shows the daily winning percentage of both teams, with the differences in the first part of the season readily apparent.
(Click image to enlarge.)
From this point until mid-August, the two teams were generally parallel. Both had steady rises so that by June 19 they were the only two teams in the league with more wins than losses. The Dodgers were 37-19 with a tie (.661) and the Giants were 35-27 (.565), five games behind but in second place. Note that at this point the Dodgers had six fewer decisions than the Giants, a surprisingly large difference. During the next seven weeks, each maintained that pace with the result that the Dodgers widened the gap to 13 games. On the morning of August 12, Brooklyn was 70-36-1 (.660) and New York had a record of 59-51 (.536). Figure 1 shows these plateaus but also shows that the Dodgers had wider swings up and down, but they averaged out. The 13-game margin was the widest at the end of a day’s play for the whole season. It is often noted that the Giants overcame a deficit of 13½ games, which can be derived from the fact that Brooklyn split a doubleheader on the 11th, winning the first contest for the extra half-game over the idle Giants. For all seasons from 1901 through 2014, there are eight occasions on which a team had a lead of 10 games or more and then did not win the pennant. Here is the full list with the team, latest date of their largest lead and the size of that lead:
| Team | Date | Lead |
|---|---|---|
| Dodgers | 8/04/1942 | 10 |
| Dodgers | 8/11/1951 | 13 |
| Red Sox | 7/05/1978 | 10 |
| Astros | 7/04/1979 | 10.5 |
| Giants | 7/22/1993 | 10 |
| Angels | 8/01/1995 | 11 |
| Tigers | 8/07/2006 | 10 |
| Giants | 6/07/2014 | 10 |
The 1951 Dodgers set the mark with the largest lead lost, but losing big leads still happens, as the 2014 Giants discovered. The Dodgers and Giants are the only teams on this list twice. By the way, another famous big lead that was lost was by the 1969 Cubs, but their largest margin was “only” nine games.
From this date to the end, the tide swung entirely in the Giants’ favor. They won 37 of the 44 remaining regular-season games, a pace of .841. On August 12 they launched a remarkable 16-game winning streak with a doubleheader sweep of the Phillies. Over the same period, the Dodgers compiled a record of 26-22 in their remaining 48 games, a percentage of .542. Again Figure 1 shows these patterns rather strikingly. The first summary of the 1951 pennant race is, therefore, that there really wasn’t a contest until there were about six weeks left to play. The 16-game winning streak of the Giants hit Brooklyn hard as the Dodgers went 9-9 over the same 16 days and saw their lead drop to five games. Three of the games in the streak were close contests against the Dodgers, with scores of 4-2, 3-1, and 2-1. Interestingly, 13 of the 16 games in the streak were played in the Polo Grounds, a point to which we will return.
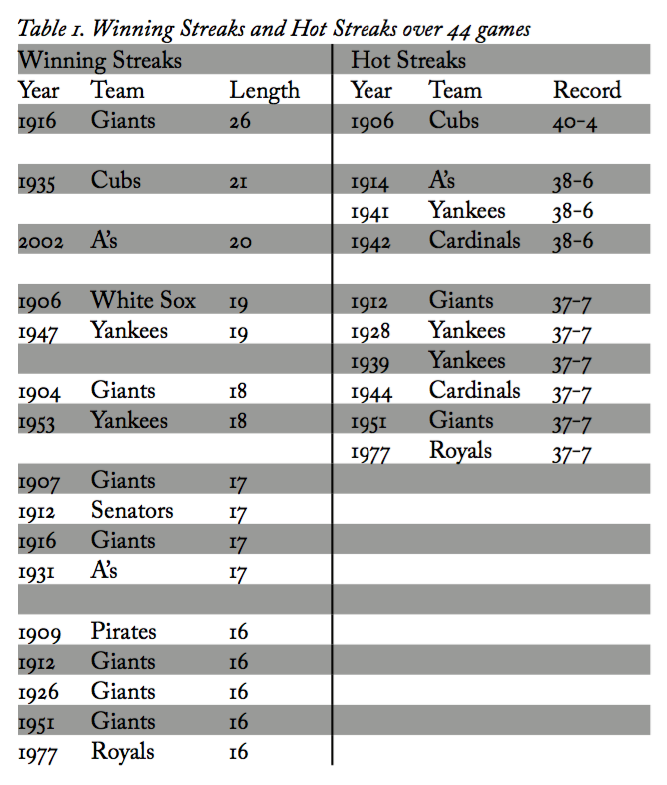
This tremendous surge by the Giants, over both 16 and 44 games, ranks among the very best in the 20th century as summarized in Table 1. From 1901 to 2000, there were five winning streaks of exactly 16 games and only 10 that were longer. Their finishing run of 37-7 is tied for second with the 1906 Cubs. Only the 1942 Cardinals had a closing run that was better when they caught and then passed the Dodgers by going 38-6 in their last 44 games, making up a 10-game deficit. In fact, looking at streaks at any point in the season, we find three occurrences of 38-8 and six of 37-7. Clearly the accomplishments of the 1951 Giants in the last six weeks were extraordinary and their pennant victory should be acknowledged as such. The conventional characterization of this season as a Dodger collapse is much too simplistic, untrue, and unfair to the Giants.
Table 1: Winning Streaks and Hot Streaks over 44 games
(Click image to enlarge.)
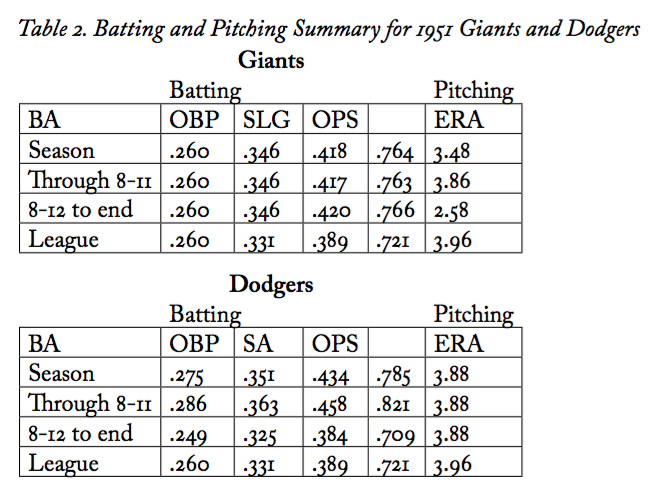
Look at the onslaught of the Giants in terms of a classic baseball question: Did they do it with pitching or with hitting? Of course, the object of the game is to outscore your opponent and a 9-8 win counts just as much as one that was 2-1, but it can be instructive to look a little more closely. Table 2 presents some basic batting and pitching data for the 1951 Giants, subdivided to separate the last 44 games.
Table 2. Batting and Pitching Summary for 1951 Giants and Dodgers
(Click image to enlarge.)
The consistency of the New York batting and Brooklyn pitching through the season is amazing. The Giants led the league in ERA and were tied for fourth in batting. On the other hand, the Dodgers led the league in batting by a wide margin and were fifth in ERA. However, the most striking features of this table are the huge drop in Dodger batting and the great improvement in Giant pitching in the last six weeks. During their 16-game winning streak, the New York pitchers compiled an ERA of 2.38. The Giants mounted another hot run at the very end of the year, winning 12 of their last 13, including the last seven straight. During these two weeks, when everything was on the line, their pitchers combined for a nearly unbelievable ERA of 1.63. Over the last seven games, the Giants, who won all seven, allowed only nine runs (six earned) and 55 hits, an average of 7.8 per game with an ERA of 0.86. Interestingly, both teams were on the road most of September; the Dodgers played nine in Brooklyn and 18 away while the Giants were home for only seven games and also had 18 away.
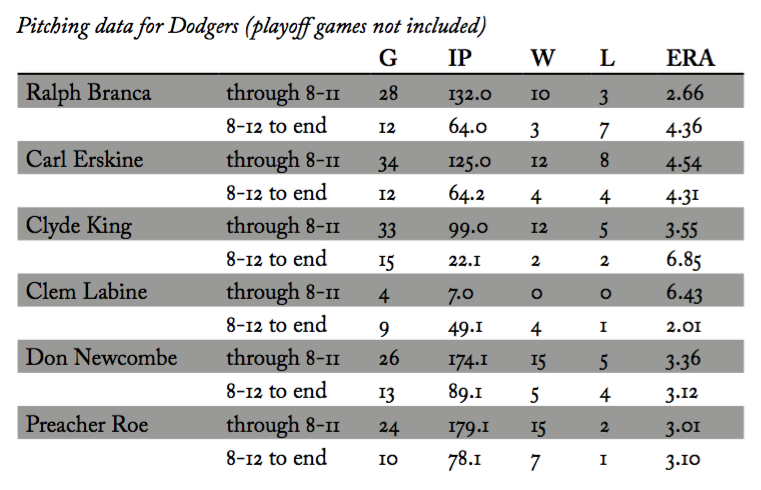
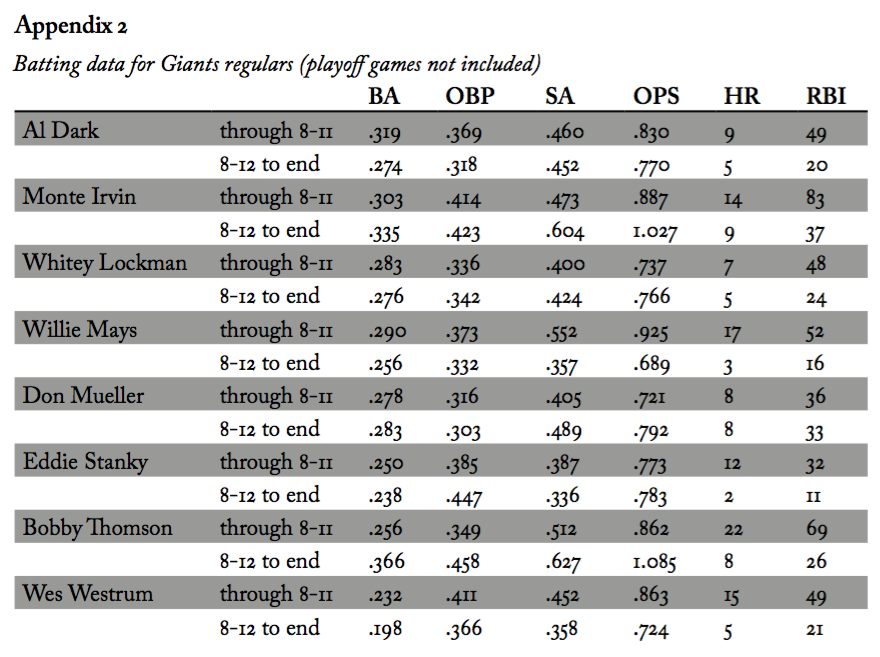
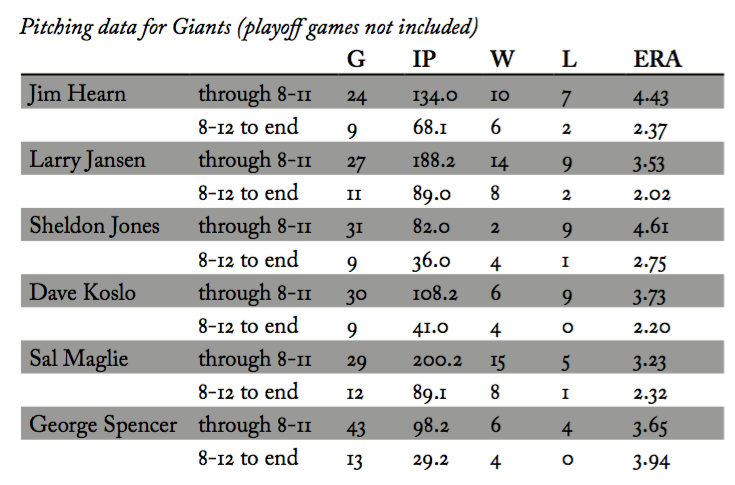
There were some striking individual performances, both good and bad, that contributed to these team numbers, of course. Appendix 1 gives some highlights and lowlights for regular batters and pitchers for the Dodgers and Appendix 2 does the same for the Giants. Carl Furillo, Pee Wee Reese, and Duke Snider all slumped in the stretch run. As much as it pains any longtime admirer of Duke Snider, one has to note that the poorest one-month showing for the Dodgers this year was turned in by their star center fielder in September. The Duke hit only one home run, batting .191 and slugging .255. For the Giants, the most striking batting difference was that of Bobby Thomson. The Staten Island Scot increased his batting, on-base, and slugging averages by over 100 points each and homered once in every 16.3 at-bats over the last 44 games.
On the pitching side the most significant decline for the Dodgers was by Branca, whose ERA increased by 1.70 at the end of the year. His won-lost record dropped from its peak of 10-3 on August 11 to 13-10 on September 30, although he did pitch two complete-game shutouts, the first on August 24, a three-hitter, followed by a two-hitter on August 27 with just two days’ rest. For the Giants the top five pitchers all showed great ERA improvement, with Jim Hearn bettering his mark by two runs.
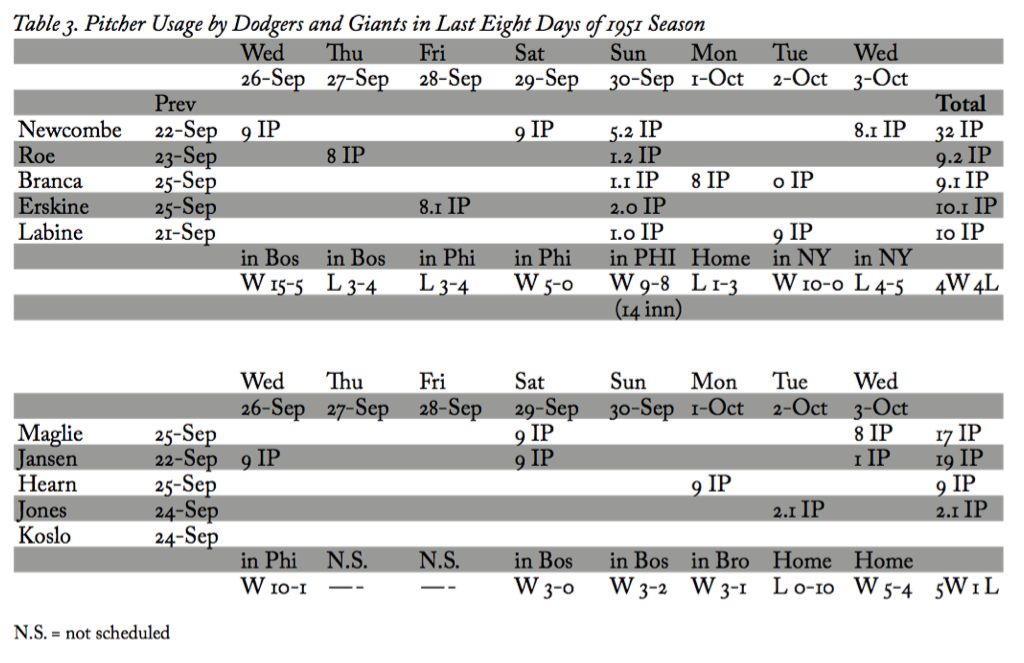
There is one other note on pitching and that is the pattern of using starters at the end of the year. Table 3 summarizes what Charlie Dressen of the Dodgers and Leo Durocher of the Giants did with their staffs in the last eight days of the season. The 32 innings pitched by Newcombe are amazing, especially the 5⅔ innings in relief on Sunday afternoon after tossing a complete game on Saturday night. The 1964 Phillies were another team that had interesting/questionable usage of starters, but what Newcombe did was even more extreme. As part of the real-world context of the game, when Newcombe left the final playoff game, he did not throw another pitch for the Dodgers until April of 1954, since he entered the Army in the winter of 1951.
Table 3. Pitcher Usage by Dodgers and Giants in Last Eight Days of 1951 Season
(Click image to enlarge.)
Finally there is the topic of sign-stealing. This is a rather old topic concerning the 1951 pennant race, but it received a major revival with Joshua Prager’s analysis in the Wall Street Journal and his book The Echoing Green.1 Prager detailed an elaborate scheme the Giants had supposedly devised to take advantage of the unique layout of the Polo Grounds. The clubhouses were in center field and the bullpens on the field against the wall in left and right. The catcher’s sign would be read by someone with binoculars in the clubhouse, usually coach Herman Franks, who would push a button that activated a buzzer in the Giants bullpen in right field. Someone on the bullpen bench, apparently reserve catcher Sal Yvars most of the time, would signal to the batter by tossing a ball in the air for a curve and remaining motionless for a fastball.
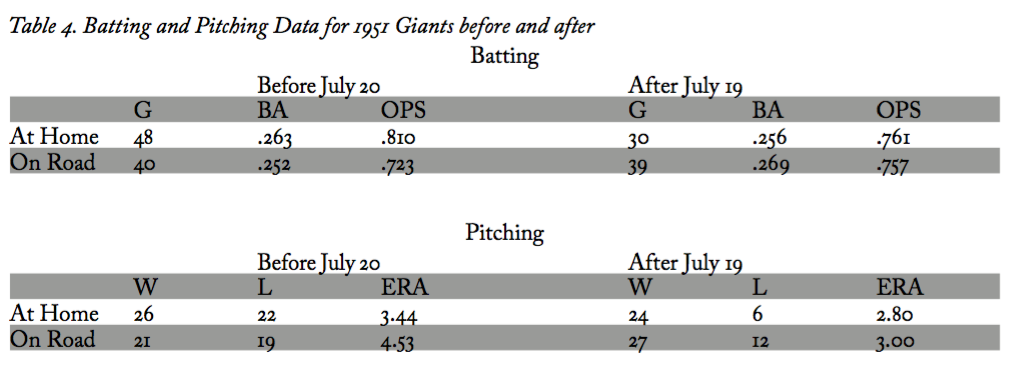
Prager conducted many interviews, did a lot of research and amassed substantial evidence that the Giants engaged in this practice and that it began on July 20, three weeks before they began their 16-game winning streak. One could look for evidence of the consequences of sign-stealing in the game records. If, as expected, there was an important benefit to the batters in knowing what pitch was coming, it should be reflected in the data. Some batters did improve, noticeably Bobby Thomson, but others did not. One should always be skeptical of small data sets, especially the performance of individual players. Therefore, we aggregated the data for all Giants players before and after July 20, both home and away, since they presumably were not stealing signs with the same efficiency on the road. These results are in Table 4.
Table 4. Batting and Pitching Data for 1951 Giants before and after July 19
(Click image to enlarge.)
The data seem striking, in that home batting performance declined after July 19, while that on the road improved. For pitching everything got better for the Giants after July 19, especially on the road, where the ERA improved by over a run and a half. Paul White of Baseball Weekly considered this information and wrote that it appears the most important signs in the Polo Grounds in the second half of the season were the ones the Giants’ catchers flashed to their pitchers.2
So, did the sign-stealing occur? Probably. Did it help? Apparently not. Of course, it only has to be true that the sign-stealing helped them win one more game that they would have lost in order to end up the season in a tie. The point is simple: There is no evidence in the data that sign-stealing was a significant factor in the great comeback of the 1951 Giants. Remember that the Giants’ record did not begin its dramatic improvement until August 12.
DAVID W. SMITH has been a SABR member since 1977 and is the founder of Retrosheet, a volunteer organization dedicated to the computerization and free distribution of play by play accounts of Major League games. The organization currently has data for nearly 170,000 of the approximately 189,000 games played since 1901. He is a winner of the Bob Davids Award, SABR’s highest honor, and the Henry Chadwick Award, which SABR confers on major researchers.
Notes
1 Joshua Prager. The Echoing Green: The Untold Story of Bobby Thomson, Ralph Branca and the Shot Heard Round the World (New York: Pantheon, 2006).
2 Paul White, “Giants stole the pennant? Perhaps not,” Baseball Weekly, March 20, 2001.
Appendix 1
Batting data for Dodgers regulars (playoff games not included)
Pitching data for Dodgers regulars (playoff games not included)
Appendix 2
Batting data for Giants regulars (playoff games not included)
Pitching data for Giants regulars (playoff games not included)
(Click images to enlarge.)


