Do Batters Learn During a Game?
This article was written by David W. Smith
This article was published in SABR 50 at 50
This article was originally published in SABR’s Baseball Research Journal, Vol. 34 (2005).
It is common to hear players, both batters and pitchers, comment on the value of being able to “make adjustments” during a game. For example, pitchers speak of “setting a batter up” by a certain sequence of pitches, which may take several at-bats to accomplish. Similarly, batters often remark that they “look for” a certain type of pitch or in a certain location after considering what the pitcher has thrown before. Although it makes sense that a player will alter his mental approach as a result of earlier success or failure, I decided to go beyond the anecdotal interviews and ask if there were any tangible evidence indicating that this learning actually takes place.
I analyzed every play of every game from 1984 through 1995, which is 24,823 games and more than 1.69 million at-bats. The play-by-play information, which comes from the Baseball Workshop in Philadelphia, is publicly available. In the very near future similar data will be available for earlier seasons from Retrosheet, the organization of which I am proud to be president. The analysis here is limited to matchups between starting batters and starting pitchers, thereby allowing the study of the maximum number of sequential encounters in a given game. Given the realities of modern relief pitcher usage, it is very uncommon for a batter to face the same relief pitcher more than once in a game, and therefore the relievers were excluded. The batting performance of pitchers was also removed.
The next question is how to evaluate performance so that we can make the comparisons in a meaningful way. I chose to calculate the three standard aggregate measures: batting average, on-base average, and slugging average. Sabermetric studies in the last two decades have made it clear that these three reflect different aspects of batter performance and I therefore suspected that they might not all show the same pattern of learning during a game. Table 1 presents the results for all games from 1984 to 1995.
TABLE 1: Batting by Number of Appearances. │ │ All games, both Leagues, 1984-1995
| PA | BA | OBP | SLG | |
|---|---|---|---|---|
| 1st | 419,870 | .259 | .327 | .391 |
| 2nd | 401,917 | .268 | .331 | .413 |
| 3rd | 313,880 | .272 | .334 | .422 |
| 4th | 90,994 | .276 | .338 | .422 |
In addition to noting how uncommon it is for a starting batter to face a starting pitcher four times in a game, we see clear patterns of improvement, or learning, in all three values as the game progresses. However, the three averages do not increase at the same rate. On base average rises slowly, only 3.4% from the first to fourth time at bat, while batting average and slugging average go up much more rapidly, 6.6% and 7.9% respectively.
Figure 1 (all figures are at the end of the paper) is the graphical version of the same data and shows some more subtle points. The most rapid change on the entire figure is in slugging average from the first to second time up. In the 1950s Branch Rickey and Allan Roth developed a measurement called “isolated power” to examine extra base hits separately from singles. Isolated power is simply the difference between slugging average and batting average. For all at-bats over the 12 years studied the isolated power is .134 (batting average of .260 and slugging average of .394; see Table 3). For the data in Figure 1, the isolated power values for the four times at bat are .132, .145, .150, and .146. My interpretation is:
- the first time up batters are more concerned with making contact than hitting with power and;
- the second and subsequent times up they are adjusting with the result that they are able to swing more confidently and with greater
Of course, we can’t lose sight of the possibility that pitchers are learning during these successive at-bats as well. However, the increases we see in Figure 1 indicate that in a relative sense the batters are ahead of the pitchers in their adjustments.
In an attempt to look for other factors controlling these numbers, I divided the games by league; these results are presented in Table 2.
TABLE 2: AL and NL Batting by Number of Appearances, 1984-1995
| AMERICAN LEAGUE | ||||
| PA | BA | OBP | SLG | |
| 1st | 234152 | .259 | .328 | .394 |
| 2nd | 222576 | .268 | .330 | .415 |
| 3rd | 173057 | .270 | .332 | .423 |
| 4th | 53727 | .274 | .339 | .424 |
| NATIONAL LEAGUE | ||||
| PA | BA | OBP | SLG | |
| 1st | 185718 | .259 | .325 | .388 |
| 2nd | 179341 | .269 | .331 | .410 |
| 3rd | 140823 | .274 | .336 | .422 |
| 4th | 37267 | .278 | .338 | .418 |
A quick glance shows that the two leagues are very similar in all three values, perhaps more so than might be expected, given the reputation of the American League as the more offensively minded. I would like to address this point with the small digression shown in Table 3.
TABLE 3: Correction for Effect of DH and pitchers, 1984-1995
| BA | OBP | SLG | |
|---|---|---|---|
| AL | .263 | .331 | .403 |
| NL | .256 | .321 | .383 |
| Total | .260 | .326 | .394 |
| AL DH | .257 | .335 | .419 |
| NL P | .142 | .176 | .178 |
| AL All-DH | .264 | .331 | .401 |
| NL All-P | .263 | .330 | .397 |
The top portion of this table shows that the AL has more offense by all three measures, confirming the conventional wisdom. The middle portion presents the data for the DH and for pitchers, with the expected huge difference. The bottom part of the table was derived by subtracting the DH from the AL values and the pitchers from the NL data. The results show very close agreement, perhaps surprisingly so, between the two leagues. In fact, comparing the NL with pitchers removed to the entire AL with the DH included gives even closer agreement. My conclusion on this point is that essentially all the difference in offense between the two leagues is accounted for by the DH.
Back to the main point, let’s look at the league differences graphically, as is done in Figure 2 which presents the data from Table 2. Although there are some differences between the leagues, it is clear that they are quite similar.
The next idea I had for subdividing the results was by home and road team, as presented in Table 4. To my surprise, there are rather large differences between the two, both in absolute value of the numbers and in the pattern of changes. The home team has an overall seven-point superiority in all three of the measures used here, as shown in the bottom portion of Table 4. However, the greatest differences are in the pattern of the changes, as shown in Figure 3, which comes from the data in the first two portions of Table 4.
TABLE 4: Home and Road Batting by Number of Appearances, 1984-1995
| Home Games | ||||
| PA | BA | OBP | SLG | |
| 1st | 209837 | .265 | .335 | .401 |
| 2nd | 200459 | .272 | .336 | .421 |
| 3rd | 153111 | .276 | .340 | .431 |
| 4th | 40051 | .276 | .341 | .424 |
| Road Games | ||||
| PA | BA | OBP | SLG | |
| 1st | 210033 | .253 | .318 | .382 |
| 2nd | 201458 | .265 | .325 | .404 |
| 3rd | 160769 | .268 | .328 | .414 |
| 4th | 50943 | .275 | .337 | .420 |
| All Appearances | ||||
| BA | OBP | SLG | ||
| Home | .263 | .333 | .401 | |
| Road | .256 | .320 | .386 | |
| All | .260 | .326 | .394 |
In all three parameters, the rates of increase are steeper for players on the visiting team than they are for those who are playing at home. In fact, slugging average for the home players actually drops from the third to fourth time at bat. By the fourth time at-bat, the home and road players are almost identical. This pattern is initially surprising, since it is not obvious why the road-team batters should display so much more learning than the home-team batters. However, we must remember that there are two sides to each matchup and consider the pitchers as well.
One of the great differences usually identified between different parks is the mound and it is common to hear visiting pitchers comment that it takes time to adjust. Therefore, it is reasonable to consider that there are two kinds of learning going on. The first is the mental part of the pitcher-batter confrontation, which we have seen to favor the batter, and the second is the physical adjustment by the pitcher to the mound. Presumably the home team pitchers are more familiar with the mound than the road team pitchers are and they should have less of this adjustment to do.
Let us consider the home vs road differences again, remembering that the home and road batters end up with very similar performances. By this argument, the learning displayed by the road-team batters would therefore result mostly from the mental aspects, since the home team pitchers are not affected as much by the mound.
On the other hand, the road-team pitchers are starting the game at a relative disadvantage as they deal with the idiosyncrasies of that particular mound. Therefore, the performance by home-team batters starts off at a higher level, but does not increase as rapidly, because there is less room for improvement before they reach the maximum in the fourth time up. However, it must be true that the road-team pitchers have been successful in their adjustments, or else one would expect that the performance by home-team batters would continue beyond what is actually observed.
There is one additional factor which might affect the batters, and that is the nature of the hitting background. Although the center-field background does vary between parks, there is much less variation here than there is in the mound. One way to examine the effect of the hitting background would be to compare the performance of road-team batters in the first game of each series to the later games in the series. If the background were a significant factor, then one would expect the first game performance to be different. I did not subdivide the results in this way, so this possibility remains unexplored.
Until last Saturday, these were all the ways I had thought of dissecting the data. However, that afternoon I received a call from Jerry Crasnick, who is a sportswriter with the Denver Post. Jerry was calling to discuss my research on the effect of artificial surface, which I presented at last year’s SABR meeting, but during our conversation I mentioned my topic for this year. Jerry told me he had discussed this very subject with Craig Biggio of the Houston Astros and that Craig was firmly convinced that the physical demands of the position cause catchers to pay a huge offensive price.
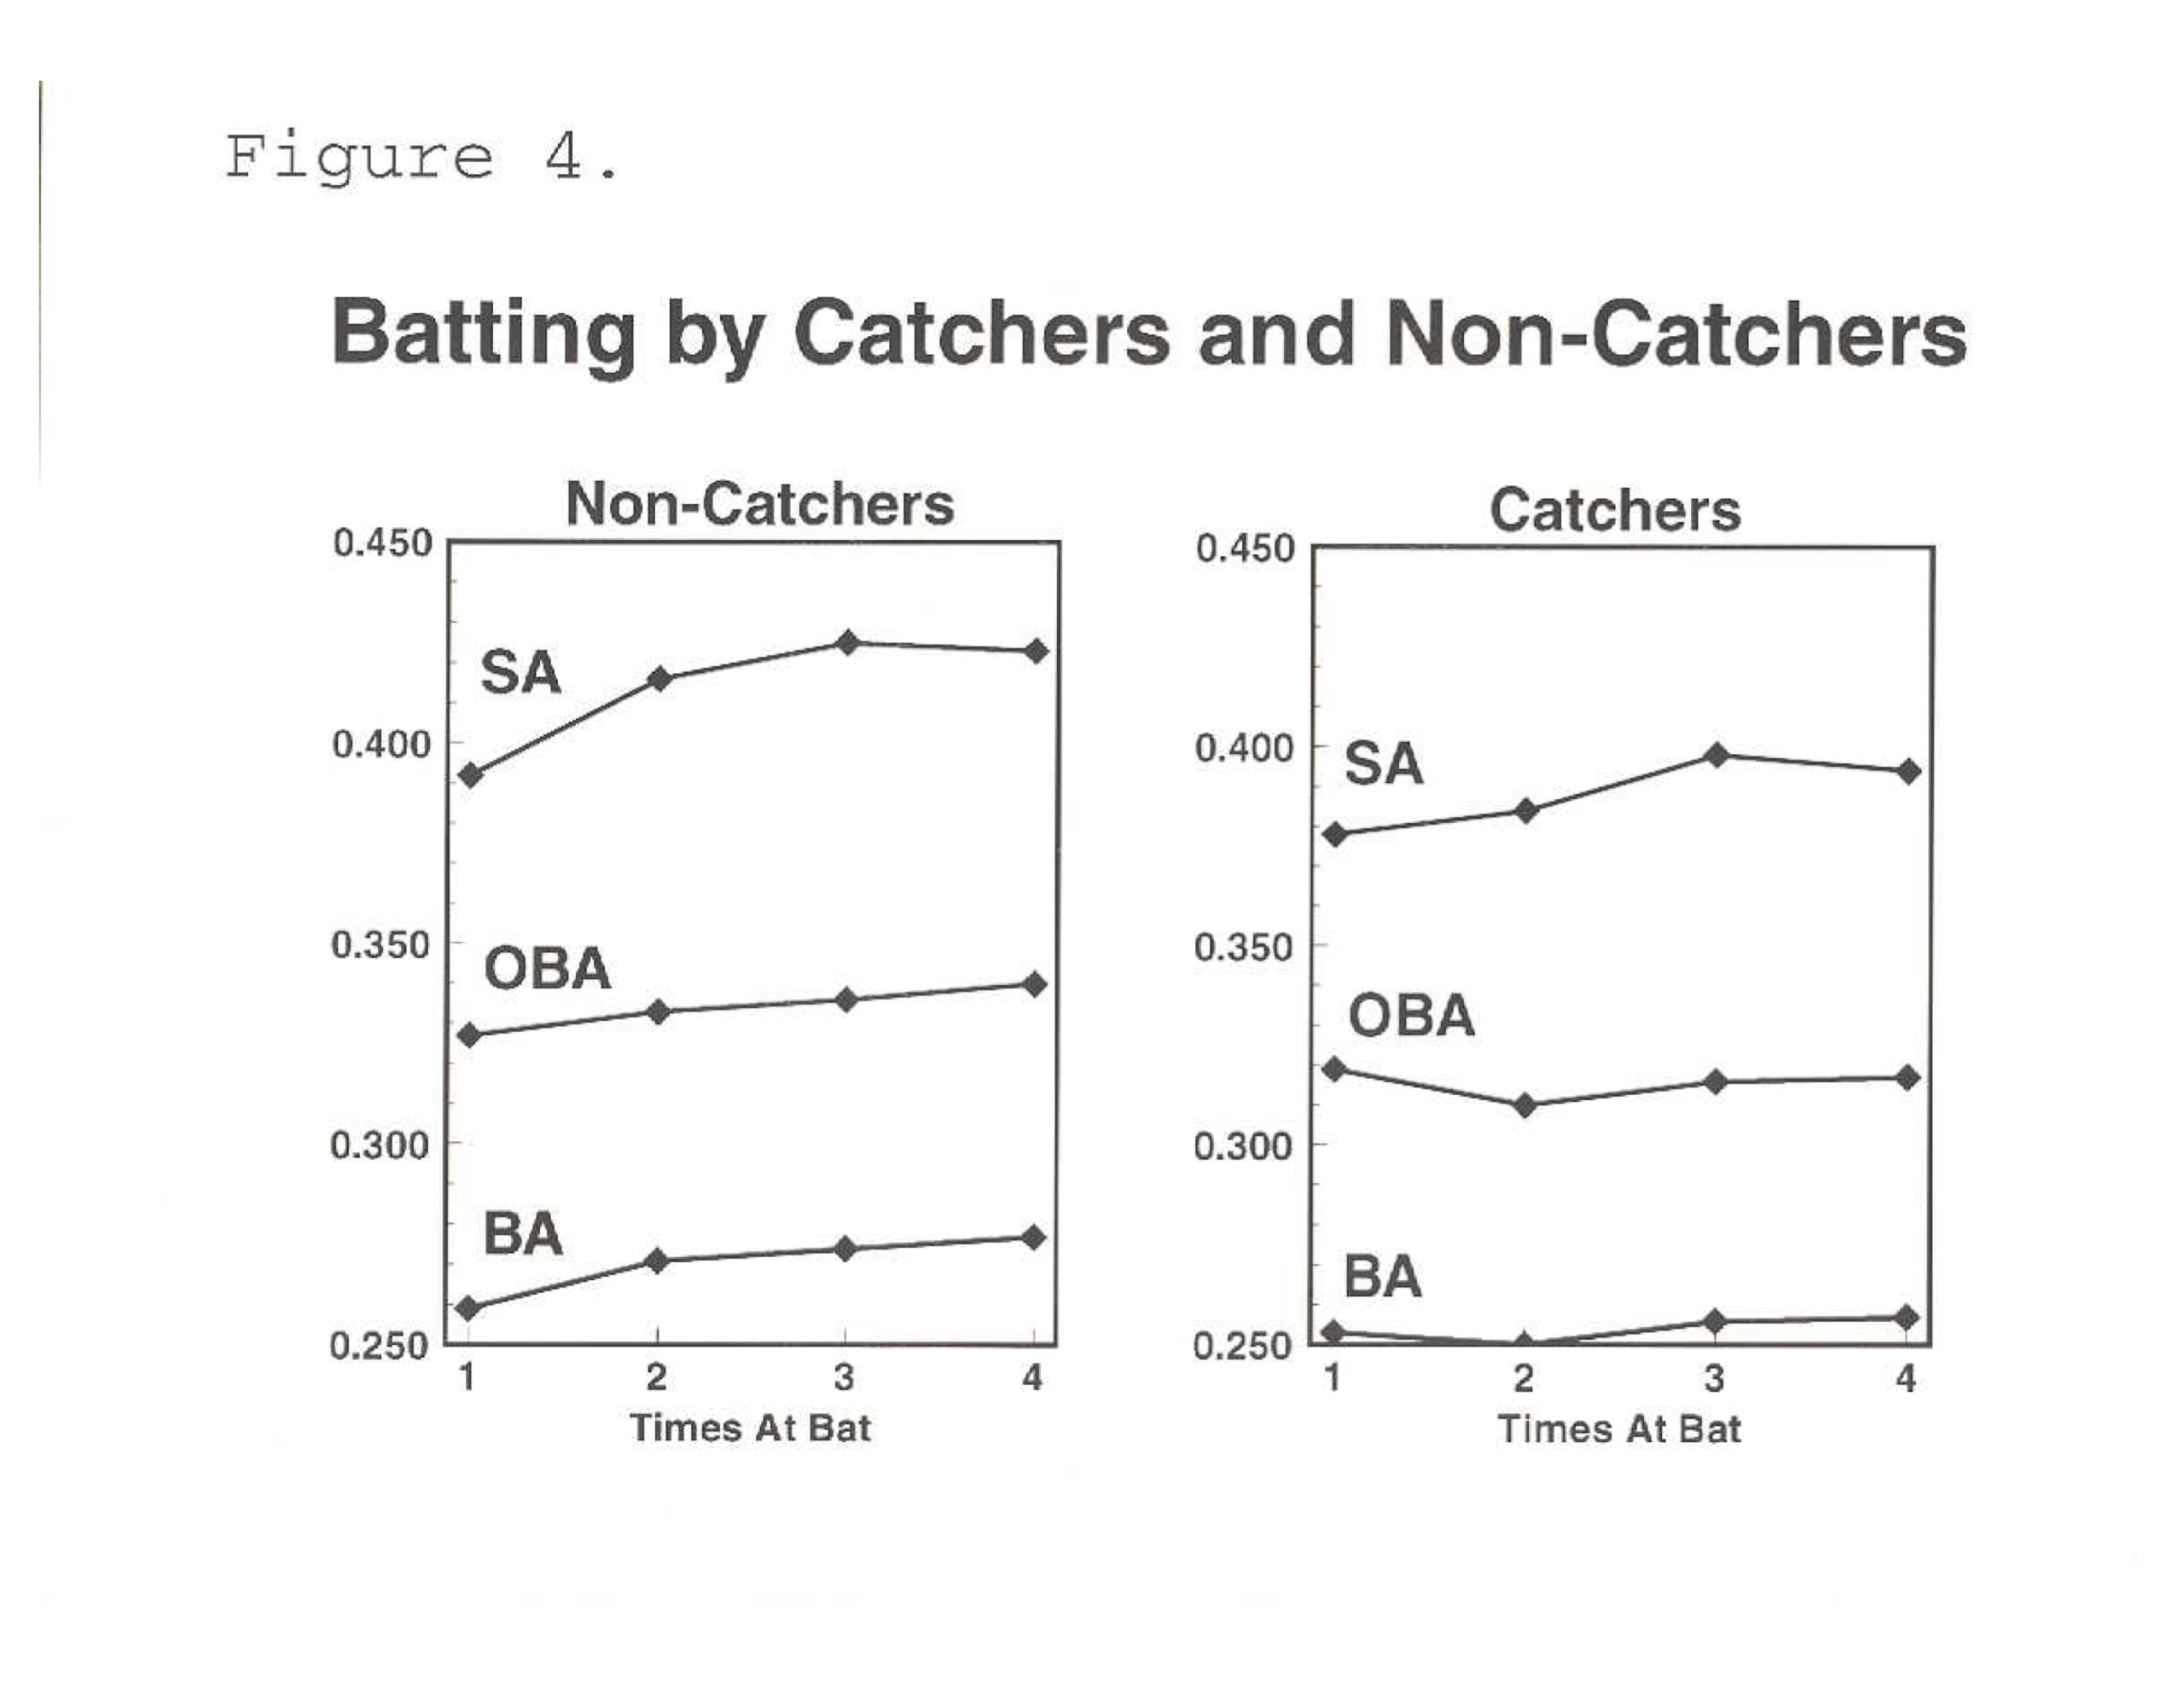
The essence of Craig’s comment was that he was “toast” his last time up. Of course, I was immediately inspired to check out this assertion and I reran my programs to record the batting events of catchers separately from those non-catchers. The results are in Table 5, where even a quick glance shows that the patterns for catchers are quite different. The overall totals are lower, which is no surprise, but what strikes me is the very slight increases by the catchers during the game compared to the other batters.
TABLE 5: Effect of Being the Catcher on Batting by Number of Appearances
| All Batters Except Catchers | ||||
| PA | BA | OBP | SLG | |
| 1st | 395352 | .259 | .327 | .392 |
| 2nd | 355861 | .271 | .333 | .416 |
| 3rd | 282489 | .274 | .336 | .425 |
| 4th | 86237 | .277 | .340 | .423 |
| Catchers | ||||
| PA | BA | OBP | SLG | |
| 1st | 24518 | .253 | .319 | .378 |
| 2nd | 46056 | .250 | .310 | .384 |
| 3rd | 31391 | .256 | .316 | .398 |
| 4th | 4757 | .257 | .317 | .394 |
In fact there are some noticeable decreases in batting average and on-base average between at-bats one and two for the catchers. Over the four plate appearances, catcher batting averages rise only slightly and on-base average actually declines. Slugging average shows the overall increase we have seen all along, but to a lesser degree. Figure 4 shows the same information, where the patterns stand out even more clearly.
Do these results support the idea that catchers are damaged later in the game? In an absolute sense, it appears the answer is no, but compared to other players the answer is clearly yes. What do these results have to do with learning? Assuming that catchers can make adjustments as well as other players, then it appears that their learning as batters is largely overcome by the physical demands of playing behind the plate.
Before I give my conclusion, there is one more point that must be made, which is to note that I presented no information for individual teams or players. It is always true in a study such as this that the results get less clear as the sample size gets smaller. I therefore made the large divisions of league, home vs. road, and fielding position. When the results are divided more finely, to single teams or single batters, there will inevitably be many exceptions that cloud the issue, largely because of their statistical unreliability. I have chosen to avoid this confusion.
In conclusion I note that I began this study with the question that is the title of the presentation: Do Batters Learn During a Game? It is clear that the general answer is: yes, they do. However, it is also clear that the situation is a little more complicated than that and that a better understanding can be obtained by considering other factors, the two biggest of which are the effect of playing at home vs. on the road and of being the catcher.
So the next time you hear a batter say that he improved his performance by making adjustments during a game, there is a good chance you should believe it. On the other hand, if you hear a pitcher say it, then you might be a little suspicious.
DAVID W. SMITH received SABR’s highest honor, the Bob Davids Award, in 2005. He is the founder and President of Retrosheet.
Figure 1
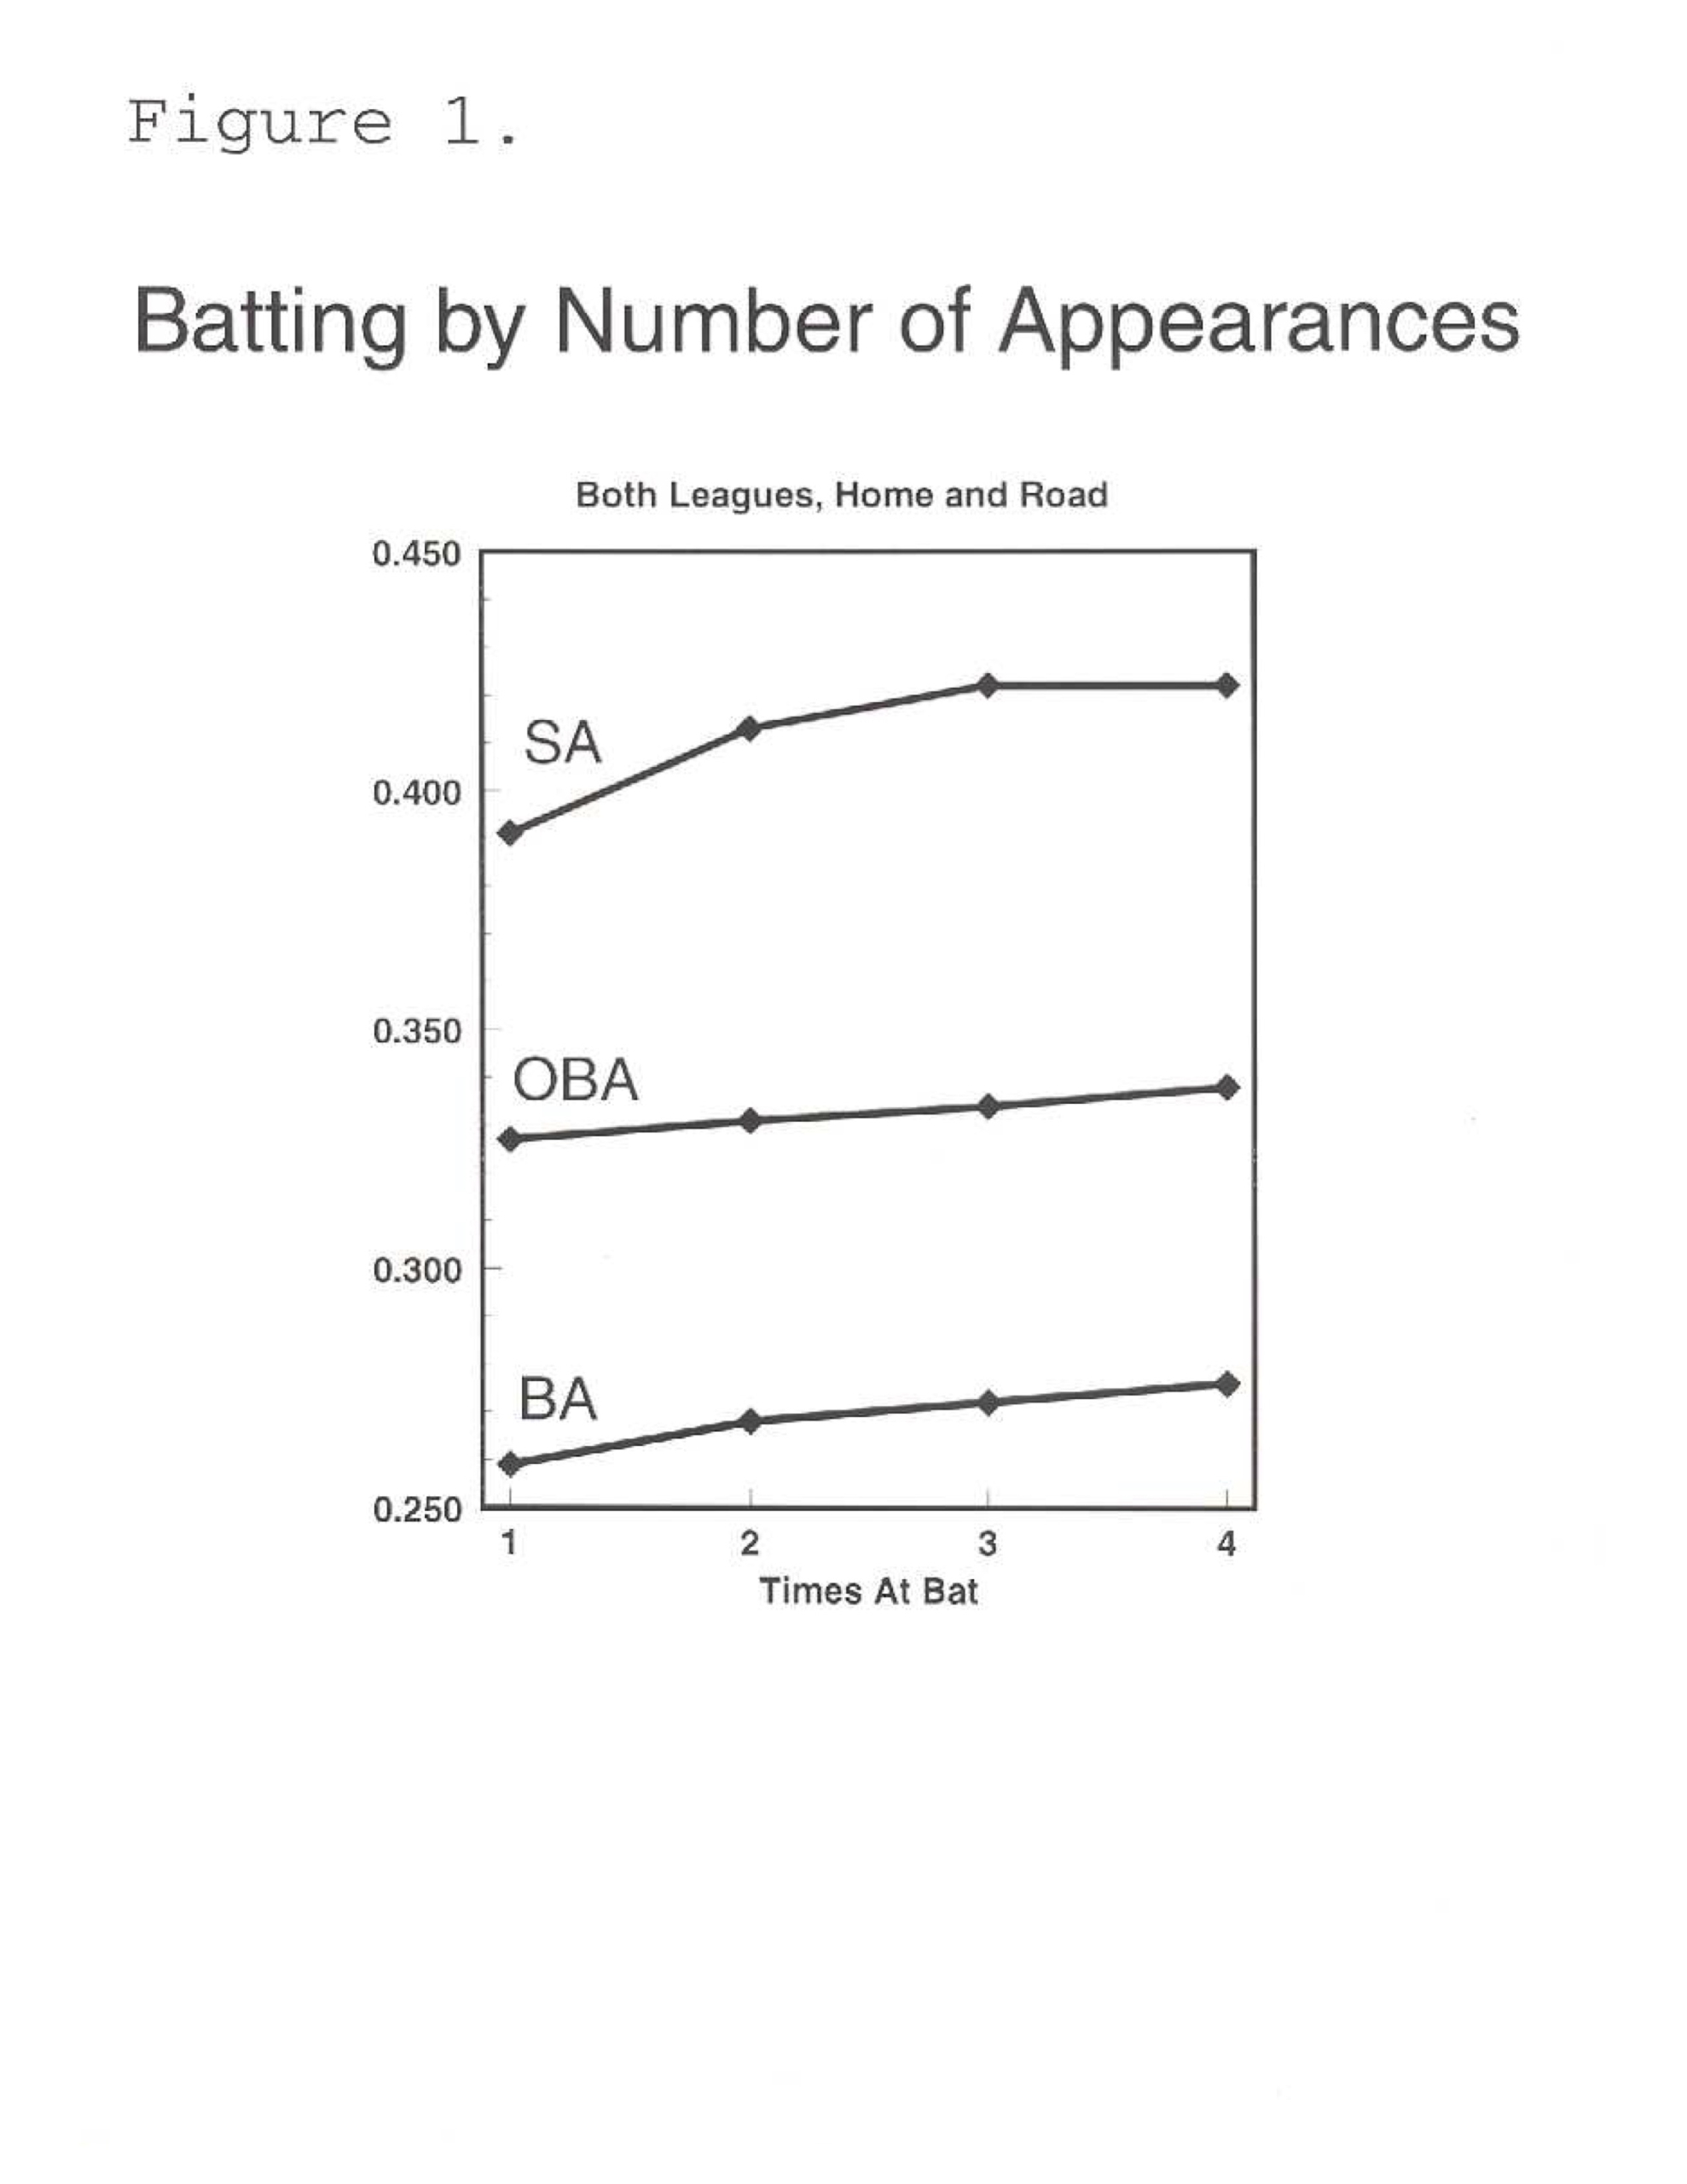
Figure 2
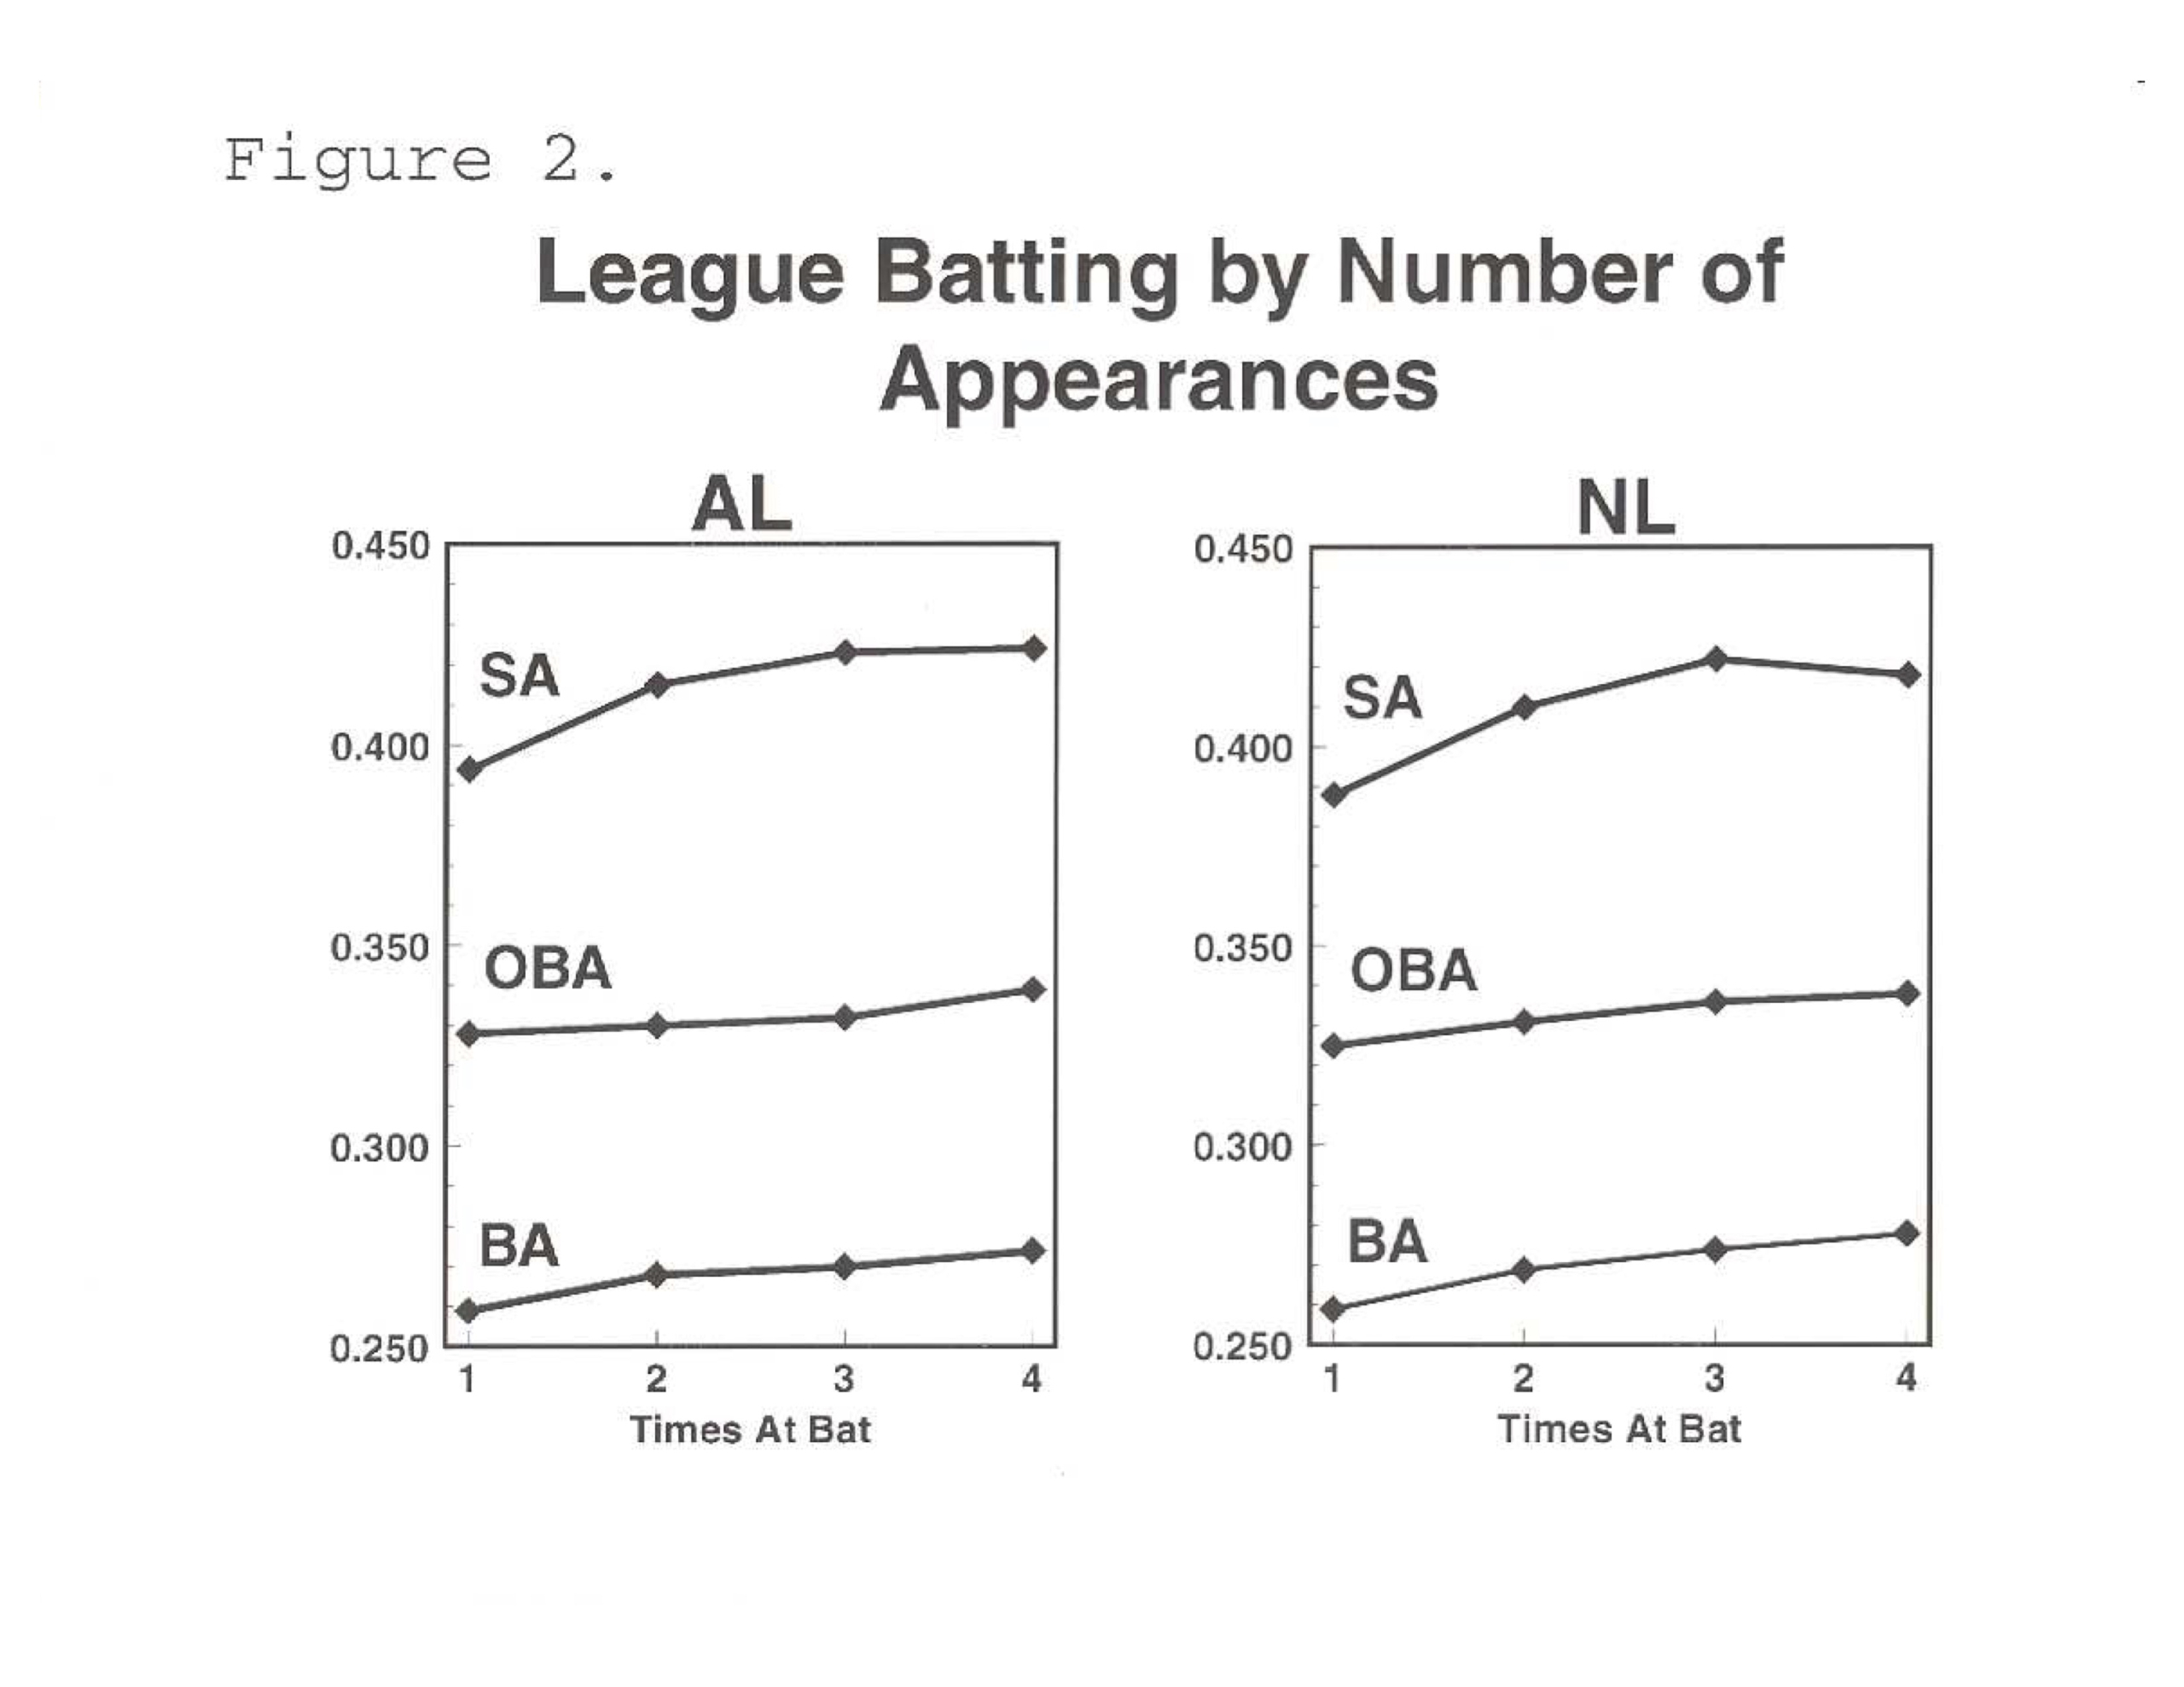
Figure 3
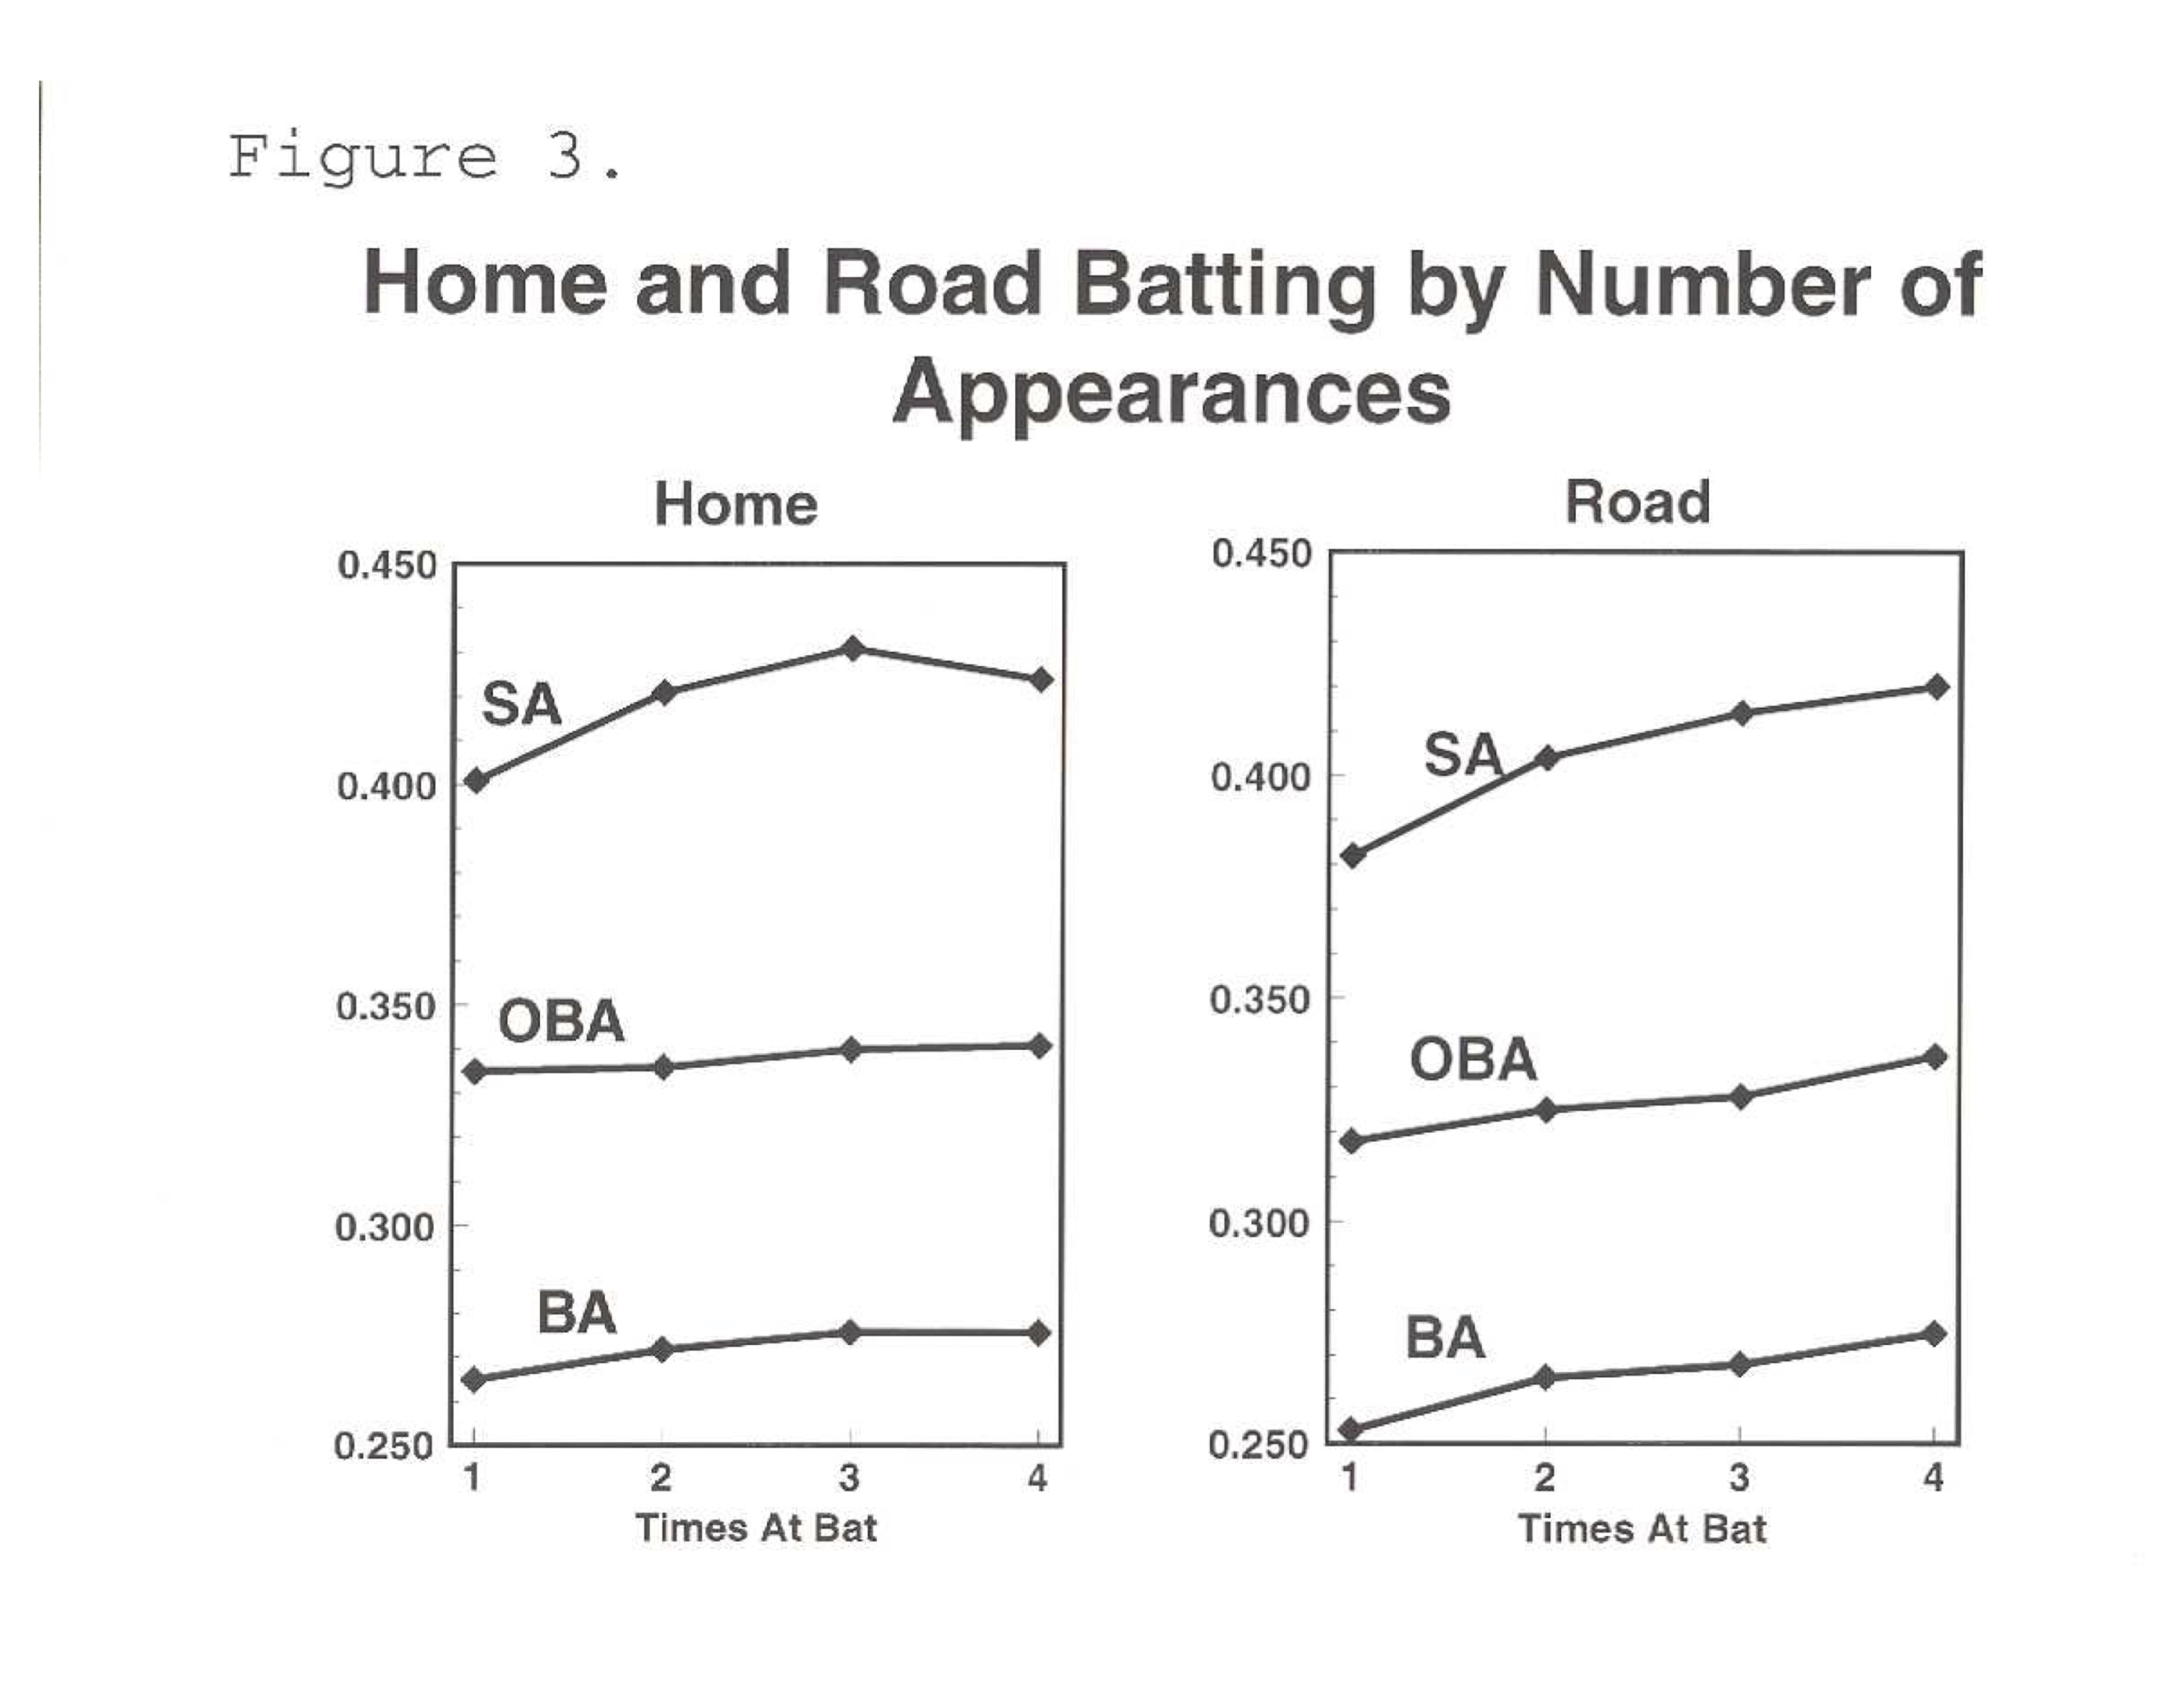
Figure 4