

Do Players Outperform in a Walk Season?
This article was written by Phil Birnbaum
This article was published in 2006 Baseball Research Journal
Do players perform better in their walk year? Conventional wisdom would say they do perform better in the year before they become free agents, at least according to the stereotype of the greedy player, who will put out extra effort only when he will be rewarded financially. Traditional economic theory agrees. Like all rational economic actors, baseball players should produce more of a product when the going price rises.
Take infielder Bret Boone, for example. From 1992 to 2000, the second baseman never hit more than 24 home runs or drove in more than 95 runs. In 2000, he hit only .251. But in 2001, the season before free agency, Boone set new highs in all three categories, going 37–141-.331 and finished third in the American League MVP voting.
It could be argued that Boone, realizing a good 2001 season could be worth millions of dollars on the free-agent market, decided to turn it on a bit and have a career year. That got him a raise of 146%, from $3.25 million to $8 million for 2002.
However, there’s also the case of David Cone. Cone’s last year as a Yankee was 2000, and you’d predict a good season ahead of his being shopped around for 2001. But Cone was horrible; he took a pay cut from $12,000,000 down to $1,000,000 and signed with the Red Sox for 2001, where he had a reasonable season. But, clearly, his off-year in 2000 cost him a great deal of money.
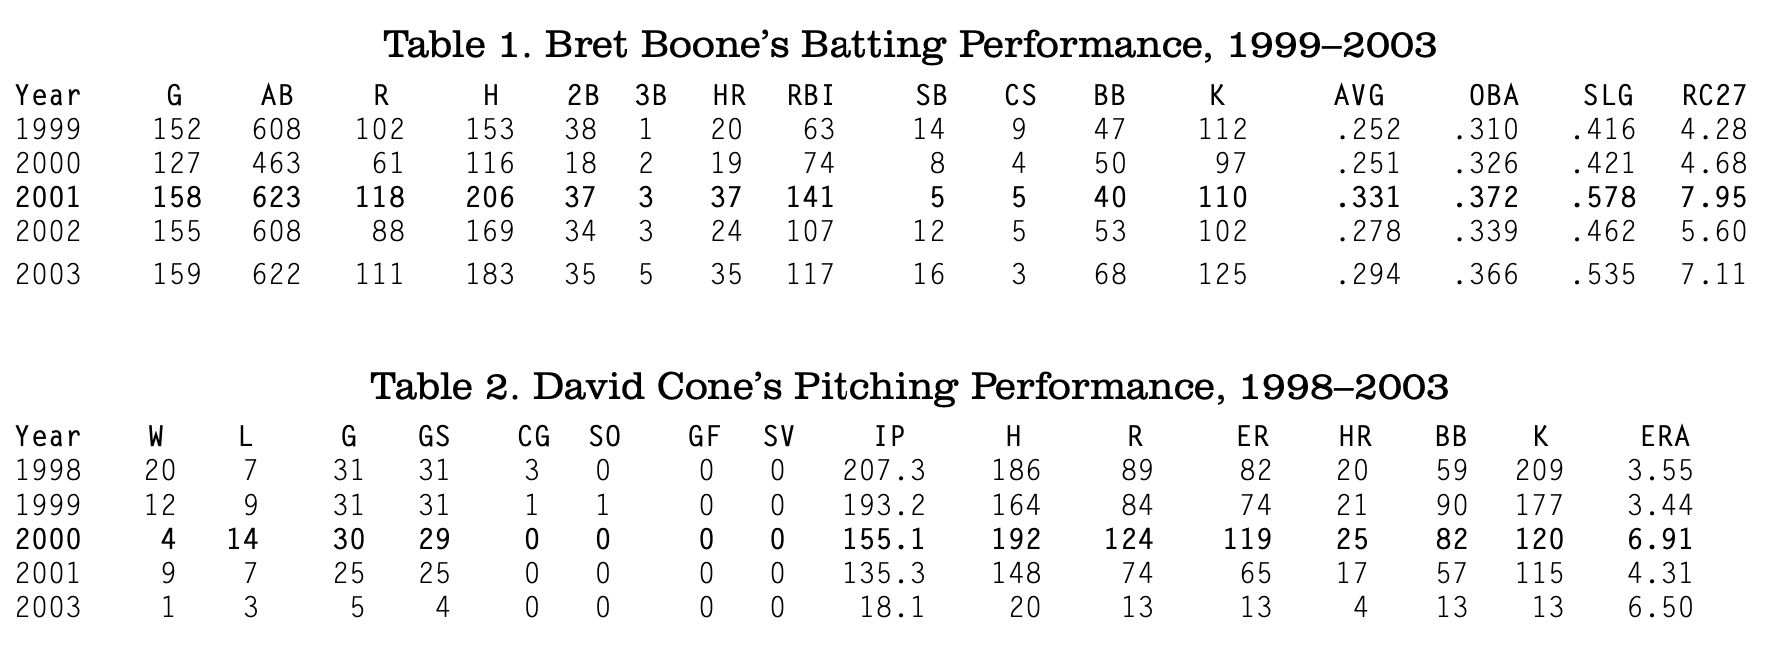
(Click image to enlarge)
For every Bret Boone, who appears to turn it on his free-agent year, there’s a David Cone, who collapses. To decide if there really is a free-agent effect, it’s not enough to list specific cases—we need a systematic study.
Here’s what I did. For every MLB free agent up to and including the end of 2001, I used an algorithm to predict how the player “should” have done based on historical trends. I then compared his actual performance to his prediction. If there is a tendency to outperform with free agency impending, the group of free agents should do better than their predictions overall, notwithstanding an occasional David Cone.
The Algorithm
The prediction algorithm is a modified version of the one I wrote about in the 2005 BRJ (“Which Great Teams Were Just Lucky?”); I tweaked it to be a bit more accurate for older players, since free agents tend to be from that group, and also to be more accurate for starting pitchers. The algorithm looks at the four years surrounding the given year, and tries to predict what the player should have done. It should be reasonably close to what you would guess just by eyeing the player’s record.1
For instance, here’s (non-free agent) random player X from 1976–1980. The statistic shown is “Runs Created per 27 outs,” which estimates how many runs a team of nine of this same player would score in a game.
| Player X | RC/27 |
|---|---|
| 1976 | 4.76 |
| 1977 | 6.27 |
| 1978 | ??? |
| 1979 | 8.95 |
| 1980 | 4.28 |
What would you expect for 1978? It looks like the average for the surrounding years is about 6.00, but the years closer to 1978 were a bit better . . . so the weighted average is maybe 6.75 or 7. A player is usually a bit closer to average than his stats suggest, so regressing that to the mean a bit gives maybe 6.25 or 6.5.
The algorithm comes up with 6.52. The player—Sixto Lezcano—was actually 6.57 for 1978, almost exactly what you would fill in. That is not all that common; players often surprise, as we saw with David Cone and Bret Boone. And Lezcano himself wasn’t all that consistent in the surrounding years.
So Lezcano overachieved in 1978 by 0.05 runs per game. That works out to 0.4 runs for the season, which rounds down to zero. Zero is rare; a typical value for a full-time player would be ten runs or so, either way.
Using this algorithm, we calculate Bret Boone was +40 runs in 2001. David Cone was minus 39 runs in 2000. They’re both extreme cases, and they pretty much cancel each other out.
The Results: Hitters
So what happens when we run the algorithm, not just for Cone and Boone, but for every free agent? We’ll start with the hitters.
There were 399 free-agent hitters between 1977 and 2001 with at least 300 batting outs (AB-H) in the season before becoming a free agent. To put them on the same scale, I adjusted each player to exactly 400 batting outs, and checked their performance.
Overall, they exceeded their expectation by 2.3 runs. It looks like there may be an effect, albeit a small one. However, the algorithm isn’t accurate enough to say for sure whether the 2.3 runs is significant.
So we have to do a comparison. Taking the 3,692 players who weren’t free agents, they also exceeded their expectation, by 1.1 runs:
# of hitters performance vs expected (runs)
- Free agent hitters: 399, +2.3
- All other hitters: 3692, +1.1
If there is a free-agent effect, it’s only 1.2 runs per year—less the equivalent of turning one out into a triple. When pundits talk about greedy players putting out effort only when there’s money on the line, they’re certainly talking about more than one triple per year.
And the result is not statistically significant. The standard deviation of the difference between the two groups is about .75, so there is about an 11% probability that even if there were no effect, we would see a result this big (in either direction) by chance alone.
As stated, the estimate algorithm isn’t perfect, so there could be some kind of bias causing these results. The most obvious is that it might overestimate older players and underestimate younger players. Since free agents tend to be older, that would cause the effect we’re seeing here.
To check that, I checked only non-free agent hitters who were 29 or older (as of June 30 in their free-agent year):
- Non-free-agent hitters age 29+: 1892, +0.8
So the difference rises from 1.2 runs to 1.4 runs—still not very much.
The Results: Pitchers
I took all free agents-to-be who started at least 20 games their free-agent season, and normalized them to 200 innings. The results were surprising:
- Free Agent starters: 239, -4.1
- All other starters: 2223, +0.5
- All other starters age 29+: 1039, +0.7
There’s a definite effect here, but it goes the wrong way; pitchers about to become free agents actually did worse than others! It could be that free agency makes pitchers less effective; perhaps they overthrow or something. But there are more plausible explanations, which I’ll discuss below.
The difference between the two groups is about 4.5 runs per 200 innings, or a difference of about .19 in ERA. In one sense, that’s not much. But over such a large group of pitchers, it’s very unlikely to have occurred by chance. Further investigation into this group of players might be worthwhile.
Arbitration
Another common theory is that players who lose arbitration cases wind up underperforming, out of anger at perceived mistreatment by management. Under a version of this hypothesis, happy players who win arbitration cases should outperform those unhappy players who lose.
I checked these groups the same way as the free agents, up to 1996. Here are the results for batters:
- No Arbitration: 3877, +1.20
- Won: 46, -0.53
- Lost: 67, +0.34
And for starting pitchers:
- No Arbitration: 1917, +1.85
- Won: 32, -1.46
- Lost: 34, -1.02
There is no significant difference among any of the groups. The largest difference, 3.32 runs between the “no arbitration” pitchers and the losing pitchers, is not statistically significant.
Biases
There are a few possible biases to this study that may have affected the results.
The most important one, perhaps, is the “option year” problem. Often, a contract will provide for an option year, where the team has the choice of either keeping the player or letting him become a free agent. Since teams are more likely to keep a player who just had a good year, this would mean that players having off-years would be over-represented in the free-agent pool, which would appear to have lowered their performance relative to expectations.
Theoretically, this bias could explain the findings for pitchers, in which free-agent pitchers retrospectively performed more poorly than expected. The good pitchers may have been removed from consideration by the exercise of the team’s option, biasing the sample downward.
Of course, the same would apply to batters; if that is the case, then there might be a larger free- agent effect for batters than the study indicated. And so a good update to this study would be to include these option players along with the free agents, since the motivation issues affecting free-agent performance would apply equally to these players.
Another bias, one that goes the opposite way, is that players who have especially poor free-agent years are somewhat more likely to retire. Since this study didn’t include retired players, that would bias the free-agent pool in the upward direction, which means that any positive free-agent effect would be increased by the retirement effect.
A third bias, which would also amplify any positive results, is that players having a bad free- agent year would likely be benched, and would therefore fail to meet the playing time requirements (20 starts or 300 batting outs) of this study. Again, this means that players having good years are more likely to be considered, which would again bias the results in a positive direction.
So there is one source of bias that would tend to bring the observed free-agent effect down, and two others that would bring it up. More study would be worthwhile—but, in any case, there is no evidence so far for any “greed” effect motivating free agents.
PHIL BIRNBAUM is editor of By the Numbers, SABR’s statistical analysis newsletter. A native of Toronto, he now lives in Ottawa, where he works as a software developer.
Previous Studies
The most recent similar study on this question appeared in Baseball Prospectus’s 2006 book Baseball Between the Numbers. There, Dayn Perry found a much larger effect—five runs instead of the one or two runs found here. However, Perry used a non-random sample of “prominent” free agents. Players who figure prominently may be those who were more likely to have had notable years, and this may have biased the sample upward.
An academic study by Evan C. Holden and Paul M. Sommers,“The Influence of Free-Agent Filing on MLB Player Performance,” found no free-agent year effect. It did, however, find that performance declined the year after the contract was signed. However, since free agents tend to be older players more likely to be in their declining phase, this might simply be a case of the normal effects of player aging.
In “Shirking or Stochastic Productivity in Major League Baseball?” Anthony Krautmann checked all free agents signing five-year contracts between 1976 and 1983. He counted the number of players with outlying performances, and found only the expected number, which means no evidence of the free-agent year effect.
Benjamin Grad, in his study “A Test of Additional Effort Expenditure in the ‘Walk Year’ for Major League Baseball Players,” regressed player performance on a group of variables, including one representing whether the player was in his free-agent year. He found no effect for that variable.
In a poster presentation at the 2006 SABR convention in Seattle, Allison Binns ran a regression on players’ career performance vs. age, including a dummy variable to represent the season following an arbitration hearing. She found that in that season, a hitter’s OPS dropped by an average .040. That’s a very large difference, about seven runs for a player with 500 PA. Binns also found a similar effect for pitchers. Both effects were statistically significant.
Notes
Statistics are from Total Baseball (8th ed.); data on free agency is from Retrosheet; data on arbitration is from SABR’s Business of Baseball committee.
Details on the algorithm can be found at www.philbirnbaum.com/algorithm.txt.