

Does Experience Help in the Postseason?
This article was written by Tom Hanrahan
This article was published in 2002 Baseball Research Journal
Do baseball players fare better in the post-season when they have post-season experience behind them? My research says the answer is a clear no. Managers’ efforts to build teams with players who “have been there before” appear to be fruitless ventures, sacrificing money and possibly quality for no apparent gain.
MEASURING POST-SEASON EXPERIENCE
Common baseball wisdom says that one factor in achieving post-season success is having post-season experience. The thinking is that because the World Series is such a unique event, those players who have not been there before are more likely to fall victim to nervousness, lack of confidence, or other conditions that would adversely affect their play. This sounds like a reasonable theory. The success of the Yankees in recent post-season play would be one piece of positive evidence, but then this last World Series had young Lackeys and Rodriguezes all over it.
The big question is: How do we tell if the theory is true? We could analyze by team or individual success. From a team standpoint, we could compare the winning percentage of teams who have played in the playoffs more recently than their opponents. A difficulty with this method would be controlling for the quality of the team, particularly the different mix of players from year to year. So I chose to focus on individual performance. The obvious decision here is looking at hitters or pitchers. Here I determined that using pitchers would be a better choice, for many reasons:
1. Ease of choosing a measuring stick. For batters, we can use some standard measure such as OPS, but in a short series, clutch hitting can be more important than overall performance. So one could easily argue that runs and RBI, broken down into game situations, are the best measure. For pitchers, ERA seems to be the obvious best measure, and it is easy to obtain.
2. Sample size. In a playoff series, starting pitchers often face 70 batters or more. Hitters rarely get more than 30 plate appearances in series of seven or fewer games.
3. Pressure. I decided to use pitchers who started games. A pitcher named by his manager to take the mound is obviously the focal point on the field for his team that day (exception: 2002 version of Barry Bonds).
SELECTING THE DATA
The post-season has changed over the years: from a single World Series to two, and now three, sets of playoffs. Because of the difficulty in defining “post-season pressure” or “experience” with mixed sets, I decided to use only pitchers who started World Series games, and whose first World Series start was prior to 1969, the year that divisions were created. This yielded 65+ years of World Series play.
I created two sets of data for each pitcher. The data from “experienced” hurlers were those innings thrown by pitchers who made at least one start in their first World Series appearance. In other words, if a pitcher first appeared in a World Series as a reliever only, he was ineligible; this was done so I did not have to decide whether a relief appearance counted as “experience.” Then I used his combined total of all other World Series innings as “experienced” data, as long as he made at least one more start in a succeeding World Series. Pitchers who did not start any games in any successive World Series were again not used.
I was surprised when collecting the data that there are many discrepancies among sources for pitchers’ ERAs in the early part of the century. I eventually chose the baseball1.com database as my standard reference.
THE RESULTS
This method yielded 97 pitchers who combined for 3,710 innings pitched in World Series play. Fifty-four pitchers (56%) had a lower ERA in their initial Series appearance than in future games. Forty-two pitched better when they were experienced in Series play. One had identical ERAs: Dutch Leonard threw 9 innings of one-run ball in both cases. Raw data totals:
| First WS | Future WS | |||
| IP | ERA | IP | ERA | ERA DIFFERENCE |
| 1213 | 2.69 | 2497 | 2.97 |
+0.28 |
Possibly a more accurate way of determining the “experience effect” would be to create matched sets of data rather than combining all of the data into one pool. As an example, suppose the entire data set consisted of only two pitchers. Their mythical totals are listed below:
| First WS | Future WS | ||||
| PITCHER | IP | ERA | IP | ERA | ERA DIFFERENCE |
| A | 5 | 2.00 | 25 | 3.60 | +1.60 |
| B | 25 | 4.00 | 5 | 4.00 | 0.00 |
| A+B | 30 | 3.67 | 30 | 3.67 | 0.00(!) |
Pitcher A was much worse in future games, B was the same, yet overall, there is no difference! This is because of the disparity in innings and in performance. Pitcher A was better overall, or possibly pitched in an era when it more difficult to score runs. Clearly, it is possible that in the instance above, one could interpret the combined results to say that the pitchers were better in their initial World Series appearances.
To combat this situation, I created matched sets of data for each pitcher, weighting the difference in ERA by how many innings each pitcher threw. I used the harmonic. mean of each pitcher’s first and future innings as the weight for each pair. The data for the first three pitchers is alphabetically listed in Table 1.
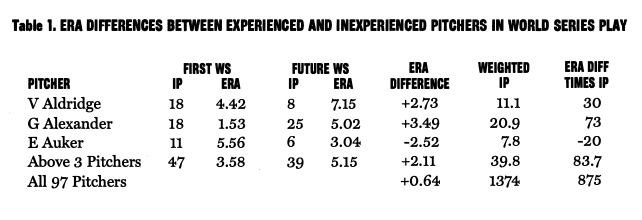
Grover (Pete) Alexander’s weighted IP are found by 2 / (1/18 + 1/25) = 20.9. The ERA difference and weighted IP are multiplied for each pitcher to get the right-most column. Then, 83.7 divided by 39.8 yields a composite ERA difference of 2.11 for the first three pitchers.
Alexander is one of the more memorable World Series performers. At age 28 he threw two fine games for the 1915 NL champ Phillies against the Red Sox. He won game 1, but lost game 3 by a 2-1 score. Much later, in 1926, hurling for the Cardinals, he faced the Yankees. Pete won games 2 and 6 with fine efforts, and then came in relief the next day, striking out Lazzeri with the bases full and recording a save. However, his post-season career finished in 1928, against the Yanks again, and this time the New Yorkers lit up Alex in game 2, chasing him in the third, and then hit him hard again in relief in game 4.
Overall, his first World Series effort was far superior to his combined later appearances.
The pitcher with the most weighted innings in World Series play is Christy Mathewson, who famously tossed 27 shutout innings in his initial 1905 appearance, and then threw 75 more innings with an ERA of 1.44 later in his career.
When combined using this method, there is a total of 1,374 weighted innings. Pitchers as a whole had an ERA that is a full 0.64 runs per game higher in their “experienced” Series play than in their first outings. That is almost a full year’s worth of innings pitched for an entire team, and the experienced pitchers were .64 runs per game worse.
While not being beyond the bounds of statistical significance, these results clearly show no apparent advantage of post-season experience in the first two-thirds of the 20th century.
Further investigation could be performed to attempt to account for age differences, park effects, or other factors, but I reason that the chance of these other influences is very unlikely to be large enough to sway the results of this study. Experienced pitchers have done no better in the pressure cooker of the Series than first-timers. Tell that to your favorite announcer.
TOM HANRAHAN, age 42, lives in Lexington Park, Maryland. He is employed by the Department of Defense, working to save airplanes from crashing and pilots from getting killed, wasting everyone’s hard earned tax dollars. Tom has a wife and three teenage children. With all due respect to Lou Gehrig, Tom considers himself the luckiest man on the face of the earth.
ACKNOWLEDGMENTS
Rob Wood was kind enough to review my data, correct lots of missing or bad information, and pointed out the data differences in various sources.