

Does Money Buy Success? The Relationship Between Payrolls and Victories in Major League Baseball, 1996–2005
This article was written by Alan I. Abramowitz
This article was published in 2006 Baseball Research Journal
Unlike every other major professional sport in the United States, Major League Baseball has no cap on team payrolls. As a result, there are vast disparities in the size of these payrolls. Teams from large markets with lucrative local television and radio contracts can vastly outspend teams from small markets that lack such contracts. In the 2005 season, team payrolls ranged from 29.7 million dollars for the Tampa Bay Devil Rays to 208.3 million dollars for the New York Yankees. And the gap between baseball’s haves and have-nots has been growing. Between 1996 and 2005, the difference between baseball’s largest payroll and smallest payroll increased from 36.8 million dollars to 178.6 million dollars.
Teams with larger payrolls should enjoy a substantial competitive advantage over teams with smaller payrolls. And this appears to be the case. In 2005, for example, the seven teams with payrolls larger than 90 million dollars won an average of 55.6% of their games while the seven teams with payrolls smaller than 50 million dollars won an average of only 45.1% of their games.
Still, there are many exceptions to the rule that a larger payroll means greater success on the playing field. In 2005, the San Francisco Giants with a payroll of 90.2 million dollars won only 46.3% of their games while the Cleveland Indians with a payroll of only 41.5 million dollars won 57.4% of their games. And such anomalies are not rare. In recent years teams with very modest payrolls, like the Minnesota Twins and the Oakland A’s, have enjoyed considerable success while teams with much larger payrolls, like the New York Mets and Texas Rangers, have performed poorly.
So overall, how much difference does money make in team success? To answer this question, I calculated the correlations between team payrolls and won-lost percentages for the last 10 baseball seasons. The results are displayed in Table 1. A correlation coefficient measures the strength of the relationship between two variables. It can range from zero (no relationship) to one (a perfect relationship). The squared correlation coefficient measures the proportion of variation in one variable that is explained by the other variable.
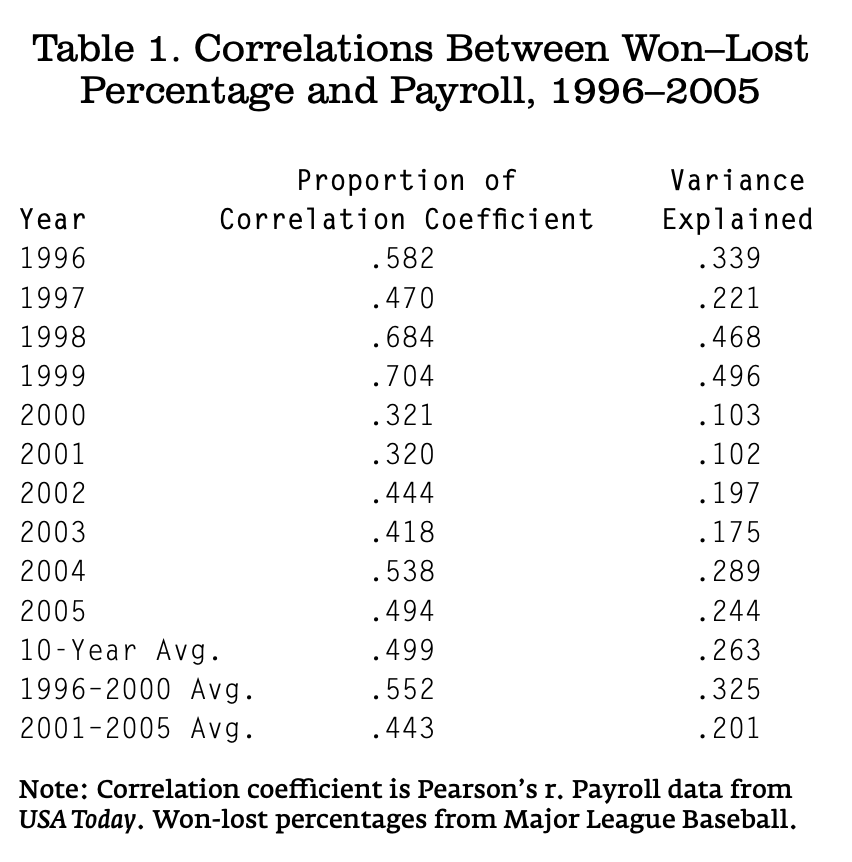
The results in Table 1 show that the strength of the relationship between team payrolls and won-lost percentages varied considerably over these ten years. In some years the relationship was fairly strong while in other years it was quite weak. On average, however, the relationship between team payrolls and won-lost percentages was fairly modest—spending explained an average of only 26.3% of the variation in success on the playing field over these 10 seasons.
Despite the growing disparity in the size of team payrolls between 1996 and 2005, there is no evidence here that the impact of spending increased over time. In fact, the average correlation between team payrolls and won-lost percentages was somewhat larger during the first half of this time period than during the second half: the proportion of variation in team success explained by spending declined from an average of 32.5% between 1996 and 2000 to an average of only 20.1% between 2001 and 2005.
These correlations actually overstate the influence of spending on won-lost records. That is because the correlation between spending and success reflects the influence of success on spending as well as the influence of spending on success. Teams that enjoy success on the playing field tend to increase their payrolls the next season because of increased revenues and increased salary demands from players. To control for the influence of success on payrolls, I calculated partial correlations between team payrolls and won- lost percentages while controlling for the previous season’s won-lost percentages. As expected, these partial correlations were considerably smaller than the original correlation coefficients. They ranged from -.038 to .603. The average partial correlation between payroll and won-lost percentage, controlling for last season’s won-lost percentage, was a very modest .203.
The general conclusion that can be drawn from these data is that team payrolls have only a limited influence on what happens on the playing field. Further evidence for this proposition can be seen by comparing actual team performance with what would be expected based solely on the size of team payrolls. Along these lines, Table 2 displays the difference between actual and expected wins per season for every major league team between 1996 and 2005.
The results in Table 2 show that over these 10 seasons, some teams consistently exceeded what would be expected based on their payrolls while other teams consistently fell short of what would be expected. The most successful teams in baseball during this period were the Oakland A’s and Atlanta Braves. The A’s won an average of 12.6 more games than expected per season based on their payroll while the Braves won an average of 10.3 more games than expected per season. At the other end of the spectrum, the least successful teams in baseball during this period were the Detroit Tigers and Tampa Bay Devil Rays. The Tigers won an average of 11.3 fewer games than expected per season based on their payroll while the Devil Rays won an average of 10.0 fewer games than expected per season.
These results demonstrate that while money matters in baseball, it matters considerably less than many people assume. A team’s success on the playing field depends as much on leadership, organization, and baseball knowledge as it does on the size of its payroll.
Table 2. Difference Between Actual and Expected Wins per Season, 1996–2005
| Team | Difference |
| Oakland A’s | + 12.6 |
| Atlanta Braves | + 10.3 |
| Houston Astros | + 7.4 |
| San Francisco Giants | + 6.3 |
| Chicago White Sox | + 5.8 |
| Minnesota Twins | + 4.9 |
| New York Yankees | + 3.3 |
| Cleveland Indians | + 3.0 |
| Seattle Mariners | + 2.2 |
| Los Angeles Angels | + 1.9 |
| Boston Red Sox | + 1.7 |
| Washington Nationals | + 1.6 |
| Florida Marlins | + 1.6 |
| San Diego Padres | + 0.6 |
| Cincinnati Reds | – 0.8 |
| Los Angeles Dodgers | – 1.0 |
| Toronto Blue Jays | – 1.0 |
| Arizona Diamondbacks | – 1.8 |
| Philadelphia Phillies | – 2.0 |
| Pittsburgh Pirates | – 2.1 |
| Milwaukee Brewers | – 3.8 |
| New York Mets | – 4.0 |
| Chicago Cubs | – 5.1 |
| Texas Rangers | – 5.2 |
| Colorado Rockies | -6.2 |
| Kansas City Royals | – 7.0 |
| Baltimore Orioles | – 8.3 |
| Tampa Bay Devil Rays | – 10.0 |
| Detroit Tigers | – 11.3 |
ALAN I. ABRAMOWITZ is an Alben W. Barkley Professor of Political Science at Emory University.