

Estimating the Dollar Value of Players
This article was written by Vince Gennaro
This article was published in Summer 2009 Baseball Research Journal
As fans we often question the offseason free-agent signings by baseball GMs, wondering how the value of some mega-contracts could possibly be justified. Why does Barry Zito command $126 million over seven years from the Giants, or is CC Sabathia “worth” $161 million over seven years to the New York Yankees? Is this rational decision-making at its finest, ego-driven mania, or something in between? While there may be no definitive answers and certainly no “final word” on player value, there is an analytical path we can follow to at least shed some light on the rationale of the spending decisions of MLB GM.
There are several approaches to the question “How much is a player worth?” One way to measure “value” is to estimate the market value of a player as reflected by his price (i.e., the value of his contract) in the free-agent market. A second approach is to assess a player’s economic value to his team—how much additional revenue (and asset appreciation) he could be expected to generate for his prospective employer. This article focuses on the latter approach, assessing the economic value of a player to his team, called his marginal revenue product—the amount of incremental revenue a team can be expected to generate owing to the win-contribution of a player’s performance on the field. By estimating the amount of revenue a team would generate with and without a “3-win” or “4-win” player, we can estimate the dollar value of the player to the team. The concept of marginal revenue product as applied to a player’s value refers to the marginal quality of the player and its impact on revenues versus some predetermined baseline, usually a replacement- level player.1
The process to estimate a player’s dollar value follows two key steps: Convert a player’s performance into a win-contribution to the team and translate changes in the team’s on-field performance into its impact on team revenues and the value of its assets. Fortunately, numerous statistical analysts have translated a player’s performance into his win contribution to his team. Wins above replacement player (WARP) from analysts at Baseball Prospectus, win shares above bench (WSAB) from Dave Studenmund at the Hardball Times, and value sins (VW) from Fangraphs.com, derived from Tom Tango’s wins above replacement (WAR) metric, are examples of this effort. However, in order to convert a player’s win contribution into dollar value, we need to delve deeply into the team’s economics and financials to better understand how revenues fluctuate with the team’s on-field performance. By applying regression analysis to individual team attendance, broadcast revenues, and other revenue streams, we can estimate how a team’s annual wins impact each of these revenues, while adjusting for such factors as new stadium openings, past work stoppages, and previous postseason appearances. (See the sidebar below for a comparison to other research in this area and for some additional detail regarding my methodology.)
Furthermore, by analyzing the relationship between attendance revenues and an MLB team’s other revenue categories, we are able to gain a more complete picture of the impact that winning has on team revenues. (An in-depth analysis of the win—revenue analysis of all MLB teams is one of the subjects of my book Diamond Dollars: The Economics of Winning in Baseball.)2 Having taken this approach in some instances with team-specific proprietary data and, in other cases, with team-specific publicly available data, I’ve reached four important conclusions that generally apply to the win–revenue relationship for all MLB teams:
Winning and revenues are highly correlated and behave in a predictable and measurable way, influenced by the strength of the team’s brand, the loyalty of its fans, and the size of its market. Each team’s win—revenue relationship is unique, which means that a player’s value is best defined in the context of a team. Winning affects revenues over a range—generally, from 70 to 100 wins for a season—but, at the low and high extremes (<70 and >100), winning has little impact on revenues. For example, if the San Diego Padres should improve on their 63-win season of 2008 by winning 68 games in 2009, the effect on revenue is expected to be negligible.
The fan response to winning is somewhat lagged. Statistically speaking, the strongest relationships between wins and attendance occur when wins are defined as a combination of the previous and current year’s annual win totals. This makes intuitive sense since a team’s season-ticket renewals and advance sales are influenced by the team’s just-completed season as well as by fans’ perceptions of offseason trades and player signings. If a team gets out of the gate strong with a winning April and May, it bodes well for second-half ticket revenues. If the team sustains their performance for the balance of the season, that is likely to benefit advance sales for the following season.
A significant revenue windfall occurs when a team reaches the postseason. This is due to a pattern of fan behavior that is commonplace across all of baseball but is most pronounced when a team reaches the playoffs after having missed qualifying for several years or more. The implication of this finding is that not all wins between 70 and 100 are equally valued. Those wins that heighten the chance of a postseason appearance are clearly valued at a premium.
THE POSTSEASON EFFECT
When a team reaches the postseason, particularly after a prolonged absence, a predictable pattern of fan behavior occurs, which translates into a revenue windfall. Two recent examples of this impact were triggered by the 2005 White Sox and the 2006 Tigers. Once a team qualifies for October baseball, fans invariably scramble for playoff tickets, only to find the seating selection or price in the secondary market disappointing. With their newfound optimism about the future prospects of their favorite team, some fans decide to purchase full- or partial-season tickets for the next season. They view these as “options” on future playoff seats. In addition, the newly validated playoff team experiences strong advance single-game sales for the coming season as well as improved broadcast ratings, which can lead to more advertising revenue.3 Corporate sponsors jockey for position to secure their team affiliation, and even luxury-suite demand increases as the team’s games become a more desirable customer entertainment option. Furthermore, teams show greater resolve to raise ticket prices—and fans show a greater willingness to absorb them—for a playoff team. From the inception of the wild card in 1995 through 2008, teams that reached the postseason raised ticket prices for the following year, on average, 4.5 percent more than teams that did not reach the postseason.4
An important conclusion about the playoff windfall is its multiyear benefit. Even if the team fails to reach the postseason for the next several years, not all of the newfound supporters disappear immediately. My analysis of attrition rates of playoff teams suggests that, while the revenue effect declines each year, it may take up to five years before the last new season
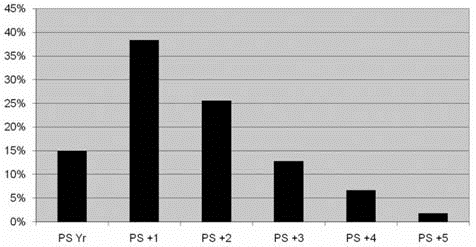
ticket-holder gives up hope and fails to renew. When added to the game revenue from the playoff games (including concessions, etc.), the estimated flow of revenues from a postseason appearance is shown in figure 1. The net result of summing all of these revenue effects can be a future revenue stream with a net present value (NPV) equal to 20 to 30 percent of a team’s local revenues, beginning in the season follow- ing a team’s playoff appearance. (The White Sox received an added financial “kicker” from the team’s increased popularity after winning a world championship.)
Figure 1. Postseason Effect—% of Revenues by Year
(100% = total impact of reaching the postseason)
For a team, such as Philadelphia or Seattle, whose revenue base is in the second or third quartile for MLB teams, reaching the postseason could mean anywhere from $30 million to $40 million (NPV), while winning a world championship could double that amount. For teams in the top quartile, such as the Los Angeles Dodgers and New York Mets, the postseason value could be more than $50 million.5
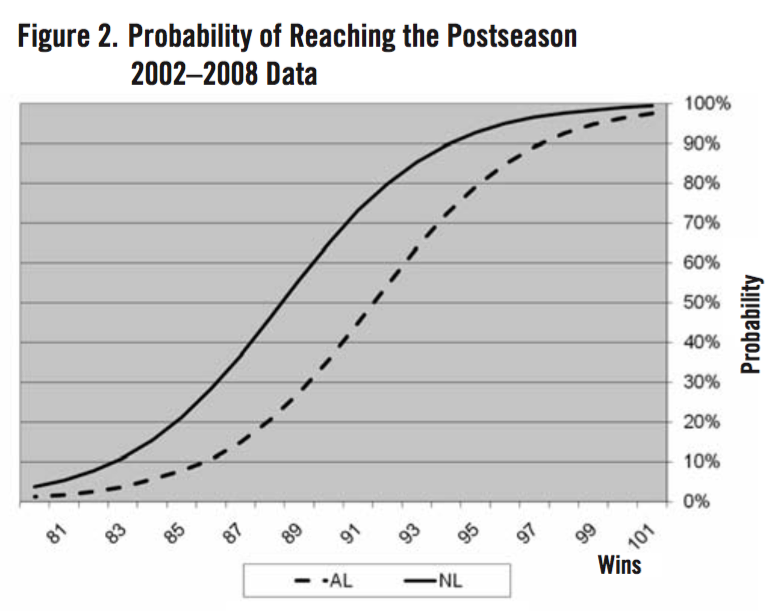
How do we integrate the value of the postseason into the win–revenue relationship? One way is through a two-step process that allows us to create an expected value of the postseason that corresponds to each win total. The first step involves analyzing the historical probabilities of recent divisional and wild-card races. By applying a logistic regression we can estimate the probability of reaching the postseason at each win total. Given the quality disparity in recent years between the two leagues, it is not surprising the results yield a different probability for an AL versus NL team. (See figure 2.) To complete the process, we take the probability of reaching the postseason at each win total and multiply that by the total value of the post-season. The net result is an estimate of a team’s win–revenue relationship, including the expected value of the postseason—a team’s win-curve.
Figure 2. Probability of Reaching the Postseason, 2002-2008
A PLAYER’S VALUE IS SITUATIONAL
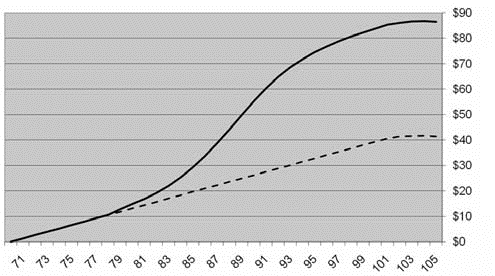
A team’s win-curve is the culmination of all revenue sources and their relationship to a team’s on-field performance. The example in figure 3 shows an estimated win-curve for the 2008 New York Mets, with the post-season effect overlaid on the in-season win–revenues. (Note: The win-curve begins at 70 wins, the point from which the incremental revenue from winning is measured.) The postseason effect causes the win-curve to be nonlinear. When a team is in contention, it is operating along the steepest portion of the win-curve, meaning that a few more wins (or slightly fewer wins) carry the highest financial value. Consequently, a player’s dollar value—his marginal revenue product— is greatly influenced by where his team is on the win-curve. For example, if the Mets add a 4-win player to an otherwise 88-win team, the player is expected to generate $20.5 million in revenue. The same player added to an 80-win team would generate only $10.5 million. In the first example, our player elevates the Mets to a 92-win team, thereby improving the Mets’ probabilities of reaching the postseason by 34 percentage points. In the latter example the Mets are only 9 percent more likely to make the postseason due to the roster addition. (See figure 3.)
Figure 3. New York Mets’ Estimated 2008 Win-Curve
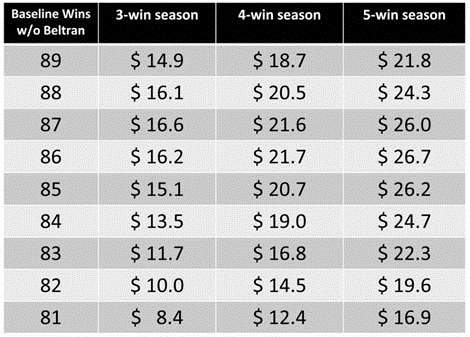
The marginal value of the last piece of the puzzle can be much higher than the value of the same player added to an 80-win team. Let’s apply this approach to prospectively valuing the Mets’ Carlos Beltran for the 2009 season.6 In our example, we will examine how Beltran’s value is impacted by both his performance and the team’s performance. According to fangraphs.com, Beltran has averaged approximately 5.5 value wins over the past six years. Before the 2009 season, the Mets are once again filled with optimism. The team narrowly missed the post-season in 2007 and 2008 and they hope to contend once again in 2009. Let’s begin with the scenario that defines Beltran as a 5-win player added to an 85- win-baseline Mets team—meaning a team that would be expected to win 85 games with a replacement player, instead of Beltran, in center field. Under this scenario, Beltran raises the probability of the Mets reaching the postseason by 44 percentage points— from 21 percent to 65 percent—and, in doing so, a 5-win Beltran has an expected value of $26.2 million. The $26.2 million consists of $19.8 in expected value of achieving the postseason revenue stream and $6.4 million in the value of 5 wins, independent of achieving a playoff spot. Figure 4 shows various scenarios of Beltran performance, in the context of various team performance scenarios and the resulting expected dollar value of Beltran.
It is interesting to note that, at both the low end and the high end of the team-performance scale, Beltran’s value drops. At the low end it conjures the image of the famous Branch Rickey quote to Ralph Kiner, “We could have finished last without you,” while the high end of the team performance scale implies they likely would have advanced to the postseason without Beltran. According to the estimates in figure 4, Beltran would not “earn” enough revenue to cover his salary as a 3-win player. As a 4-win player, he would justify his salary only if the Mets were an 84-to-89-win team without him. If Beltran turns in a 5-win performance, he is expected to generate the revenue to cover his salary as long as the Mets ultimately win 87 to 95 games. Our win-curve analysis demonstrates that a player’s value is situational, dependent not only on a player’s performance but also on team performance—its location along the win-curve.
An interesting implication of this analysis is the “accountability” for delivering value. If Carlos Beltran performs at a 5-win level but the team is an 81-win- baseline team prior to his performance, the estimate
Figure 4. Carlos Beltran — What If?
Incremental Revenue from Various Performance Scenarios
Notes
- An analogy in a non-sports business environment would be to compare a top-quartile salesman in a firm to the “replacement level” salesman that could be hired off the unemployment (In times of high unemployment, replacement level can rise significantly.) Suppose your top-quartile salesman is expected to sell $500,000 worth of products annually, with a net margin of $125,000 (net of all product costs and associated expenses, except his compensation), and a replacement salesman is expected to deliver $60,000 in net margin dollars; then the marginal revenue product of the top-quartile salesman is $65,000 over replacement level.
- Vince Gennaro, Diamond Dollars: The Economics of Winning in Baseball (Hingham. Mass.: Maple Street Press, 2007).
- Most teams have multiyear agreements for their broadcast rights, which means team broadcast revenues may be fixed for any given On the other hand, teams that own a share of a regional sports network (Red Sox and NESN, Yankees and YES, etc.) share in both the annual fluctuation— in ad rates and the change in the asset value of the network—resulting from on-field performance.
- The level of success a team has during its postseason run has an impact on the size of the postseason When the 2005 San Diego Padres qualified for the postseason with only 82 wins and then were ousted with three straight playoff losses to the St. Louis Cardinals, much of the potential benefit of reaching the postseason was negated by the Padres’ poor performance. The combination of their modest win total and their poor showing failed to provide a motivating fan experience, nor did it validate the Padres as a bona fide future postseason contender.
- Given evidence of the “postseason effect,” simply analyzing a team’s revenues as a function of wins is likely to miss the impact of the postseason and lead to an erroneous conclusion as to the impact of on-field perform- Approximately 10 to 15 percent of the postseason revenue stream will likely occur during the year the team reaches the postseason, about 40 percent will occur the following year, and the remaining 45 to 50 percent will occur in years 2 through 5 following the postseason appearance.
- For the purpose of this analysis, I am operating with the assumption that the Mets’ win-curve did not change from my 2008 In reality, once some of the financial parameters of the new Citi Field become available, I would expect to conclude the win-curve will shift considerably, yielding additional revenue at each win level.
Other Research on Player Value and Further Discussion on Methodology
Shortly after free agency became a reality three decades ago, as a graduate student at the University of Chicago, I embarked on a project to estimate the marginal revenue product for major-league players. (The results of the project became the topic of an article in The Sporting News in the spring of 1979.) The resurrection of this project several years ago led to my series of team-specific models to estimate the relationship between a team’s on-field performance and its resulting revenues.
The process combines statistical analysis—primarily multiple regression—and detailed financial analysis of the key factors that drive a team’s profit-and-loss statement. In these instances I am using publicly available data. I divide a team’s revenue into three categories: attendance, broadcast, and all other. The process begins with a team-specific regression model, with average annual per-game attendance as the dependent variable. (The reason team-specific is important is that the differing local economics of teams mean that the value of a win to the Yankees may be 4 times the value of the same win to the Kansas City Royals, rendering useless an analysis that pools all teams and deals in MLB averages.) The independent variables include those that reflect a team’s wins—last year’s and the current year’s wins— and dummy variables to adjust for the impact of new stadium openings, work stoppages, and other nonrecurring events. This model creates the foundation of a team’s win-curve by quantifying the win-attendance relationship. By multiplying the estimated attendance values by the average ticket-price data compiled and published by Team Marketing Report, we can translate this estimate into attendance revenues. The next step is to impute the impact of wins on all other revenues, using a team’s historical ratio of attendance to all other revenues published in financial data released as part of the Blue Ribbon Panel Report. (For teams that have provided proprietary data, the process of developing the win-curve is considerably more involved, as it enables me to analyze each separate revenue stream.)
The final revenue category, broadcast, requires different approaches depending on whether the team has ownership in a regional sports network (e.g., Yankees and Red Sox, with YES Network and NESN, respectively) versus a more “traditional” broadcast arrangement with a Fox Sports–type local affiliate. In the former scenario I analyze the networks’ household penetration, distribution fees from cable/satellite operators, and advertising revenues and rates. In an attempt to create “transparency” between the broadcast entity and the team, I “credit” the team with the relevant broadcast revenues that are attributable to winning. In the latter case I use a fixed fee plus a small performance bonus for reaching the postseason.
A key to estimation of the win-curve is a detailed analysis of the postseason and its impact on all of a team’s revenue streams. This analysis is aided by teams that have shared their proprietary data. The additional level of detail provided by proprietary data has enabled me to make inferences about how various revenue streams respond to postseason appearances for teams in comparably sized markets.
In “Is Alex Rodriguez Overpaid?” his chapter in Baseball Between the Numbers, Nate Silver, a driving force behind the success of Baseball Prospectus, detailed his work in the area of player value. One significant difference in Silver’s approach is his MLB-wide model of team wins and revenues, in which he stops short of creating team-specific models that differentiate the value of a win in New York versus one in Kansas City. My team-specific models not only differentiate between the value of a win in New York and the value of a win in Kansas City, but I further differentiate the win-curves of teams within a city, such as the Yankees and Mets, the Cubs and White Sox. One similarity in our two approaches is the way in which we incorporate the value of the postseason into the value of a win—by taking the probability of reaching the post-season at each win level and multiplying that by the estimated dollar value of the postseason.
of $16.9 million in incremental revenue suggests that Beltran will fail to “earn” his $18 million salary for 2009. However, in this example, the accountability for Beltran’s shortfall in value may fall on team management for failing to provide Beltran with a sufficient supporting cast, since he would have earned his salary if the team were a bit more competitive. (See figure 4.) In other words, when signing a player of Beltran’s stature (and compensation), it is implicit that, for the player to deliver value comparable to his salary, the team will likely need to be competitive. This reality often makes the free-agent market a cost-prohibitive option for teams that are noncompetitive.
As MLB grows as an industry, more teams are managing their business with the analytical tools necessary to make $100-million decisions. For the most astute teams, gone are the days of pure instinct and gut feel as the basis for signing a free agent. More teams are relying on statistical analysis of game situations to influence their in-game tactics and on statistical analysis of players to influence their roster choices. The disciplined, more objective analytical approach is now spilling over into the boardroom, as teams evaluate commitments of mega dollars to key players. Intuitive judgment will always be a critical factor in successfully running a MLB team—it’s just no longer the only factor.