

Evaluating Pitchers’ Won-Lost Records
This article was written by Stephen Finlan
This article was published in 1989 Baseball Research Journal
A pitcher’s record is a common – and imperfect – gauge of his performance. Weighing factors other than pure wins and losses gives us a better way to judge success.
THE WON-LOST RECORD is the most-often-cited pitcher’s stat, despite its obvious flaw: going 20-12 for the 1927 Yankees is not as good as going 20-12 for the 1988 Rangers. The Wins-Above-Team (WAT) statistic measures how many more wins a pitcher had than his team would have had with its other pitchers in the same number of decisions. If a pitcher goes .600 for a .500 team, he has a good WAT, but this stat is misleading because it fails to separate the element of hitting support from the element of how good that pitching staff happens to be. If the team has great hitting but poor pitching, a pitcher will probably have to go only 13-10 to get a good WAT rating. WAT compares a pitcher to the other pitchers on the same staff, rather than comparing him to the rest of the league.
This system introduces a way of evaluating a pitcher’s wins and losses with respect to the run-scoring ability of his team (and also its fielding ability). In 1985, Rick Reuschel’s 14-8 for the poor-hitting Pirates was a little better than Joaquin Andujar’s 21-12 for the good-hitting Cards or Charlie Liebrandt’s 17-9 for the average-hitting Royals.
The system assigns points to given W-L records, varying in accordance with the hitting and fielding support the team gave its pitchers. It is not based on how much above average a pitcher’s record is, because “above average” does not win pennants. The system is based on the idea that the team’s goal is to win the pennant. Therefore, positive points are only awarded to records that are at, or close to, a pennant-winning caliber.
Assuming an average-hitting team, and ignoring for now the factors of complete games, saves, and the era in which the season occurred, look at the logic of gauging pennant-winning performance. First, award points for W-L records over .600. A pitcher who goes 17-11 (.607) for an average-hitting team has a season of pennant-winning caliber and is awarded one point. If the rest of the pitching staff accumulates a similar percentage, the team will win 98 games and contend for the pennant. If a pitcher maintains that percentage, he deserves more points. Thus, 26-17 (.605) is worth one and one-half points. The system is configured on the basis of the question: How close to a pennant does his won-lost record take the team?
A 23-10 record is better than an 18-7 record in this system, even though the percentage is lower (.697 compared to .720). If a pitcher is 18-7 on September 1, and then goes 5-3 for the remainder of the season, he added eight more decisions at a .625 rate, and pushed his team closer to a pennant. Or consider that when a pitcher goes 23-10, the rest of the staff needs only to accumulate .581 over the remaining 129 games to get 98 wins. If a pitcher goes 18-7, the rest of the staff must achieve .584 over 137 games. Therefore, 23-10 is a 3.5 point season; 18-7 is a 3-pointer.
(Click image to enlarge)
The Basic Point System and its Adjustments
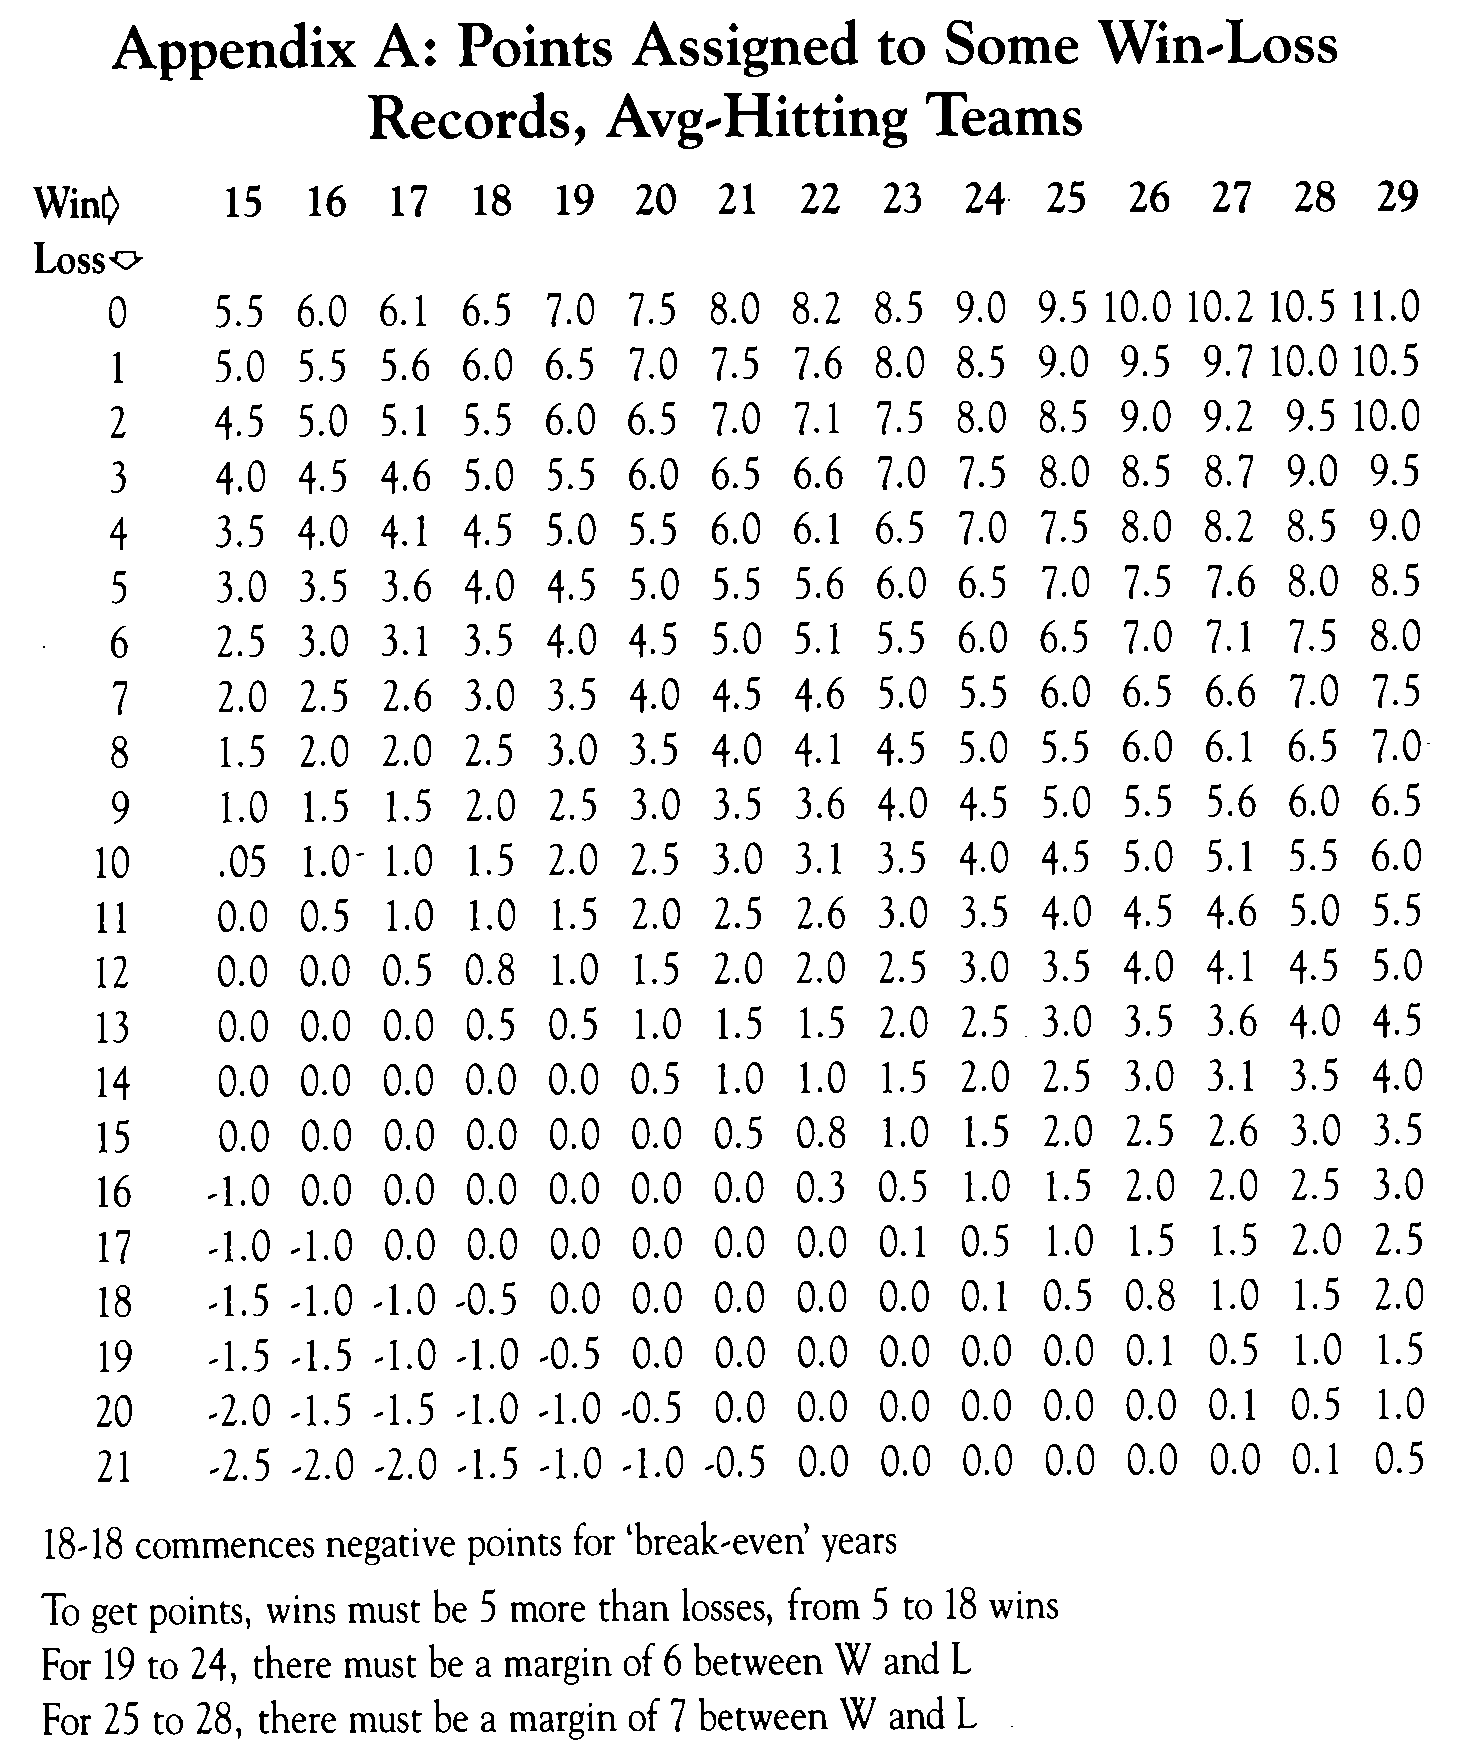
Appendix A shows a chart of points awarded for seasons with 15 to 29 wins, and 0 to 21 losses, including negative points for some seasons, and zeroes for seasons in the middle. Appendix B also discusses how these numbers are adjusted for hitting and fielding support, and the era in which the season occurred.
Saves are a different case. As a general rule, a pitcher is awarded an additional win for every four saves, or for every five saves if he has over 19. If the pitcher has a negative season, then a win is awarded for every three saves (even if more than 20), in order to help him get out of negative territory. Also, if a pitcher’s record is a “high zero” and he had three to seven saves, a win is awarded for every three saves in order to give him a positive rating for the season.
Important adjustments are made according to era. There is a very significant increase in these figures for years after 1947, and a major reduction for seasons pitched before 1893, when the mound was moved to 60’6″. More details are given in Appendix B.
It must be admitted, however, that the system is more effective for rating starters than relievers, and more useful for the era before relief pitching became so important. Some people may feel these factors affecting W-L are one reason why ERA is a more useful stat, but ERA has as many flaws as W-L: it can be pushed up by one bad game; it ignores unearned runs, as though pitching effectiveness becomes irrelevant once an error is made; and it ignores the dynamics of individual games. W-L measures something ERA does not: a pitcher’s competitiveness in each game – his ability to pitch well enough to win, whether that means 1-0 or 5-4. W-L also incorporates a pitcher’s hitting and fielding ability, which can help his team to win.
Additional Points
The main component in this point system is the total of the points gained or lost in all of a pitcher’s seasons. However, points are added at the end for other achievements, including a tenth of a point for every 10 wins, and another tenth of a point for every hundred wins, so that a 13-10 is not simply a “zero,” but results in about .13 being added to the pitcher’s total.
Other points added at the end include: total saves divided by 200; complete games divided by 600 if the pitcher pitched in 1894 or later; complete games divided by 300 if he pitched in 1965 or later; and 1.5 points for every “ERA year.” To get an ERA year a pitcher must finish in the top three in his league in one of the following: ERA, runs-prevented (called “pitcher’s runs” in Palmer’s Linear Weights System), either of these when adjusted for home-park factor, or in overall pitcher-rating in Palmer’s system (“The Hidden Game of Baseball”).
A sum of .03 points is given for every year with a poor-hitting team, regardless of W-L record; and -.02 for every year with a good-hitting team, regardless of record. A total of .15 points is awarded for post-season wins, -. 1 for post-season losses, and there is a system for awarding additional tenths of points for post-season ERA. Several tenths of points are awarded for the pitcher’s lifetime park-adjusted normalized ERA (see “Hidden Game,” page 181). These make little difference except in settling the rating question when two pitchers are otherwise evenly matched.
Hitting and Fielding Support Adjustments
A pitcher’s won-lost record is influenced by the offensive and defensive support he gets. In any given year, a chart can be created showing that some teams stand out in supporting a pitcher with the bat and glove, and others lag behind.
For every season since 1876, compare each team’s total runs and errors with the rest of the teams in its league (taking into consideration the home-park factor, though to a lesser degree than in Palmer’s system). Most teams have been assigned to one of three categories: good, average, or poor; two rarer categories are very good and very poor. In 1988 in the AL, the A’s, Twins, Red Sox, and Yankees gave good support to a pitcher; the Indians, White Sox, and Rangers gave poor support; the Orioles very poor.
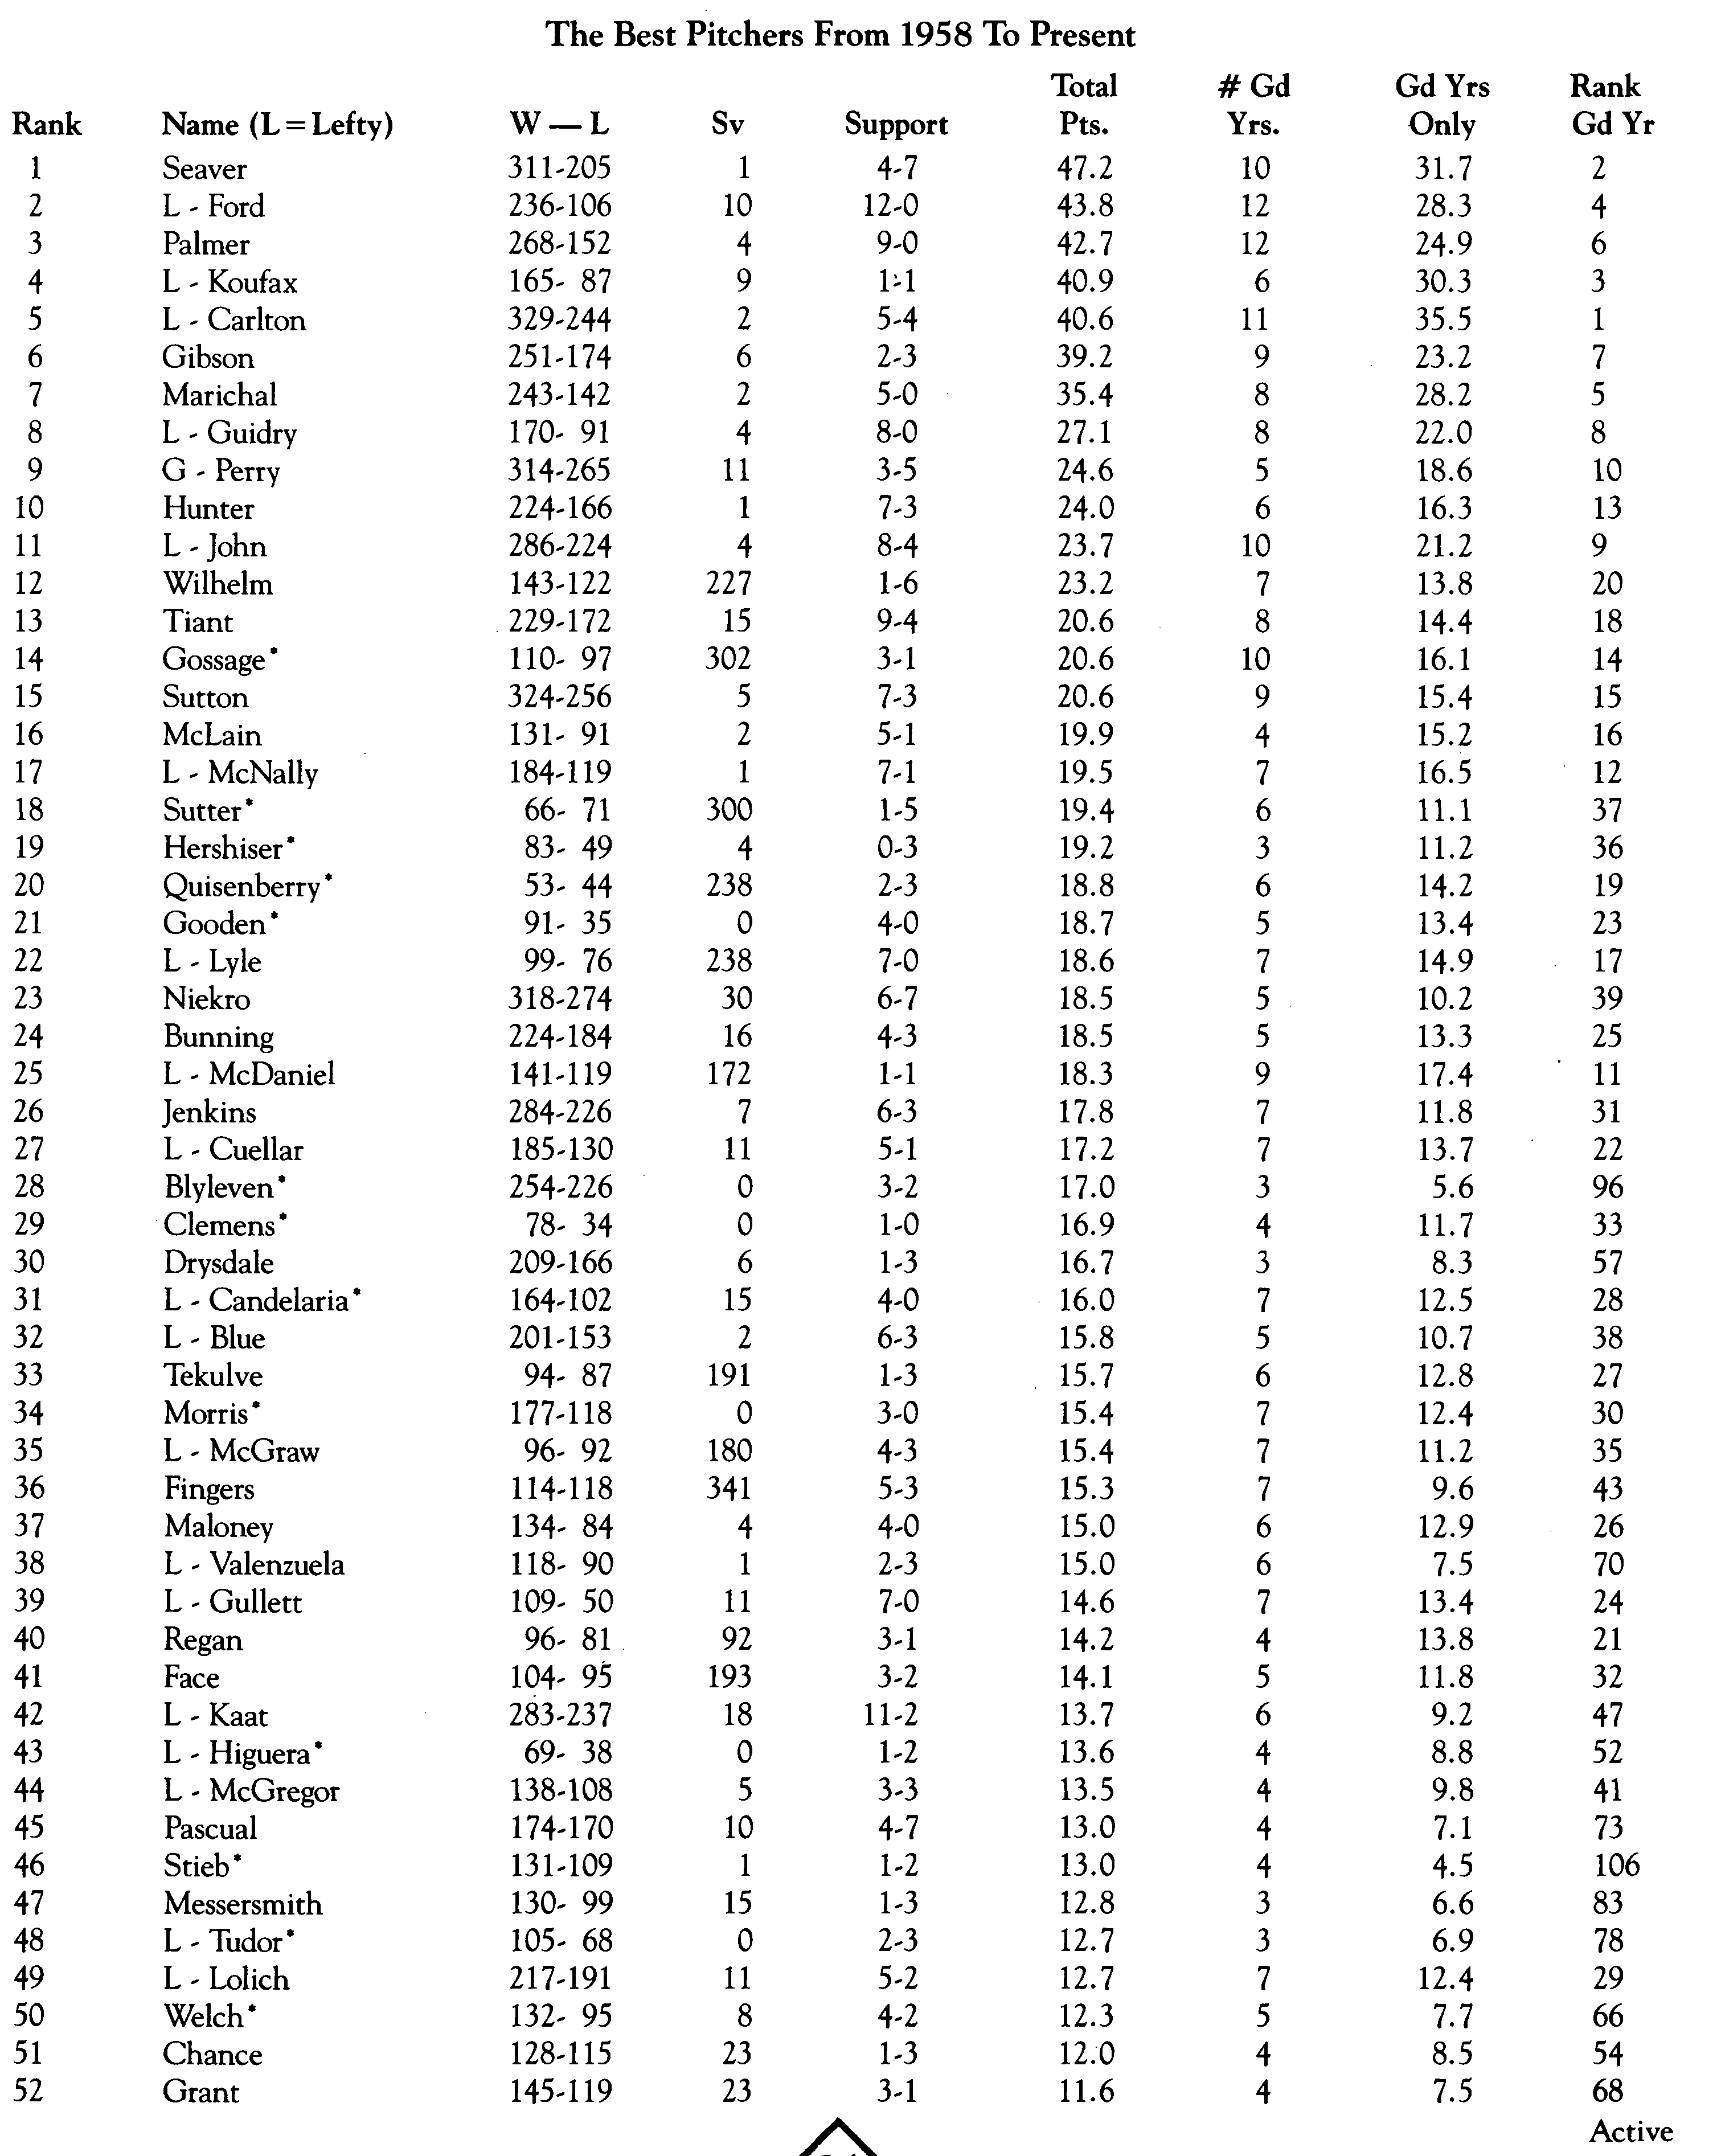
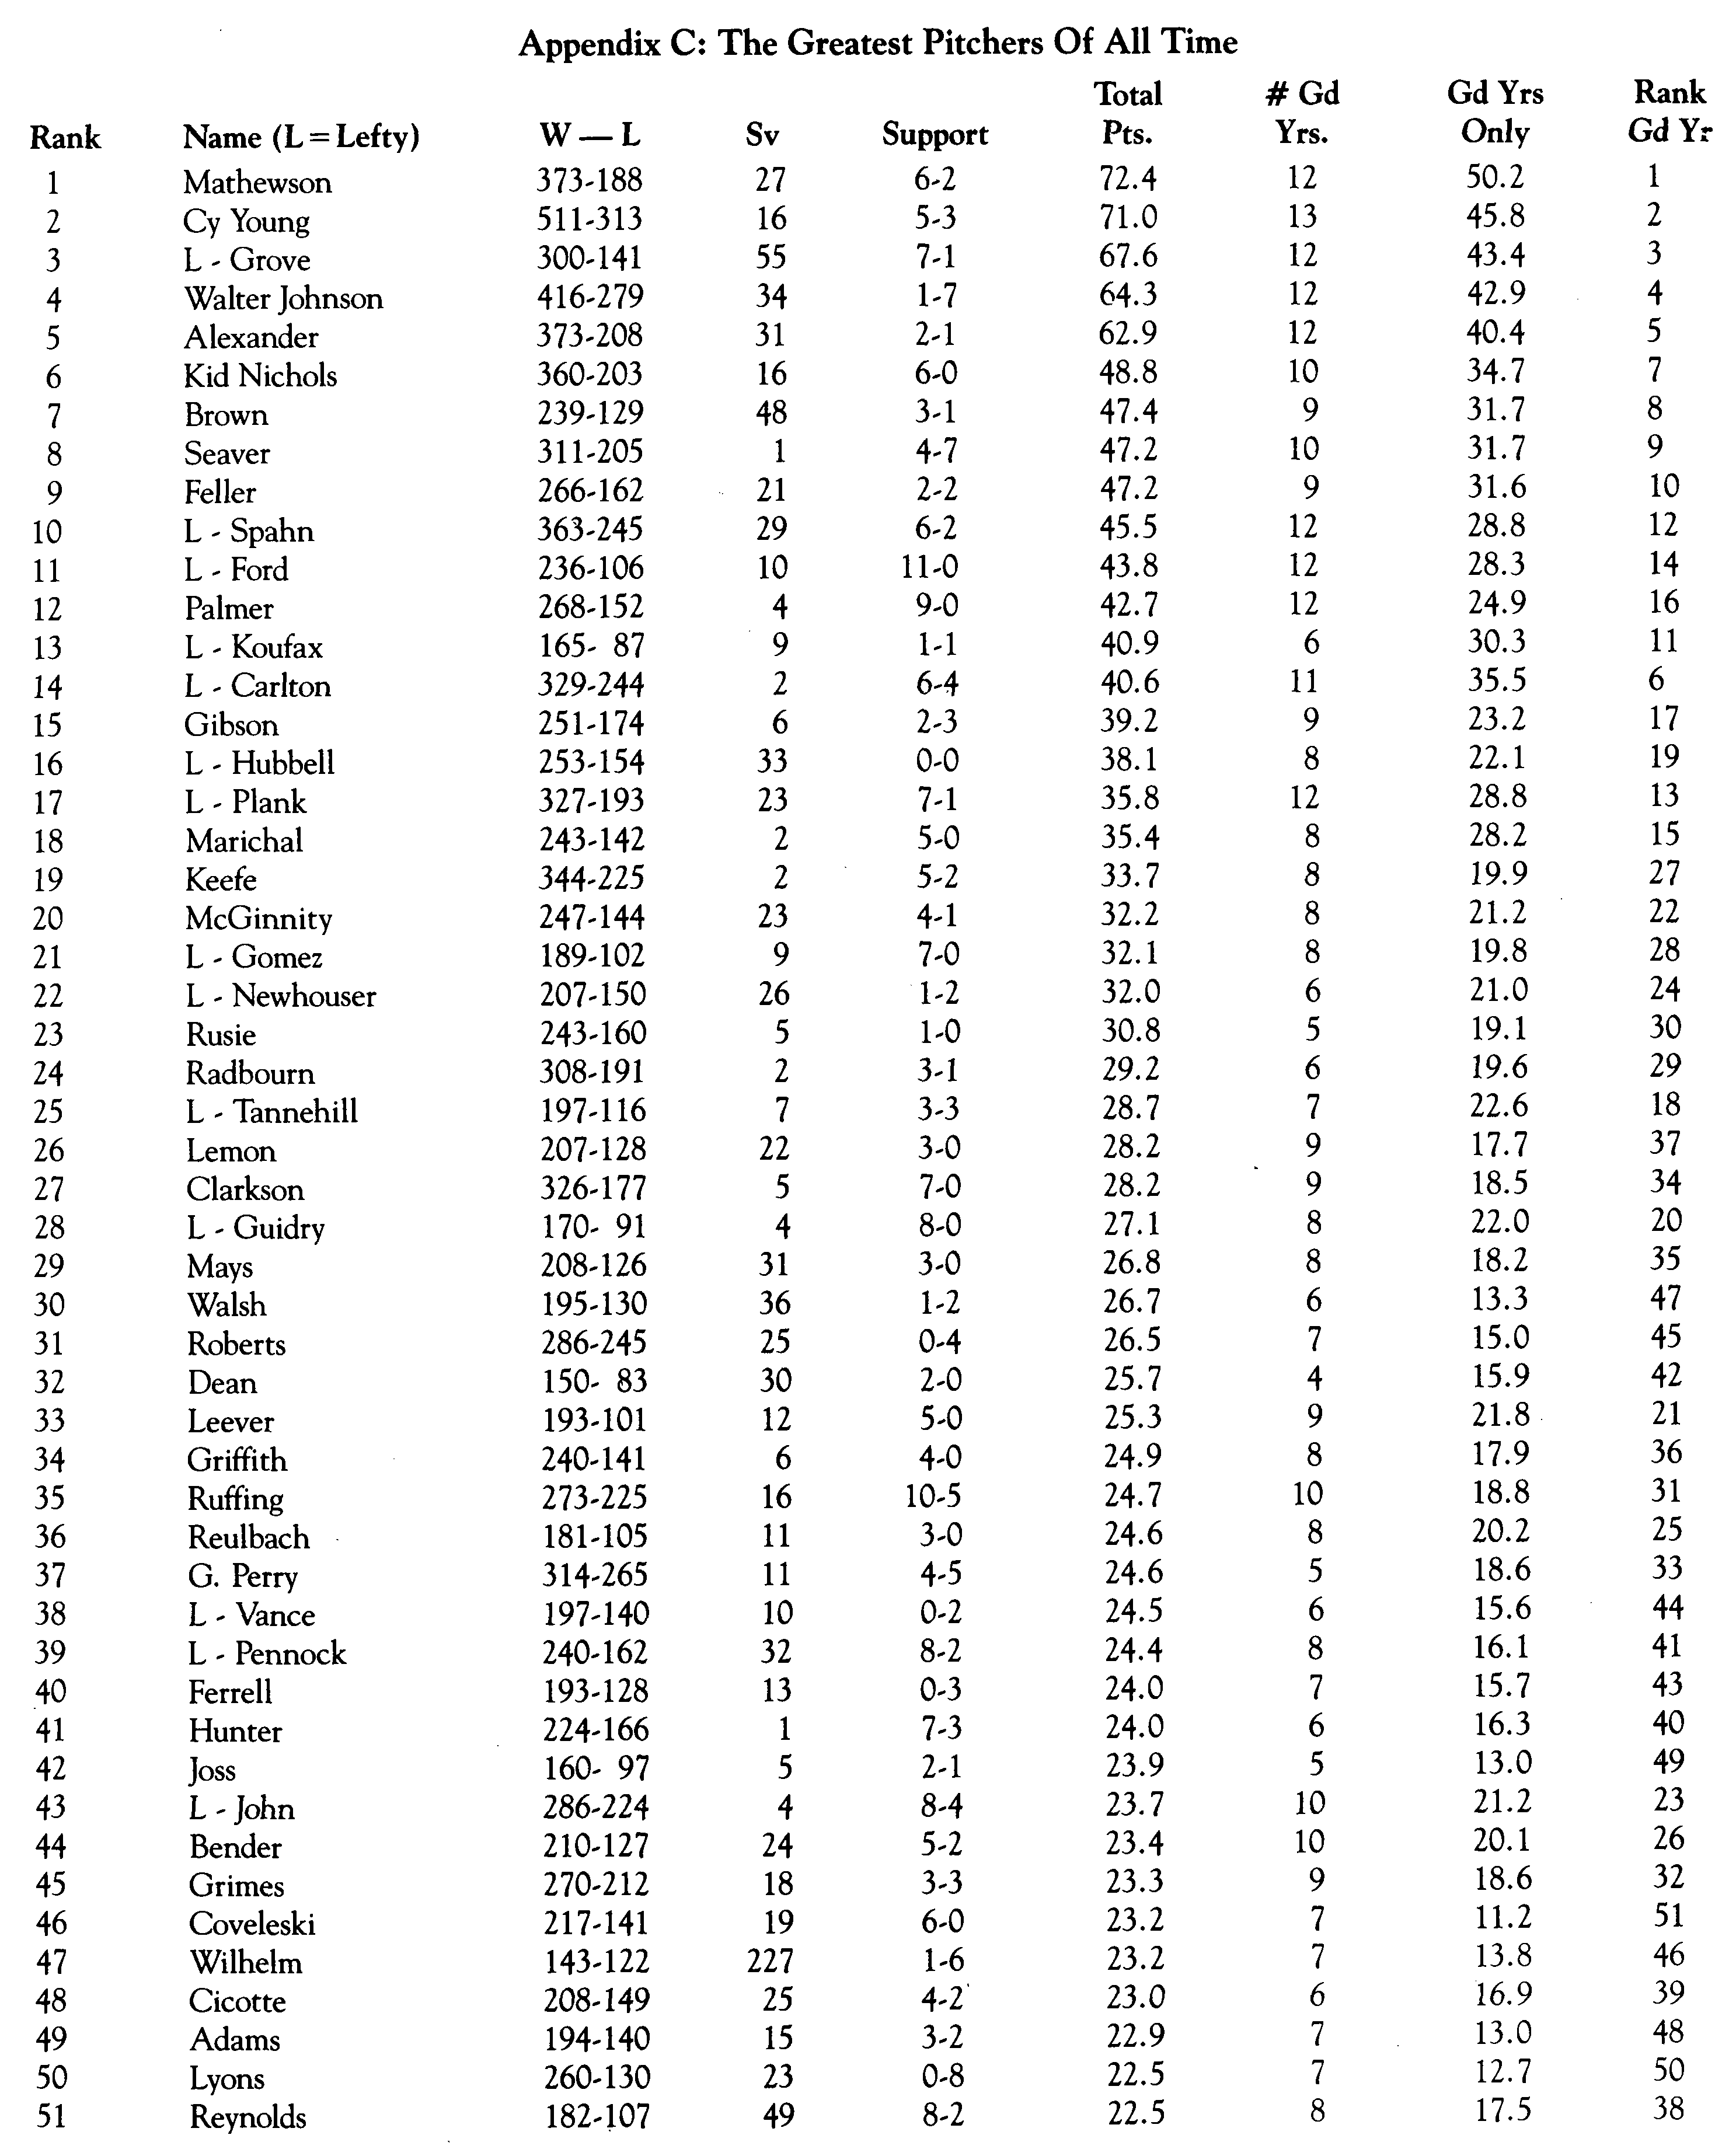
In Appendix C this category is called “Support.” Under this heading, 4-2 means the pitcher had four years with good or very good hitting and fielding teams, two with poor teams and the rest with average. The next column is total points, then the number of good years, and the points accumulated in those years. Lastly is the ranking the pitcher would have had if good years were the only thing counted (Canton would have been first among post-1958 pitchers).
Points assigned to a W-L record are reduced by 25 percent or more when achieved with a good-hitting team. Points are increased 45 to 140 percent when with a poor-hitting team, and more still for years with very poor teams (any non-losing record for a very poor team results in points). Negative points for losing years with poor teams are considerably less than for the same record with an average team.
One peculiarity about this list is the scarcity of pitchers with good teams. This “under-rewarding” of the pitcher with a good-hitting team compensates for the fact that he will have more positive seasons than a comparable pitcher with a poor-hitting team. What the latter lacks in number of “scoring” years is made up for by the higher value given to his winning years.
This point system indicates that the following pitchers may be underrated: Nichols (#6 all-time), Seaver (#8), Ford (#11), Newhouser (#22), Tannehill (#25), Guidry (#28), Leever (#33), and Allie Reynolds (#51).
Adjustments to Point-Chart
Positive-point seasons pitched before 1893 (when the mound was moved to 60′ 6″) in the NL are valued at 60 percent of the figure given in Appendix A, or at 55 percent in the American Association (though negative years are the same as shown on the chart.) National Association records are valued at 30 percent.
Seasons after 1947 are multiplied by 1.06. NL seasons after 1962 are multiplied again by 10.03; expansion years are multiplied again by .975. Also, every season is given a small increment for every year beyond 1900 (a negative increment for nineteenth-century years). A record that is worth 4.5 points in 1900 would only be worth 2.69 in 1887, or 5 for an NL team in 1980.
Stephen Finlan is a typesetter and a student of Biblical history. “BRJ” readers interested in printouts of their favorite pitchers should write him, enclosing a self-addressed stamped envelope.
Appendix A
(Click image to enlarge)
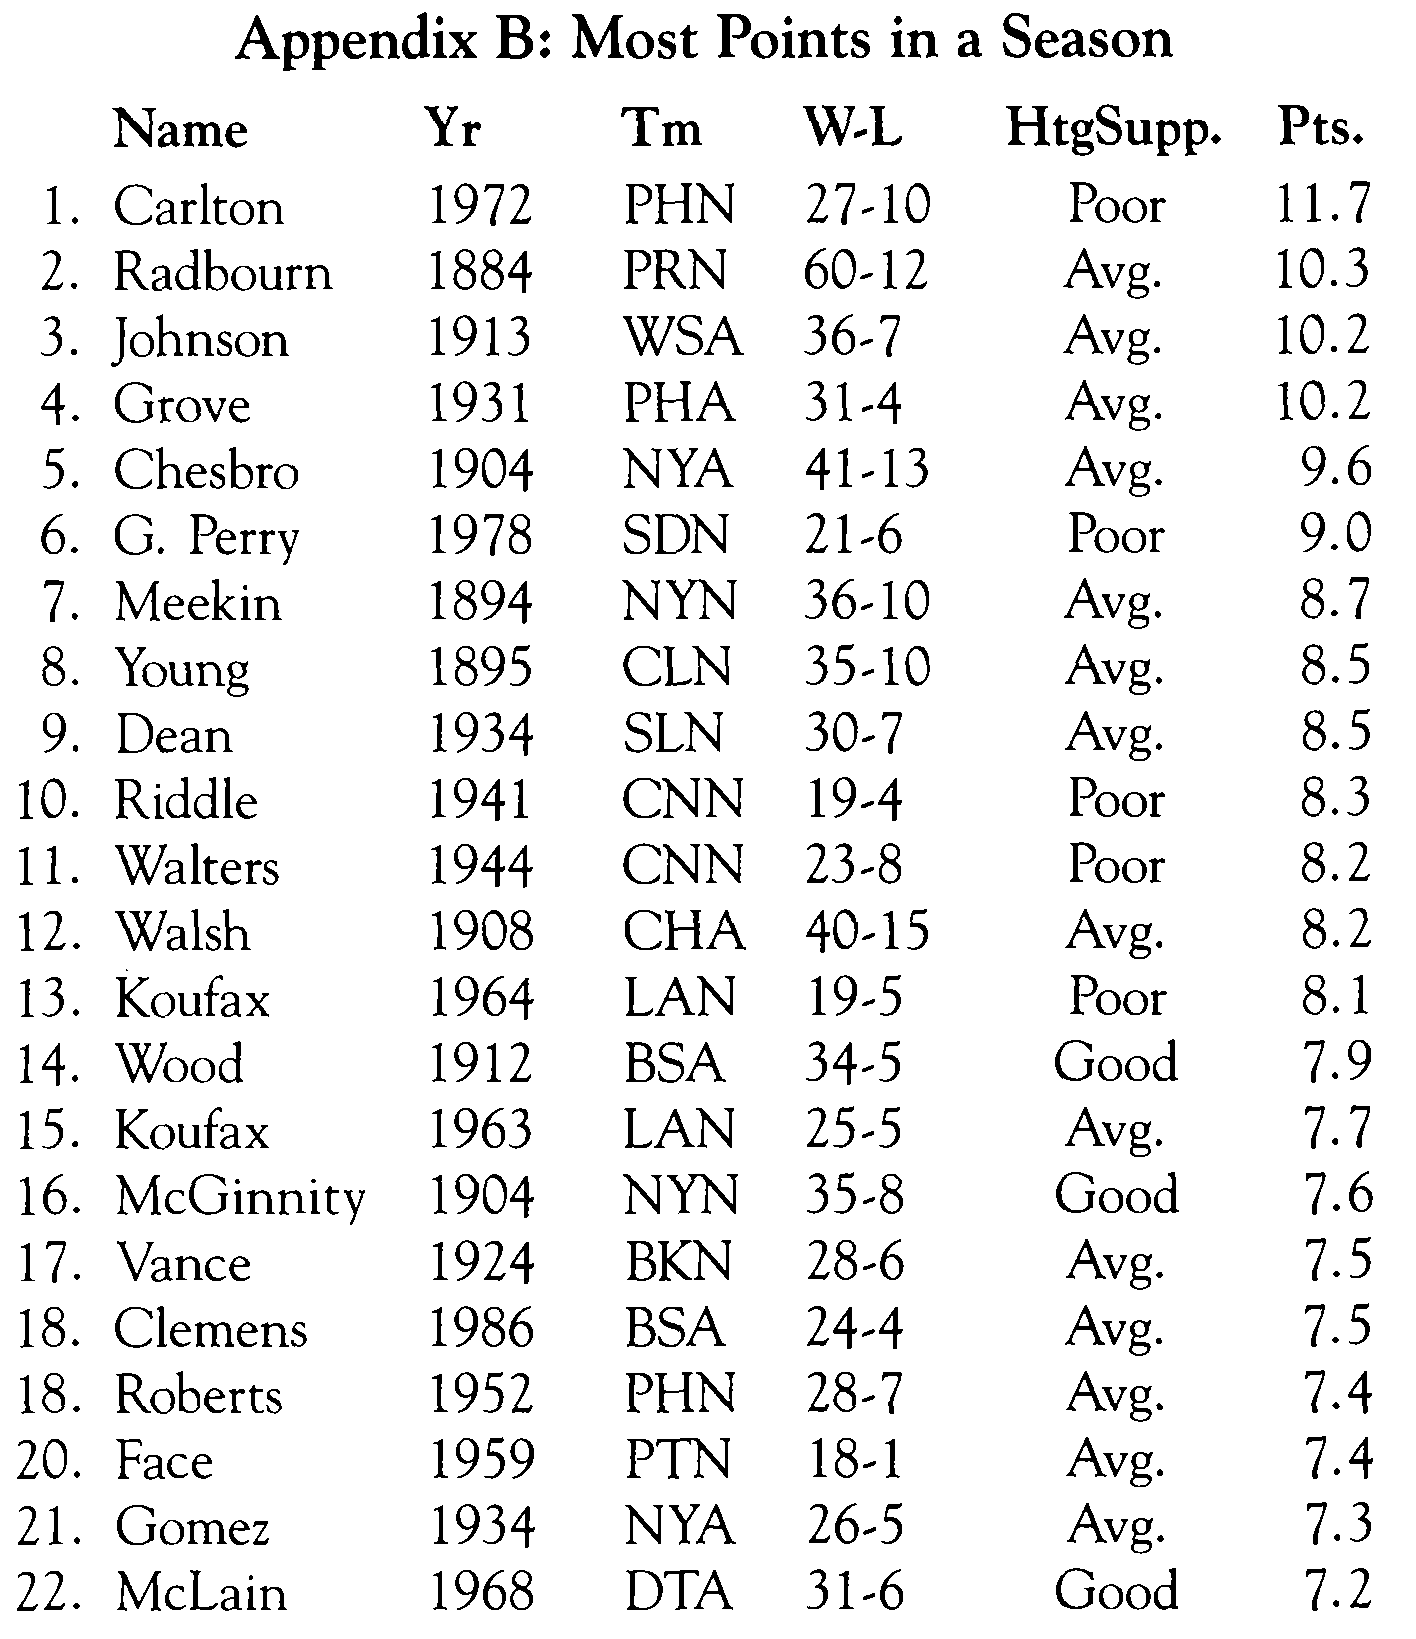
Appendix B
(Click image to enlarge)
Appendix C
(Click image to enlarge)