
Game Score vs. Starter Score
This article was written by J.T. Grossmith
This article was published in Fall 2013 Baseball Research Journal
The deficiencies in Bill James’ pitching stat Game Score wouldn’t be such a big deal if it had remained a fun stat, as the creator intended to be, but in recent years it has been elevated in status to that of the authoritative method for measuring a starter’s performance.
As an editor for most of my 38 years as a journalist, predominantly in daily newspapers, I became accustomed over time to looking for anomalies, errors or omissions in story lines and reasoning. It’s from that perspective that I began to question the methodology used in the Game Score (GS) metric for starting pitchers developed by Bill James. I have the greatest admiration and respect for James, who almost singlehandedly changed the way baseball is understood today, but admiration shouldn’t prevent one from questioning.
 My recollection is that James began trying to measure the performance of starters after Roger Clemens’s 20-strikeout, three-hit, one-run performance versus the Seattle Mariners in 1986, a record for strikeouts in nine innings which has subsequently been tied but not surpassed.
In a blog entry from Baseball Beat, January 4, 2005, “Abstracts from the Abstract,” Rich Lederer attributes the following quote from the 1988 Abstract about Game Scores to Bill: “(It’s) a kind of garbage stat that I present not because it helps us understand anything in particular but because it is fun to play around with.” At the very least, it’s a curious admission about a stat which has gained such credence over the years. Still, the idea of developing a measurement for starters certainly seemed worthwhile at the time and remains so today.
Ten years later, Clemens struck out 20 a second time in the course of pitching a five-hit shutout. Interestingly, both games scored a 97 using the Game Score metric despite one being a five-hit shutout and the other a three-hit one-run game. The common elements were the 20 strikeouts, zero walks, and the complete game. In 1998, Kerry Wood of the Cubs matched Clemens’s 20-K effort—and surpassed him by posting an eye-popping 105 Game Score in the one-hit shutout.
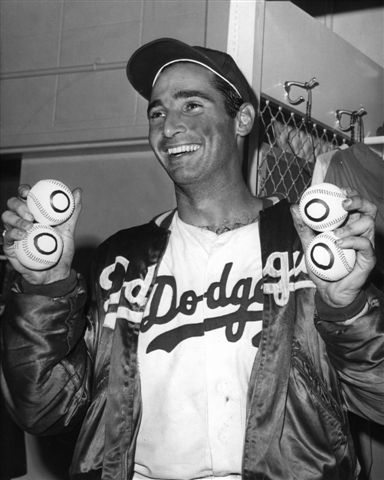
Because of the importance Game Score gives to strikeouts, that 105 score is better than any achieved by pitchers who have thrown perfect games. The highest in that regard, 101, was posted by Sandy Koufax who struck out only 14 batters in his masterpiece against the Cubs on September 9, 1965, duplicated 47 years later by Matt Cain against Houston on June 13, 2012. As much as Wood’s outing in 1998 is impressive, a one-hitter should not outshine a perfect game. The same holds true for the two-walk one-hitter thrown by Brandon Morrow of the Blue Jays in 2010, which graded out at 100 in Game Score, surpassing the perfect game thrown by Roy Halladay earlier that season.
Halladay’s performance only warranted a 98 by Game Score standards. Dallas Braden, who also pitched a perfect game in 2010, gets even shorter shrift under the Game Score metric because he fanned only six batters, resulting in a score of 93.
The deficiencies in Game Score wouldn’t be such a big deal if it had remained a fun stat, as I believe it was intended, but in recent years it has been elevated in status to that of the authoritative method for measuring a starter’s performance. GS is included in each box score on ESPN’s website and in the box scores on the otherwise superb Baseball-Reference.com site. As recently as during the 2010 postseason, Sports Illustrated ran a piece in which baseball writer Joe Posnanski waxed poetic about Game Score, calling it an “elegant little formula,” adding that while it was never supposed to be “little more than a bit of shorthand fun… I think it has turned out to be one of Bill’s more delightful inventions. The numbers just feel right.”
And that’s the problem. The more accepted Game Score becomes as part of the official record, the more difficult it will be to have it expunged. And when you see how it puts more emphasis on strikeouts than pitching a perfect game, much less a complete game, well that just doesn’t feel right.
James’s approach to evaluating players and their performance is to never set out to prove certain assumptions but rather to conduct a comprehensive search for objective knowledge. Admittedly, my approach to measuring performances of starting pitchers is less scholarly since I start from the position that a perfect game is the standard by which all pitching starts should be measured.
Game Score begins by awarding each starter 50 points; one point is added for every out during the nine innings; two points for each inning completed after the fourth and one point for each strikeout. From my perspective, several of the values are simply duplication. The two points for each inning after four in part duplicates the one point for each out, and the extra point for each strikeout also duplicates the point for each out. In effect, strikeouts are worth a minimum of two points and even more, albeit less than one full additional point, if they occur after the fourth inning. On the other hand, the deductions he uses are spot on. They include two points for each hit allowed, four points for each earned run allowed, two points for each unearned run allowed, and one point for each walk.
 My complaint with the deduction element of the formula is that it does not go far enough, neglecting to take into account Hit Batters—one point deduction, the same as a Base on Balls would seem reasonable—while at the same time unfairly penalizing pitchers who are called upon to issue an Intentional Base on Balls, which is a managerial decision, not a performance issue.
For me, the starting point should reflect a score based on reaching the ultimate objective for each starting pitcher—aside from winning the game—and that is to face the minimum number of batters. Facing the absolute minimum of 27 and getting each man out is of course a perfect game and such an achievement deserves a perfect score: 100. That is the basis of my metric which I call Starter Score. As much as striking out 20 batters is exciting stuff—and, admittedly, there have been fewer 20-K performances than perfect games—the perfect game remains the gold standard for pitching and deserves more recognition and, accordingly, a better score.
From the perfect-game benchmark, it’s a matter of determining the score for those who don’t accomplish that objective. The most significant difference between Game Score (GS) and Starter Score (SS) is the emphasis put on the deduction for not pitching a complete game. You could argue that Game Score produces a similar result because more points are given for making outs after the fourth inning and for strikeouts. But the extra points for strikeouts are optional, whereas reducing the score of a starter who fails to pitch a complete game is what makes the most difference in Starter Score.
In a span of 50 years, the drop in the number of complete games pitched highlights the importance I have placed on pitching a complete game. According to online data in Baseball-Reference.com, more than one in four starts in the 1972 season resulted in a complete game by the pitcher (3,718 starts, 1,009 complete games, 27.1%), whereas in 2012, the number had dropped to less than one in every 38 starts (4,860 starts, 128 complete games, 2.6%).
So, let’s go back to the Clemens performance against the Tigers in 1996. His Game Score is an impressive 97, largely because of the 20 Ks. Using the Starter Score metric, Clemens gets a 90, which is not exactly chopped liver but he loses 10 of the 100 points for giving up five hits. Clemens’s second 20-K performance also rates a 90, while Roy Halladay’s perfect game in 2010 nets the full 100 Starter Score (only 98 using Game Score).
It should be noted that Game Score and Starter Score have one objective in common and that is to provide a more valid definition of a Quality Start (QS). Presently, a QS is simply defined as completing six innings or more and allowing three earned runs or less, a yardstick that produces some less-than-desirable anomalies. Consider the following examples. In 1997, Randy Johnson struck out 19 in a complete game but allowed four earned runs. That, according to QS, is not a quality start even though four earned runs in nine innings produces a lower ERA than three earned runs in six innings: 4.00 vs 4.50. (By the way, using the GS methodology, Johnson’s performance grades out at 68 whereas in SS it is merely a 62. Six points might not seem like such a big deal, but given that Johnson did allow four earned runs, the lower score seems more appropriate, despite the 19 Ks.) Mark Mulder was credited with a quality start in July 2000 despite giving up 15 hits and nine runs—only two of which were earned. Game Score appropriately credits him with a miserable outing with a score of 26. Starter Score lowers the rating slightly to 25.
As both examples illustrate, the Quality Start concept is fatally flawed, even more so than Game Score. Both use factors that can misrepresent the quality of the performance. That is not possible in Starter Score because it does not have false values which add to a score. Instead, it simply deducts points using accepted and understood variables.
 The difference between Game Score and Starter Score becomes more apparent when you look at another 1997 performance by Randy Johnson. In that game Johnson pitched six innings and allowed three earned runs—effectively, a quality start. (The rest of the line score is five strikeouts, five hits, and five walks). It is also a QS using the Game Score metric, receiving a rating of 50, in part due to the double counting of strikeouts and outs after the fourth inning. (By the way, I don’t know why James picked four innings as his benchmark for GS, when four innings pitched doesn’t even qualify a starter for a win, regardless of how well he pitched.)
Nonetheless, the six-inning Johnson outing only receives a 44 under SS, a score which more accurately reflects the quality of the start. The five hits and five walks that Johnson surrendered in six innings amounts to 1.67 walks plus hits per inning (WHIP), a less-than-stellar performance. It’s only six points but those six less points put the outing in proper perspective.
The one shortcoming of Starter Score is that it does not take into account games where a starter pitches more than nine innings, but from a contemporary perspective, that occurrence is so rare to the point of almost being irrelevant. There have only been five starters since the turn of the twenty-first century to pitch more than nine innings, the most recent being Cliff Lee’s 10-inning outing versus the Giants in April 2012. Prior to Lee, Aaron Harang exceeded nine innings on July 23, 2007, Roy Halladay did it twice, and Bartolo Colon and Mark Mulder once.
The appropriate methodology would be to add a point for each out recorded past nine innings. That produces the possibility of a pitcher recording a score of more than 100 if he pitches enough innings, superbly. For example, take the classic Harvey Haddix-Lew Burdette matchup on May 26, 1959. Haddix took a perfect game into the 13th inning before it was shattered by an error by third baseman Don Hoak. Burdette pitched a masterful game in his own right, scattering 12 hits over 13 innings without surrendering a run or a walk. Using SS, Burdette graded out at 88 while Haddix, despite giving up one run, scores 107. I don’t have a problem with giving a score of more than 100 to anyone who can pitch 12 perfect innings before eventually faltering after a teammate committed an error.
There are other instances where hurlers would garner more than 100 points using SS despite not throwing a perfect game, the most notable being the matchup on May 1, 1920, when Leon Cadore of the Brooklyn Robins and Joe Oeschger of the Boston Braves locked horns in a 26-inning standoff. Both pitchers surrendered one run in the course of the marathon. Oeschger merits the higher grading of the pair, 125, based on allowing nine hits, four walks, and one earned run over the course of almost three complete games. Cadore was not quite as dominating, allowing 15 hits and five walks as well as an earned run to post a 112 score. These are aberrations we are not likely to see in the future, but they serve the purpose of illustrating that extraordinary pitching performances, which these were, deserve extraordinary scores. That, to me, feels right.
J.T. GROSSMITH is a practicing journalist of 40 years who recently unretired to return as editor and publisher of “The Glengarry News” in Alexandria, Ontario. Grossmith’s interest in baseball dates back to the mid-1950s beginning with the Toronto Maple Leafs in the International League. He attended the first game played by the Blue Jays in April 1977. He published “Perfect” (“the 20 pitchers who found immortality, plus numerous heartbreakers”) for Amazon Kindle in 2009. The book contains a section on a new metric for measuring game performances of starters from which this article on Game Score is drawn.