

Hit Probability as a Function of Foul-Ball Accumulation
This article was written by Jeffrey N. Howard
This article was published in Spring 2018 Baseball Research Journal
In a day and age when professional baseball has implemented countdown timers between innings, limited mound visits, and restricted batter movement away from the batter’s box during at-bats—all in an effort to truncate drawn-out games—the foul ball remains untouched.1 Despite some calls by fans for a rule change to curb the time foul balls expend in a game, the foul ball has an interesting tale to tell when one actually looks at the data.2
Foul balls are often portrayed as devalued events that merely slow down baseball games. However, despite its game-dragging “do-over” reputation, the foul-ball event can provide insight into the fatigue status of a pitcher while also functioning as a predictor of hitter success. This paper investigates historical Retrosheet major-league foul-ball event data from 1945 through 2015, to analyze the historical nature of foul-ball occurrence with respect to two states:
[1] foul-ball accumulation when foul ball strikes occurred “inside-the-count” (ITC); and
[2] foul-ball accumulation when foul balls occurred “outside the count” (OTC) and thus did not count as strikes.3
It is hypothesized that the foul ball as an event can predict hitting success, but that the probability of such success is dependent upon when foul balls occur with respect to the ball-strike count, and how many foul-ball events accumulate during an at-bat.
Alex Cora had a marathon 18-pitch plate appearance against Matt Clement of the Chicago Cubs that included 14 foul balls and ended with a home run. (MALINGERING/Flickr.com)
Types of Foul-ball Strikes
The role of the foul ball as a strike within the count is a logical place to start in assessing any value it might have strategically. William Juliano provides just such an analysis by assessing the role the foul ball plays as an indicator of batter success via the type of first-pitch strike that occurs in an at-bat. According to Juliano, the contrast between a swing-and-miss first strike and a looking first strike with respect to at-bat success is relatively meaningless; but not so for the foul ball when contrasted to the other types of strikes on the measure of batter OPS. Batter OPS was elevated in a meaningful way when the first two strikes resulted from foul balls.4
However, the OPS is a multivariate combinatory statistic that looks at batter on-base percentage plus batter slugging percentage rather than simple batting average.5 As per Juliano’s data, there is no significant difference in batting average between at-bats in which the first strike is a foul ball and those in which it’s a swinging or called strike.6 Thus, the act of hitting a foul ball for the first strike does not provide conclusive data when it comes to predicting hitting success via batting average. Perhaps as a single-event occurrence, the first-strike foul ball is not a large enough sample of within-at-bat events to arrive at some predictive power. However, the accumulation of foul balls within an at-bat, and whether foul balls compose the two strikes for any at-bat, is a far better candidate to make a determination of batter success.
With respect to pitcher fatigue, the traditional assessment variables for replacing a pitcher early in a game differ from that of later innings. Early on, managers consider variables such as starter effectiveness and the need for bullpen conservation. In later innings, their thinking tends toward relative effectiveness of the starter and direct consideration of his replacement.7 These traditional pitcher-replacement considerations appear to be based more on hunches than on data-driven decision making.
Perhaps the most famous foul-ball sequence in baseball history was the Dodgers’ Alex Cora’s marathon 18-pitch, 14-foul plate appearance in 2004 that ended with a home run against Matt Clement of the Chicago Cubs.8 And while Cora’s batting sequence may have provided a great deal of information on Clement’s status (e.g. fatigue, pitch-location difficulty, etc.), as earlier mentioned, sample size across multiple batters would be far more predictive with respect to foul-ball accumulation than would a single at-bat sequence of monumental foul-ball proportion. The current paper puts forth the argument that the foul ball is a ubiquitous data event that should garner more serious consideration in the pitching-change process. Foul balls are far more than simply a drag upon game flow. They are data-rich events that when assessed cumulatively and in tandem with knowledge of the historical data on hit probabilities, can provide valuable insight into pitcher fatigue and batter hit success.
Cumulative foul ball states: ITC vs OTC
In observing a foul ball in a game, there is a tendency to dismiss the occurrence as an irrelevant event—it’s a ball out of play that’s most often headed for the stands, and what reaction there is to the event is relegated to the excitement surrounding some fan acquiring a souvenir. Major league teams appear to take this “irrelevant event” perspective while failing to assess whether the event itself has some sort of informational value that might be gleaned for strategic advantage.
With respect to the game and its participants, the hidden strategic value of the foul ball is found within its role as an “indicator.” That role is revealed in the present study via data showing its cumulative occurrence and its contribution to the strike count relative to the overall existing count for the batter. There are two such “indicator” states that arise with foul balls. The first is when fouls account for the first two strikes—known as the “inside-the-count” (ITC) state. The second, known as the “outside-the-count” (OTC) state, is when the first two strikes are made up of swings and misses, called strikes, or some combination of the two, with the accumulation of foul balls occurring after these two strikes have been acquired by the batter.
Assumptions and Hypotheses
First, it is necessary to clarify two assumptions with respect to the foul ball and a comparison of its occurrence as an ITC vs OTC event. The first is the assumption that the accumulation of two ITC foul-ball strikes is related to poor pitching (e.g. fatigue) and the second is that ITC swing-and-miss/looking strike combinations are due to good pitching. In addition, the hybrid two-strike count combination comprising one foul ball and one swinging or called strike is assumed neutral—it does not imply such accumulation of strikes is due to either good or poor pitching, since it’s balanced and leans toward neither one. Due to this, these hybrid two-strike count combinations were not a focus of the investigation.
The primary research objective was to inquire about the probability that a hit will occur with respect to increasing foul-ball accumulation for [1] at-bat counts having two strikes from swing-and-miss/called-strike combinations; or [2] at-bat counts with two strikes resulting from foul balls. Modes of getting to first base such as walks, intentional walks, hit-by-pitch, or catcher interference were not of interest. Thus it was hypothesized that: [1] two-strike counts for at-bats where both strikes are foul balls would garner higher hit probabilities than would two-strike counts in at-bats where both strikes are swing-and-miss, called strikes, or some combination thereof; and [2] that hit probability would continue increasing as foul balls accumulate.
Method
Seventy-one years of Retrosheet data 1945–2015 were analyzed to assess the incidence of ITC foul-ball patterns vs. OTC foul-ball patterns with respect to hit probabilities.9 MySQL was utilized as the collective database to which Retrosheet data were imported, after which data were parsed using SQL (Structured Query Language) syntax within HeidiSQL front-end software interface to retrieve relevant Retrosheet event data.10 The range of database queries addressed two-strike counts of 0–2, 1–2, 2–2, and 3–2 for at-bats with accumulated foul ball counts from 1 to 5, for both ITC and OTC batter states.
Results
When looking at batter success as a function of accumulated foul balls across different counts, the OTC and ITC conditions demonstrate striking disparity with respect to batter success on a two-strike count. Figure 1 provides an overview of hit-success probabilities for both the OTC and ITC states. One of the most salient comparisons can be seen in Figure 1, where three non-strike foul balls have been accumulated within each of the OTC and ITC states—a contrast demonstrating a .211 hit success increase (.335 – .124 = .211) when the first two strikes of a hitter’s count are both foul balls (ITC) as opposed to when the first two strikes are both swing-and-miss or called strikes (OTC). The comparison with the greatest disparity involves at-bats in which four foul balls have been accumulated on an 0–2 count—an OTC (.079) vs ITC (.413) difference of .334.
It is also worth noting the drastic drop-off in Figure 1 with respect to the accumulation of five foul-balls in the IC condition. The reason for such a dramatic drop in the ITC condition to .066 (as seen in Table 2) is that although Figure 1 indicates five foul balls have been accumulated, there have actually been seven foul balls accumulated—the first two foul balls counted as strikes, and then five more were accumulated after the two fouls counting as strikes. This results in a dataset sample size issue; there is not enough historical data on seven foul balls accumulated over the course of an at-bat—where the at-bat results in a hit—to arrive at an adequate sample size.
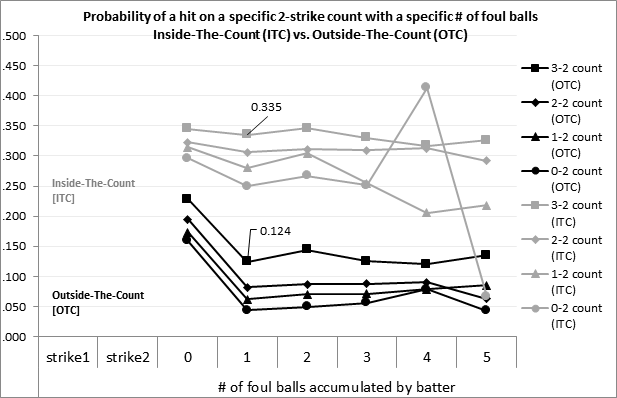
Figure 1. Hit probabilities for ITC and OTC states as a function of foul-ball accumulation.
When viewing Table 2 data of the OTC and ITC conditions, one can see an obvious decrease in hit probabilities as the accumulation of foul-balls increases. For example, with zero foul balls accumulated in the 3–2 count ITC condition (.345), every subsequent probability value for foul-balls accumulated, except for one (two foul-balls accumulated = .346) is smaller than this associated zero foul-balls accumulated probability value of .345. This pattern is pervasive; it occurs across nearly all OTC and ITC conditions as foul-balls are accumulated.
One explanation for this unusual pattern is the systematic increasing “rarity” of foul-ball events. As foul balls are accumulated in any at-bat, the number of historical at-bats representing those foul ball-accumulations in the data gradually decreases. So, for example, once foul-ball accumulation in an at-bat equals four, there are fewer instances in the historical data where a hit occurred after the accumulation of four foul balls than there would be for at-bats where hits occurred after the accumulation of only one foul ball—simply because it is rarer to accumulate four foul-balls in an at-bat than it is to accumulate only one. Such occurrence in the historical data introduces distortion in the analyses due to sample size differences. These sample size distortions affect the probability calculations as sample size representations for various events decrease or increase. In addition, one has to also consider “batter fatigue” as foul balls accumulate. Such at-bats that “drag on” with ever-increasing numbers of foul-balls accumulating can mentally and physically drain a batter, and thus may readily contribute to the decrease in probability of a hit for any at-bat where “X” number of foul-balls have occurred.
With respect to all foul ball accumulation states across all counts, the three-foul-ball accumulation at-bat was of particular interest for several reasons: [1] The frequency data for all counts within both the ITC and OTC states at the point of three foul balls accumulated were both tightly “clustered” and more evenly distributed so as to reflect a tighter range of within-state data variability; [2] there was clearly observable disparity between the ITC and OTC state hit probabilities at the point of three foul balls accumulated; and, most importantly, [3] the accumulation of three foul balls is not only more achievable as a realistic in-game scenario, the frequency count data as seen in Table 1 support this three foul-ball accumulation.
Table 1 presents the frequency tabulations for hitting success on two-strike counts within both ITC and OTC states coinciding with the accumulation of three foul balls. The Table 1 data yielded a significant Chi Square analysis result χ2 (3, N=16,415)=302.51, p< .00 that subsequently rejects a null hypothesis of independence of events.
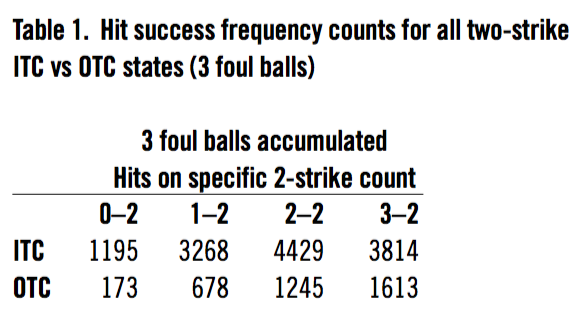
Table 1. Hit success frequency counts for all two-strike ITC vs OTC states (3 foul balls)
Table 2 provides the full range of probabilities for hit occurrences on various counts for all ITC and OTC states. The mean for all ITC counts in Table 2 is .291, and for all OTC counts is .102—the difference of which is .189. Perhaps most interesting is the hit disparity probabilities (Table 3), which demonstrate the magnitude of differences between the ITC and OTC states across the full range of two-strike counts.
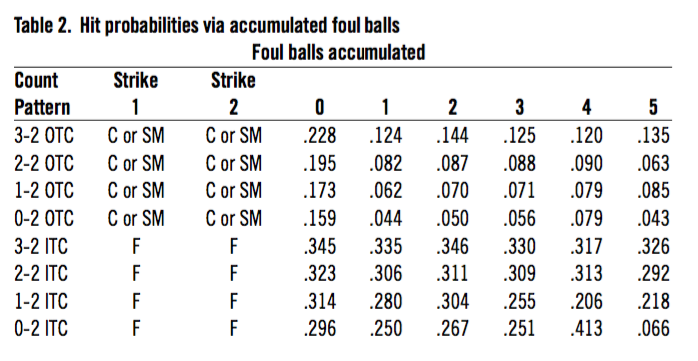
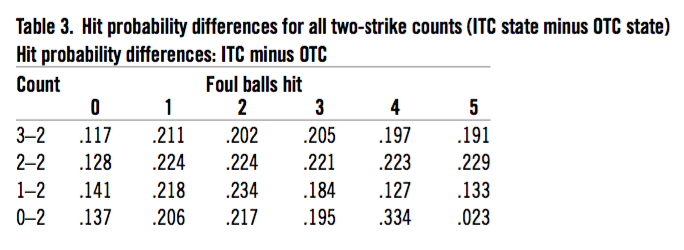
Table 3. Hit probability differences for all two-strike counts (ITC state minus OTC state).
Discussion
While the ITC/OTC data display striking differences with respect to hit probability within different event states of the game, the accumulation of five or even four foul balls, outside of having already accumulated two foul-ball strikes, is a relatively rare condition. Although these data do demonstrate the outright probability of success in various situations, other plausible contributing factors and explanations toward such outcomes warrant consideration as well.
It is indeed possible that the big picture when it comes to hitter success as per ITC vs OTC states may be multivariate in nature—a synchronous occurrence of the ITC state for any two-strike count; specific inning and ball-strike count data; and known pitcher characteristics all working together. Thus, when it comes to arriving at a unique pitching fatigue indicator as an emergent property of these combinatory states, one must consider the weightings of other variables in the event sequence as plausible contributors at some level.
In addition to the revealing hit probabilities from this data for two-strike ITC states, if one were to use such data as a decision-making catalyst regarding pitcher fatigue, it may be necessary to also consider influential factors from the opposition, such as the literal ability of some batters to get themselves into such ITC foul-strike conditions, or type of pitch and unique pitching style combined with unique hitting style—all of which may be contributing factors when it comes to generating states of the ITC type. Pitchers who work hitters in certain ways might indeed be contributing in some way to a greater manifestation of the hitter ITC state.
The a priori manner in which a batter decides to approach a specific pitcher may also be important as a contributor to ITC/OTC state of success or failure. For example, the concept of batter persistence in maintaining an at-bat by consistently fouling off pitches may have greater weight as an at-bat preservation mechanism in certain situations—such as how the result of the last game of the season can carry quite a different level of importance than the result of the first game, or how a runner in scoring position during a tie game in the bottom of the ninth may elicit a far higher level of such persistence than at any other time.
Nevertheless, variables such as pitching style, type of pitch, or batter approach cannot take away from the fact that the ITC/OTC probabilities give clear indication as to what outcome one can anticipate for each state probabilistically. It simply remains to be seen how other elements of variability such as pitcher characteristics, batter characteristics, game context and situation, or environmental factors contribute with respect to their weighting toward success or failure outcome in ITC or OTC states. Investigation of such variability and its influence is the next logical step in this research paradigm.
Conclusion
Despite its ubiquitous reputation as an impediment to game flow, the foul ball is a data-rich event that can serve as a valuable predictor in prelude to both hitter success and pitcher fatigue. The extended analysis of other factors—both random and fixed—in tandem with the current study could potentially aid in deriving predictive strategic tools (analogous to charts indicating when to attempt two-point conversions in a football game) that would provide immediate assistance in game-driven decision-making processes. In addition, it remains to be seen if the foul ball itself will become some sort of victim to strategic change within the game of baseball. Ultimately, the present study reveals that the foul ball event, as a critical indicator of performance, should not be limited, pruned, or morphed under rules of the game, but rather capitalized upon strategically as a tool of foresight into human athletic performance.
JEFFREY N. HOWARD is currently an Associate Professor of psychology at Northern State University in Aberdeen, South Dakota. Dr. Howard received his Ph.D in Human Factors Psychology from Wichita State University. His research interests in addition to baseball include music-cognition, decision-making, and cross-sensory modality investigations. He also holds master’s degrees in clinical and experimental psychology, as well as a bachelor’s degree in radio-television journalism.
Notes
1. Jayson Stark, “MLB says new rules speeding up game times,” ESPN.com, April 13, 2015, http://espn.go.com/espn/print?id=12680681, accessed September 20, 2015.
2. Brian Costa, “Does Baseball Have to Be So Slow?” Wall Street Journal, May 1, 2014, http://www.wsj.com/articles/ SB10001424052702303948104579534352400123072, accessed September 25, 2015.
3. Retrosheet, http://www.retrosheet.org/game.htm, accessed March 1, 2015.
4. William Juliano, “Does Type of First Pitch Strike Influence At Bat Results?” The Captain’s Blog, September 25, 2012, http://www.captainsblog.info/2012/09/25/does-type-of-first-pitch-strike-influence-at-bat-results/17572/, accessed September 15, 2015.
5. Fangraphs, “OPS and OPS+,” http://www.fangraphs.com/library/offense/ops/, accessed September 30, 2015.
6. Juliano, “Does Type of First Pitch Strike Influence At Bat Results?”
7. Gartheeban Ganeshapillai, John Guttag, “A Data-driven Method for In-game Decision Making in MLB” Proceedings of the 19th ACM SIGKDD international conference on Knowledge discovery and data mining (2013): 973–79. Available online via MIT Sloan Sports Analytics Conference at http://www.sloansportsconference.com/wp-content/uploads/2014/02/2014_SSAC_Data-driven-Method-for-In-game-.Decision-Making.pdf.
8. Jon Weisman, “18 Again! Ten years later, Alex Cora’s at-bat remains a wonder.” Dodgers Insider, May 12, 2014, https://dodgers.mlblogs.com/ 18-again-ten-years-later-alex-coras-at-bat-remains-a-wonder-360e01acc06, accessed March 18, 2018.
9. Retrosheet.
10. Ansgar Becker, “HeidiSQL MySQL server interface tool,” 2015, http://www.heidisql.com/, accessed November 20, 2015.