

Home Runs and Strikeouts: Another Look
This article was written by Douglas Jordan
This article was published in Fall 2018 Baseball Research Journal
Introduction
 The 2017 MLB season set records for both home runs (6,105) and strikeouts (40,104). Conventional wisdom would suggest that this is not a coincidence. The argument is that players don’t mind striking out more often if they also hit more home runs. The raw data for these two parameters are easily plotted over time to show periods of strong offense (the 1920s and late 1990s) or strong pitching (the 1960s, around 2010).1 However, additional insight into the relationship between home runs and strikeouts can be gained by relating both home runs and strikeouts to at-bats. This can be done in aggregate for baseball as a whole, in aggregate for a single player’s career, or for individual players for a single year. The purpose of this article is to examine the relationship between home runs and strikeouts, after both parameters are adjusted for at-bats. All the data used for the calculations in this article are from Baseball-Reference.com.
Checking the Conventional Wisdom
The conventional wisdom suggests that there should be a positive relationship between the number of home runs hit and the number of strikeouts. Therefore, strikeouts should increase as the number of home runs increases. Data for the 2017 season for all batters with more than 400 at-bats are used to test this hypothesis. The results are shown in Figure 1.
Figure 1: K vs. HR for players with >400 AB, 2017
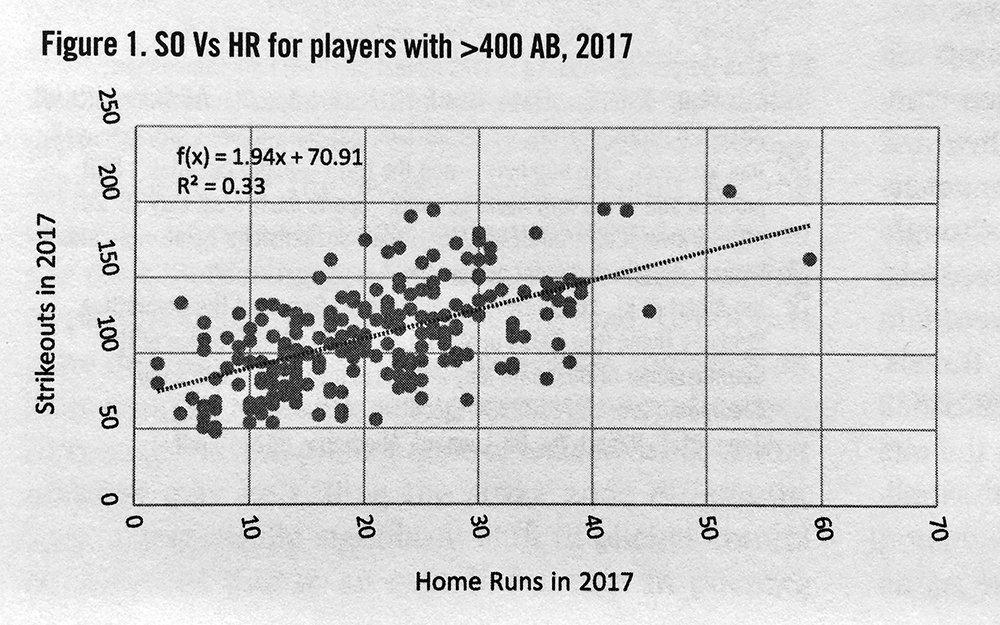
A least-squares regression of strikeouts against home runs shows that the relationship is characterized by the equation Strikeouts = 1.9 x Home Runs + 71.
The coefficient of 1.9 is statistically significant at the 1 percent level and the coefficient of determination (the R-squared value) is 0.33.
Similar results are found using 2016 data. These results support the conventional wisdom that there is a positive relationship between home runs and strikeouts.
Adjusting for At-Bats
Additional insight into home runs and strikeouts over time can be gained by adjusting each of them by at-bats. This is done by dividing total at-bats by home runs and by strikeouts. For example, in 2017 major-league batters hit 6,105 home runs in 165,567 at-bats for an AB/HR variable of 27.1. There were 40,104 strikeouts, so the variable AB/K was 4.1. A plot of these variables starting in 1903 is shown in Figures 2 and 3. At-bats per home run are discussed first.
Figure 2. MLB, AB/HR: 1903–2017
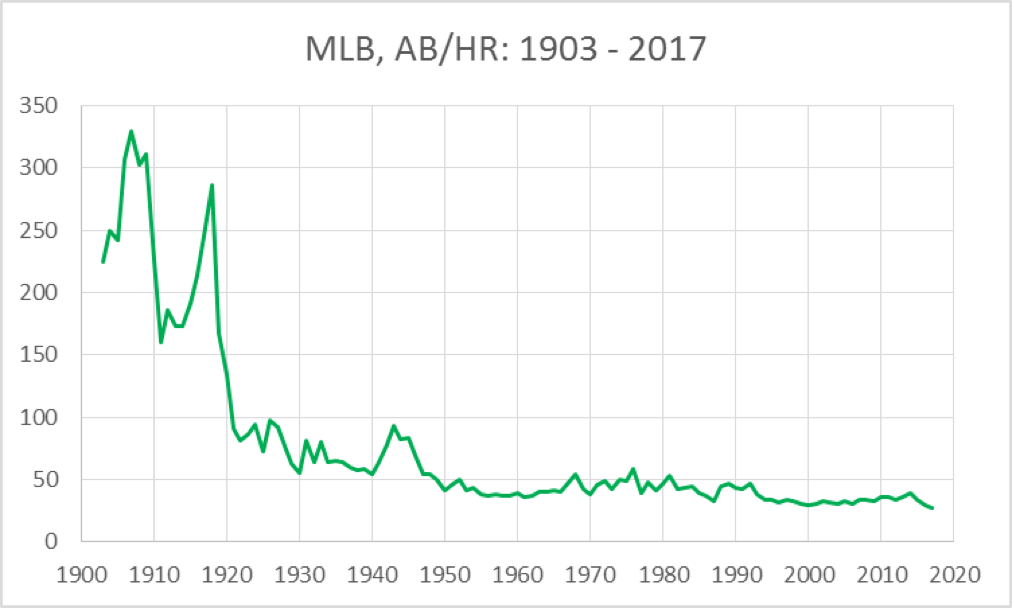
First, smaller numbers are better in Figure 2, since a smaller number means that it took fewer at-bats to produce a home run. Between 1903 and 1918, hitters had between 160 and 329 at-bats per home run. No wonder this is referred to as the Deadball Era. The figure stood at 286 in 1918 but declined precipitously over the next three years,as offense increased dramatically, to 91 in 1921. AB/HR continued to decline at a slower rate (with the exception of an uptick during the World War II years) until 1962, when it bottomed at 37. As pitching gained prominence during the 1960s, AB/HR increased to 59 in 1976. Since that year, AB/HR have declined by about half to 27 in 2017. But it should also be noted that, in spite of the record number of home runs hit in 2017, and the steady increase in home run totals over the past few years, the AB/HR number in 2017 (27) is not very much below the AB/HR figure of 29 in 2000, at the height of the steroid era.
Figure 3: MLB, AB/SO: 1903–2017
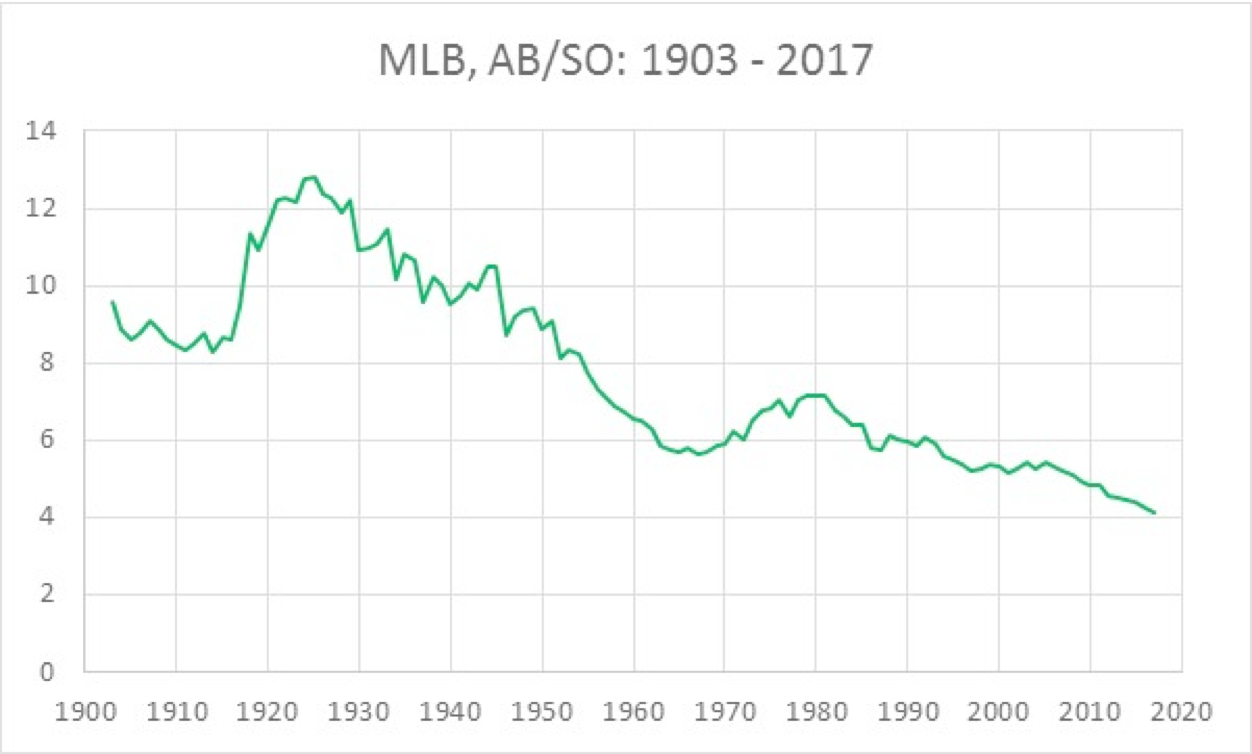
The AB/K data are shown in Figure 3. In this case, however, smaller numbers indicate poorer performance, because it means that there were fewer at-bats between each strikeout. Not surprisingly, given the positive statistical relationship between home runs and strikeouts, the AB/K graph is similar to the AB/HR graph. AB/K peaked at 12.8 in 1925 and has declined since then to 4.1 AB/K in 2017. There was an increase between the mid-1960s and 1980, but with the exception of that time period, the trend has been downward. The 2017 number of 4.1 is surprisingly low. It means that about 25 percent of at-bats result in a strikeout. Clearly, there is little stigma attached to striking out in the modern game.
Combining AB/HR and AB/K
The two parameters, AB/HR and AB/K, can be examined jointly in order to compare the effectiveness of power hitters. All other things being equal, since strikeouts are almost always a nonproductive at-bat, a slugger who strikes out less frequently is preferable to one who strikes out more frequently. Therefore, subtracting AB/K from AB/HR is a measure of the effectiveness of power hitters that includes an adjustment for how frequently they strike out. Let’s call this measure HRKAB, which you’re free to pronounce as either “her cab” or “home run cab.” The lower the number, the better, since a smaller AB/HR figure means more frequent home runs and a higher AB/K figure means the hitter strikes out less frequently. The difference will get smaller as AB/HR decreases and AB/K increases.
The 2017 home run leader, Giancarlo Stanton, is used to demonstrate the calculations. Stanton had a historic 2017 campaign, hitting 59 home runs. He accomplished this feat in 597 at-bats while also striking out 163 times. Therefore, his AB/HR and AB/K numbers are 10.12 and 3.66 respectively. The difference between these numbers is his HRKAB, 6.46. This number means little by itself, but when compared to other power hitters, it gives a measure of the effectiveness of one power hitter compared to another. Table 1 compares Stanton’s numbers to the 10 players with the next highest number of home runs in 2017.
Table 1: 2017 Season, HRKAB for the top 11 home run hitters
|
At-bats |
HR |
AB/HR |
K |
AB/K |
HRKAB |
|
|
Giancarlo Stanton |
597 |
59 |
10.12 |
163 |
3.66 |
6.46 |
|
Aaron Judge |
542 |
52 |
10.42 |
208 |
2.61 |
7.82 |
|
J.D. Martinez |
432 |
45 |
9.60 |
128 |
3.38 |
6.23 |
|
Khris Davis |
566 |
43 |
13.16 |
195 |
2.90 |
10.26 |
|
Joey Gallo |
449 |
41 |
10.95 |
196 |
2.29 |
8.66 |
|
Cody Bellinger |
480 |
39 |
12.31 |
146 |
3.29 |
9.02 |
|
Nelson Cruz |
556 |
39 |
14.26 |
140 |
3.97 |
10.28 |
|
Edwin Encarnacion |
554 |
38 |
14.58 |
133 |
4.17 |
10.41 |
|
Logan Morrison |
512 |
38 |
13.47 |
149 |
3.44 |
10.04 |
|
Mike Moustakas |
555 |
38 |
14.61 |
94 |
5.90 |
8.70 |
|
Justin Smoak |
560 |
38 |
14.74 |
128 |
4.38 |
10.36 |
The HRKAB numbers in Table 1 show that Stanton’s 6.46 is better than all but one of the players who hit 38 or more home runs in 2017. J.D. Martinez had a better mark with 6.23. Given the historic nature of the numbers that Stanton put up, this shows that Martinez also had an excellent season even though he trailed Stanton by 14 home runs. This is an example of the advantage of using HRKAB rather than just home runs as a measure of power hitter effectiveness. Martinez’s total of 45 home runs is not that impressive by itself, but using HRKAB shows that his season was comparable to Stanton’s.
Aaron Judge also had a historic season, setting a home run record for rookies. But his 208 strikeouts were the most in baseball, and his 2.6 AB/ K shows that he struck out more frequently than every third at-bat. In comparison, Mike Moustakas hit 38 home runs (14 fewer than Judge), but he struck out less than half as frequently as Judge, with an AB/K figure of 5.9. This gave Moustakas a HRKAB of 8.7, which is not too far above the 7.8 that Judge had. This is another illustration of why using HRKAB can yield greater insight than home run totals by themselves.
Table 1 shows the top 11 players in terms of home runs. It would appear that Khris Davis, with his 43 homers, is a much better power hitter than Michael Conforto (not shown in Table 1), who hit 27. However, HRKAB allows the two hitters to be compared on an apples-to-apples basis. In this case, Davis has a HRKAB figure of 10.26 while the same figure for Conforto is 10.51. So, despite the large difference in total home runs, Conforto is about as effective a hitter as Davis is.
Similarly, HRKAB can be used to identify effective power hitters even if they don’t have impressive home run totals. This is easily done by ranking hitters in terms of HRKAB. Table 2 shows the top 10 list for 2017 among all players who hit at least 20 home runs.
Table 2: 2017 Season, top 10 in HRKAB for players with at least 20 home runs
|
At-bats |
HR |
AB/HR |
K |
AB/K |
HRKAB |
|
|
Matt Olson |
189 |
24 |
7.88 |
60 |
3.15 |
4.73 |
|
J.D. Martinez |
432 |
45 |
9.60 |
128 |
3.38 |
6.23 |
|
Giancarlo Stanton |
597 |
59 |
10.12 |
163 |
3.66 |
6.46 |
|
Mike Trout |
402 |
33 |
12.18 |
90 |
4.47 |
7.72 |
|
Aaron Judge |
542 |
52 |
10.42 |
208 |
2.61 |
7.82 |
|
Joey Gallo |
449 |
41 |
10.95 |
196 |
2.29 |
8.66 |
|
Mike Moustakas |
555 |
38 |
14.61 |
94 |
5.90 |
8.70 |
|
Joey Votto |
559 |
36 |
15.53 |
83 |
6.73 |
8.79 |
|
Josh Donaldson |
415 |
33 |
12.58 |
111 |
3.74 |
8.84 |
|
Cody Bellinger |
480 |
39 |
12.31 |
146 |
3.29 |
9.02 |
The first thing to note about Table 2 is that there are four players in the top 10 who are not among the top 11 home run hitters shown in Table 1. Since HRKAB is a measure of power hitter effectiveness, it is not surprising that Mike Trout, Joey Votto, and Josh Donaldson appear on the list when ranked this way. All three are former MVPs who are considered among the best players in the game. Votto strikes out the least frequently, with a mark of 6.7 AB/K. Another excellent young player, Bryce Harper, is not shown in Table 2 simply because the list is only the top 10. Harper is number 12 at 10.24 HRKAB.
There is one big surprise at the top of the list. The player with at least 20 home runs with the best HRKAB figure is Matt Olson. Olson is not exactly a nationally known player. The 2017 season was his second year with the Oakland A’s, and he only started playing regularly in June. He had only 189 at-bats in 59 games, but his ratio of AB/HR was 7.88 (better than Stanton at 10.1) and his HRKAB was 4.73 (better than Stanton at 6.5). The sample size is too small to draw meaningful conclusions, but Olson even being on the list shows the advantage of using HRKAB as a measure instead of just the absolute number of home runs. HRKAB shows that Olson has the potential to be a very effective, possibly great, home run hitter.
Historic Comparisons
Just as HRKAB can be used to compare power hitters in a given season, the measure can also be used to compare players across time. For example, Stanton’s 6.46 is one of the best numbers for 2017, but how does it compare to other great power hitters? In order to answer this question, HRKAB is calculated each season for every player who hit more than 580 career home runs. The 11 players in this group are the epitome of power hitters. Their HRKAB results are therefore a good baseline for comparison. The data for the season in which each of these players reached his carer high in home runs are shown in Table 3.
Table 3: HRKAB for top 11 career HR hitters as of 2017 in best HR season
|
Career HR |
Year |
At-bats |
HR |
AB/HR |
K |
AB/K |
HRKAB |
|
|
Barry Bonds |
762 |
2001 |
476 |
73 |
6.52 |
93 |
5.12 |
1.40 |
|
Hank Aaron |
755 |
1971 |
495 |
47 |
10.53 |
58 |
8.53 |
2.00 |
|
Babe Ruth |
714 |
1927 |
540 |
60 |
9.00 |
89 |
6.07 |
2.93 |
|
Alex Rodriguez |
696 |
2002 |
624 |
57 |
10.95 |
122 |
5.11 |
5.83* |
|
Willie Mays |
660 |
1965 |
558 |
52 |
10.73 |
71 |
7.86 |
2.87 |
|
Ken Griffey Jr. |
630 |
1997 |
608 |
56 |
10.86 |
121 |
5.02 |
5.83 |
|
Ken Griffey Jr. |
630 |
1998 |
633 |
56 |
11.30 |
121 |
5.23 |
5.83 |
|
Albert Pujols (a) |
614 |
2006 |
535 |
49 |
10.92 |
50 |
10.70 |
0.22* |
|
Jim Thome |
612 |
2002 |
480 |
52 |
9.23 |
139 |
3.45 |
5.78* |
|
Sammy Sosa |
609 |
1998 |
643 |
66 |
9.74 |
171 |
3.76 |
5.98 |
|
Frank Robinson |
586 |
1966 |
576 |
49 |
11.76 |
90 |
6.40 |
5.36* |
|
Mark McGwire |
583 |
1998 |
509 |
70 |
7.27 |
155 |
3.28 |
3.99* |
*Career best; (a) Active
A natural place to start is to look at the seasons that immediately come to mind when thinking about great home run seasons. Babe Ruth’s best year in terms of home runs is 1927, when he hit 60 balls out of the park. He had 540 at-bats that year so he averaged a home run exactly every nine at-bats. He struck out roughly every six at-bats and finished with 2.93 HRKAB. Interestingly, this is not Ruth’s best year in terms of HRKAB. In 1931 he did even better with a figure of 1.14. Roger Maris (not shown in Table 3 because his career total for home runs is 275) had a mark of 0.87 HRKAB when he broke Ruth’s record in 1961 with 61 home runs. That was the record until 1998, when Mark McGwire and Sammy Sosa orchestrated one of the most famous home run races in baseball history. Both players broke Maris’ record, with McGwire hitting 70 home runs and Sosa hitting 66. McGwire also beat Sosa in terms of HRKAB that year, with 3.99 to Sosa’s 5.98. Three years later, Barry Bonds broke McGwire’s record when he hit 73 home runs. Bonds hit a homer at the impressive rate of one every 6.5 at-bats that year and finished with a mark of 1.40 HRKAB.
As great as all of these seasons are, in terms of the total number of home runs, they are not the best seasons in Table 3 in terms of HRKAB. The best season in the table by this measure is the 0.22 that Albert Pujols had in 2006. That was not a product of home run frequency. Pujols needed more than 10 at-bats to hit a home run that season, but his HRKAB number was very low because of the low frequency with which he struck out. Pujols struck out every 10.7 at-bats. That’s roughly two to three times less frequent than many of the other AB/K numbers in Table 3, and indicates that Pujols — despite playing in a higher-strikeout era than any of the others in that group — did not need to tolerate a lot of strikeouts in order to hit a lot of home runs.
An HRKAB number so close to zero raises a question: Have there been any power hitters who struck out less frequently compared to the rate at which they hit home runs? Or in terms of this article, has anybody had a negative HRKAB figure? This question is examined by expanding the pool of players to those who have hit more than 520 career home runs and requiring a minimum of 100 at-bats to qualify. This doubles the size of the pool of players to 22. Take a minute to think about the answer before reading further.
The answer is yes, there have been two players in this expanded group who accomplished the feat. Bonds is one of them. He actually had a better season in 2004 in terms of HRKAB than he did in 2001. He hit 45 home runs in 2004, but his HRKAB figure is -0.81. The only other player to have a negative number is, not surprisingly, Ted Williams, who did it three times, in 1941, ’50, and ’55, when he had HRKAB figures of -4.56, -3.98, and -1.90 respectively. And, just like Pujols in 2006, he did it by rarely striking out. He only struck out 27, 21, and 24 times respectively those seasons, resulting in AB/K marks of 16.89, 15.90, and 13.33 respectively.
Conclusion
The purpose of this article is to explore power hitter effectiveness. To do so we introduced the metric HRKAB. While we acknowledge there are other aspects of total hitting production not included in HRKAB, it improves on the simple measure of total home runs by adjusting for the frequency of home runs per at-bat and by subtracting the strikeout rate, because a strikeout is usually a non-productive out. HRKAB allows us to compare hitters on an apples-to-apples basis. For example, in 2017, Giancarlo Stanton hit 59 home runs and had an HRKAB of 6.46. This number is worse than the 1.40 HRKAB of Barry Bonds in 2001, the year he hit 73 home runs.
DOUGLAS JORDAN is a professor at Sonoma State University in Northern California where he teaches corporate finance and investments. He’s been a SABR member since 2012. He runs marathons when not watching or writing about baseball. You can contact him at douglas.jordan@sonoma.edu.
Notes
1For example, Michael Bein has a website that allows many batting and pitching statistics since 1900 to be easily plotted. See http://michaelbein.com/baseball.html; For an interesting discussion of the increase in offense that occurred between 1915 and 1920, see http://web.colby.edu/baseball/files/2016/04/Final_LiveBall_Post.pdf; Cory Wagner discusses MLB home run totals between 1990 and 2014 in the following post: https://www.sportingcharts.com/articles/mlb/total-home-runs-in-major-league-baseball-since-1990.aspx; For a good discussion of how pitching dominated in the 1960s, see http://www.thisgreatgame.com/1968-baseball-history.html; David Schoenfield analyzes why pitching dominated in the 2014 season in this post: http://www.espn.com/mlb/story/_/id/12842711/mlb-hurlers-rise-dominance.