
Hype and Hope: The Effect of Rookies and Top Prospects on MLB Attendance
This article was written by Russell Ormiston
This article was published in Spring 2016 Baseball Research Journal
In the Spring 2014 edition of the Baseball Research Journal, I authored a study that examined within-season attendance patterns attributable to the homegrown status of the home team’s starting pitcher (Ormiston, 2014a). While the analysis failed to find a relationship between homegrown pitchers and game attendance, a control variable in the model—the rookie status of the game’s starting pitchers—had an unexpectedly positive and statistically significant effect on attendance. This outcome motivates the current study, as academic research has yet to directly examine the relationship between rookie players and game attendance in Major League Baseball.
The conspicuous absence of research on the attendance effects of rookies is surprising given the celebrated rookie seasons of Mark Fidrych (1976), Fernando Valenzuela (1981), and others who are known to have drawn huge crowds on the days of their starts. What is unclear, however, is whether fan responsiveness is limited to a select few rookie hurlers in history or whether it extends—albeit in a lesser degree—to other key rookies, prospects, and draft picks whose hype may precede them in the major leagues and whose presence may offer hope for a better future for their respective teams.
To address this question, this paper examines the relationship between rookie pitchers and individual game attendance in Major League Baseball between 1969–2013. In particular, this study explores the attendance effects of rookie hurlers’ performance, pre-season prospect ranking, and draft pick status in an attempt to understand fan responsiveness to the sport’s top up-and-coming players. Utilizing the largest known sample employed in the literature—data from 95,576 MLB games across 45 seasons—this paper offers the potential to detect minute but statistically significant attendance effects attributable to fan responsiveness to the future promise offered by an organization’s top prospects and rookie hurlers.
Background
While the academic literature on the determinants of MLB game attendance has yet to feature a study specifically examining fan responsiveness to the sport’s top rookies and prospects, it is relatively straight-forward to deduce from the existing research that celebrated young starting pitchers may have a sizeable effect on the number of tickets sold. First, many analyses in the literature have implicitly demonstrated that starting pitcher characteristics impact game attendance, as such studies have routinely included control variables for pitchers’ performance—often measured by wins and losses—and race/ethnicity (e.g., Hill, Madura and Zuber, 1982; Bruggnik and Eaton, 1996; Raschner, 1999; McDonald and Raschner, 2000; Butler, 2002). While such studies are inconsistent in regard to which variables have statistically significant effects on attendance, there is enough evidence to acknowledge the role that starting pitcher characteristics have on MLB game attendance.
While the studies mentioned above did not particularly focus on the relationship between starting pitcher characteristics and game attendance, this association represented the fundamental question underlying Ormiston (2014b). Developing a pair of metrics to estimate pitchers’ star power, this study directly examined the relationship between game attendance and the star power and performance of each team’s starting hurlers. The results demonstrated a positive relationship between the star power of both the home and visiting team’s starting pitchers and game attendance, an effect that was statistically significant with 99.9 percent confidence. The results also indicated a strong and positive association between attendance and current performance—as measured by Wins Above Replacement (WAR)—of the home team’s starting pitcher.
While Ormiston (2014b) demonstrated that a game’s starting pitchers can have a considerable effect on game attendance, research exploring fan responsiveness to rookies and prospects has been limited. Outside of the inclusion of a control variable for rookies in Ormiston (2014a), the only known study to focus on this issue—Gittar and Rhoads (2011)—examined whether having one of baseball’s top 100 prospects increased minor league teams’ season-average attendance. Hypothesizing that local fans would be interested in seeing baseball’s next generation of stars before they reached the majors, the study used Baseball America prospect rankings and minor-league seasonal attendance data from 1992–2009. The results suggested only a modest attendance effect, as only baseball’s elite prospects (top five overall) had any statistically significant effect and that was limited to the triple-A level.
While Gittar and Rhoads (2011) found only a minimal effect of prospects on minor-league attendance, there are reasons to believe that the attendance effects may be stronger at the MLB level. First, due to stipulations in the MLB collective bargaining agreement, elite prospects that burst onto the scene are contractually bound to their respective major league teams for, at minimum, six years. Celebrated prospects, therefore, can offer a fan base considerable hope of a brighter future. In contrast, top-end prospects rarely stay with a particular minor-league team for more than one season before getting promoted to a new level and, thus, cannot offer fans that same potential.1 Second, the hype surrounding baseball’s elite prospects typically reaches its apex when a player is called up to the major leagues, implying that the attendance effect may be largest during a player’s first few appearances with his MLB club.
Data and Model
To examine the potential attendance effects of the rookie and prospect status of both teams’ starting pitchers in Major League Baseball, this study utilizes game log data available at Retrosheet.2 These game logs provide a substantial amount of information on every MLB contest since 1876, including the game’s date, location and, starting in 1914, the names of both starting pitchers. This paper focuses on baseball’s Divisional Era from 1969–2013, including nearly every game from this period, excluding only those played at a stadium other than a team’s normal park in a given season and games in which attendance is not available.3 This results in an initial sample of 97,572 games, one of the largest data sets employed in the literature to date.
The empirical model employed in this study represents a variation on the approach utilized by Ormiston (2014a, 2014b) and summarized below, with i and t denoting the home team and season, respectively, and g representing the particular game within a particular it home team’s season:

One of the critical elements to this model is that it utilizes a team-season fixed effects approach, as it includes an indicator variable (αit) to denote each home team’s season (e.g., an indicator variable that represents all 81 home games of the 1987 Detroit Tigers). These team-season indicator variables are used to capture all game-invariant characteristics of an individual team’s season, including ticket prices, prior years’ success and the home city’s population and economic vitality. The resulting coefficients in the model, therefore, represent the attendance fluctuations within a particular team-season attributable to available game-variant characteristics.4,5
The variables of central importance to this study reside in the PitcherCharacteristicsitg vector. In an initial model, this study includes an indicator variable capturing the rookie status of the home and visiting teams’ starting pitchers to estimate the average impact of a rookie hurler on attendance.6 Subsequent models include additional variables designed to examine the moderating attendance effects of the hype and hope generated by a pitcher’s pre-season prospect ranking, draft pick status and rookie-season performance. To evaluate a rookie hurler’s prospect status, this paper employs the pre-season rankings of Baseball America, a leading industry publication, which has produced lists of baseball’s overall top 100 prospects (1990–2013) and each MLB team’s top 10 prospects (1983–2013) for a significant portion of the time period studied.7 In addition to prospect rankings, this paper additionally identifies the 13 pitchers who were the number one overall pick—and thus hyped and celebrated in the media—in baseball’s annual amateur draft and started at least one MLB game between 1969–2013.8 Finally, attendance effects driven by pitcher performance—not just rookies—are captured through the use of a hurler’s current-season wins above replacement (WAR) total. While using current-season WAR introduces endogeneity into the model, other approaches (e.g., prior season’s WAR) underrepresent rookie performance at the time of each start and produce considerable upward bias in the rookie coefficients.
In addition to performance, this study also controls for all starting pitchers’ star power at the time of each start as estimated by the age-adjusted star power measure originally introduced by Ormiston (2014a). This value represents a ratio of the linear sum of a pitcher’s accomplishments—All-Star Game appearances, no-hitters, post-season awards, etc.—at the time of each start to their “potential experience,” or the difference between the pitcher’s age and 17.9,10 While this metric has its flaws—with implications to be discussed later in the paper—it is the best available, objective estimate of star power given that it produces a parabolic arc of stardom for typical pitchers and meets a priori expectations of relative star power across players.11
Beyond pitcher characteristics, the specification of the attendance model above is designed to capture all available game-variant information within a particular team-season. First, GameCharacteristicsitg includes the month, day of the week, time of the day, and three indicator variables denoting whether a contest was a team’s home opener, a doubleheader or at a new stadium that was introduced mid-season. The GameCompetitivenessitg vector encompasses the number of games the home team is over .500 at the time of the game, the difference between the number of games over .500 of the home and visiting club (to measure game uncertainty), the number of games back within the division both clubs are at game time and the average star power of other pitchers in the series. Finally, the OpponentCharacteristicsitg vector includes a series of indicator variables to denote an interleague game, an intradivision contest and whether the opposing team was World Series champion or in the playoffs over the last three seasons. This vector also features individual team dummies for each opponent given that some visiting teams (e.g., New York Yankees, Chicago Cubs) will boost attendance regardless of their level of competitiveness.
To estimate this model, censored normal fixed effects regression is utilized in order to account for right-censored attendance data attributable to sellouts, an approach utilized in Meehan, et al. (2007), Lemke, et al. (2010) and Ormiston (2014a, 2014b). In the absence of a published list of MLB sellouts and the fact that the announced attendance at most known sellouts—such as during the streaks of the Cleveland Indians (1995–2001) and Boston Red Sox (2003–13)—does not come close to stadium capacity, this study identifies sellouts by whether game attendance represents 90 percent of capacity. While this likely leads to erroneously labeling some games as sellouts, alternative approaches—such as 95 percent—fail to adequately identify a significant number of known sellouts. The use of the 90 percent threshold results in 25 team- seasons in which the home team is considered to have sold out every game. Since the censored-normal regression approach considers all observations from these team-seasons to be right-censored data, these team-seasons are excluded from the analysis, resulting in an amended sample size of 95,576 games.
Results
Before presenting the regression estimates of the attendance model, Table 1 compares the average attendance in games started by rookies and non-rookies from 1969–2013. On the basis of home team’s starting pitcher, average attendance in games started by rookies (24,054) was considerably less than games started by non-rookies (25,718); attendance was also slightly lower in games started by rookie pitchers by the visiting team. While the results of Table 1 may provide initial evidence against a rookie attendance premium in Major League Baseball, a summary approach ignores fundamental differences among rookie pitchers and, perhaps most importantly, the teams that more often employ them.12
Table 1. Average Game Attendance by Starting Pitchers’ Rookie Status, 1969–2013

(Click image to enlarge.)
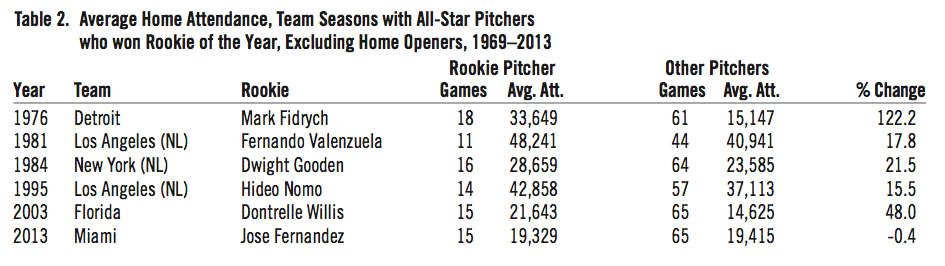
As an illustration of the potential attendance impact of rookie pitchers in Major League Baseball, Table 2 presents the average home attendance in team-seasons featuring perhaps the six most celebrated rookie pitchers in the Divisional Era: the half-dozen hurlers who were named All-Stars and won the Rookie of the Year award in the same season.
(Click image to enlarge.)
On the surface, the results demonstrate that five of these six hurlers had a considerable impact on game attendance in their rookie campaigns. For example, attendance at Detroit Tigers’ home games in 1976—excluding the home opener—was 33,649 in the 18 games started by Mark Fidrych and just 15,147 in games started by other pitchers, amounting to a 122.2 percent increase in attendance to watch the charismatic right-hander. Attendance at the home starts of four other pitchers—Fernando Valenzuela (1981), Dwight Gooden (1984), Hideo Nomo (1995), and Dontrelle Willis (2003)—also exhibited double-digit percent increases when compared to other hurlers on their respective clubs. While the rookie starts of Jose Fernandez (2013) seemed to have little impact on attendance, an overview of Table 2 implicates a potential relationship between game attendance and select rookie hurlers.
To more carefully examine the impact of rookie starting pitchers on game attendance in Major League Baseball from 1969–2013, Table 3 presents the censored-normal regression estimates of the model described above.
- Download the PDF: Click here to download Table 3: The Effect of Rookie Starting Pitchers on In(Game Attendance), 1969–2013
Model 1 demonstrates that, all else equal, a rookie starting pitcher for the home team is expected to increase game attendance by 0.83 percent—about 208 fans given an average crowd of 25,000—with the effect statistically significant with at least 95 percent confidence. A rookie starting pitcher for the visiting team is posited to have little, if any, effect on game attendance, as the coefficient is minimal (β=-0.0028) and is not statistically significant at any reasonable level. Consistent with prior studies, the results of Model 1 also demonstrate that the star power of both teams’ starting pitchers significantly affect game attendance, with the coefficients suggesting that an additional 0.1 in star power—equivalent to a 27-year-old hurler being named to an all-star team—is associated with a 1.1 percent increase in attendance. Finally, the results reflect a positive and statistically significant relationship between game attendance and the current performance of the home team’s starting pitcher, with one additional unit of WAR associated with a 0.40 percent increase in tickets sold.
While the focus of this paper is on the attendance effect of rookie starting pitchers, it is important to note that the remaining coefficients in Model 1 of Table 3 are all of the expected signs, exhibit reasonable magnitude and most are statistically significant, an unsurprising outcome given the large sample utilized in this study. Predictably, the success of the home team—as measured by games over .500 and games back in the division—has a powerful influence on game attendance; for example, each game over .500 for the home team is expected to increase attendance by 1.2 percent. The coefficient on the difference in games over .500 between the home and visiting team is negative and statistically significant; this suggests that games featuring a relative mismatch will likely draw fewer fans compared to a closely-matched contest. The results of Model 1 also demonstrate that fans respond favorably to interleague play, intradivision games, home openers, doubleheaders, recent success by the visiting club, and situations where other star pitchers are starting in a series (perhaps denoting an important series or a star-laden visiting club overall). The coefficients on the visiting team dummy variables are suppressed for space reasons, but the results predictably indicate the highest attendance when the New York Yankees, Los Angeles Dodgers, Chicago Cubs or Boston Red Sox are the visiting team. Finally, attendance is estimated to follow expected patterns by month—peaking from June-August—and by day/time of the game (weekends produce the highest attendance). In sum, the reasonableness of the results match a priori expectations of Major League Baseball attendance and, thus, lend credibility to the methodology used to estimate the attendance effects of rookie starting pitchers.
Returning to the primary question of this study, the results of Model 1 indicate a positive and statistically significant relationship between game attendance and rookie starting pitchers for the home team. However, there is concern that this overall impact is largely driven by the “manias” that surrounded many of the six celebrated hurlers identified in Table 2. To test these distributional concerns, Model 2 includes an indicator variable capturing the rookie-season starts of these six pitchers. The results of Model 2 confirm that these celebrated hurlers had a considerable impact on game attendance during their rookie seasons, with their starts increasing home and road attendance by 33.9 (β=0.2910) and 20.1 (β=0.1827) percent, respectively, over the standard rookie premium, with both effects being statistically significant with at least 95 percent confidence.13 Perhaps more importantly, the coefficient on the rookie status of the home team’s starting pitcher declines in magnitude and is no longer statistically significant at any reasonable level, thereby confirming that the significant relationship found in Model 1 was largely driven by a celebrated few rookie hurlers.


Given the implication that fan responsiveness to rookie starting pitchers is limited to only a select few hurlers, Model 3 expands the analysis by separating all other rookie pitchers—besides the six previously identified—into one of four categories based on their rookie-season wins above replacement value. The results demonstrate a positive and statistically significant attendance premium exists for rookie pitchers—both at home and on the road—beyond the six celebrated rookie hurlers discussed earlier, but the effect is limited only to the starts of rookie pitchers who posted a WAR of 5.0 or larger in their rookie season. Beyond this select group, however, the results fail to demonstrate any significant relationship between rookie pitchers and game attendance.
The pattern demonstrated in Table 3 suggests that fan responsiveness is limited to rookie starting pitchers who display a particular caliber of excellence with their on-field performance. While this effect may be indicative of fans reacting to the hope generated by an exceptional rookie pitcher, responsiveness to on-field performance ignores the potential influence of hype that often accompanies top prospects as they ascend through an organization’s farm system and make their initial appearances with the home club. To those ends, Table 4 presents the results of a re-estimated attendance model substituting rookie performance variables with those denoting a first-year pitcher’s draft status and pre-season prospect ranking. Given collinearity concerns attributable to the limited number of pitchers in some categories, a rookie pitcher’s amateur draft status, team prospect ranking and overall prospect ranking are all tested separately across the three different time periods within which data are available.
- Download the PDF: Click here to download Table 4: The Effect of Starting Pitcher Prospect Status on Game Attendance, 1969–2013
Within Table 4, Models 1 and 2 examine fan responsiveness to starts made by former No. 1 overall draft picks in their rookie seasons between 1969–2013. The results indicate a positive attendance effect when the home team is starting a former top amateur draft pick; while the effect is only statistically significant with 90 percent confidence, the estimates indicate an expected attendance increase of 13.0 (β=12.25) percentage points over the typical rookie premium. However, when compared to the base results in Model 1, the identification of former No. 1 draft picks in the model reduces the magnitude and statistical significance of the rookie coefficient similar to the effects demonstrated in Table 3. In contrast, former No. 1 picks have no statistically significant attendance effect when starting games on the road.
To examine the potential attendance effects of pre-season prospect rankings during a pitcher’s rookie season, Models 3 and 4 utilize Baseball America’s organizational prospect rankings. Given that such rankings have been published annually since 1983, Model 3 re-estimates the basic model since that time. The results indicate a deterioration in the magnitude and statistical significance of the rookie premium. This, by itself, is not surprising given that recent studies have demonstrated that fan responsiveness to many game-specific characteristics have declined precipitously over time (Beckman et al., 2011; Ormiston, 2014b). Nevertheless, the results of Model 4—which includes an indicator variable denoting that a rookie starting pitcher was the organization’s top pre-season prospect—fail to find any relationship between prospect ranking and game attendance; while the coefficient is negative for such pitchers in both home and road starts, the magnitude is miniscule and the effect is not statistically significant at any reasonable level.
While the results of Model 4 fail to demonstrate a statistical relationship between a pitcher’s prospect ranking and game attendance, this could be attributable to the fact that the caliber of an organization’s top prospect can vary wildly across teams depending on the strength of the clubs’ respective farm systems. Therefore, to estimate the attendance effect attributable to baseball’s most highly-regarded prospects—regardless of team ranking—Models 5 and 6 re-estimate the attendance model for games between 1990–2013, during which time Baseball America published annual pre-season top 100 prospect rankings within the sport. Separating these rankings into four categories, the results fail to uncover any statistically significant relationship between the overall prospect ranking of either team’s starting pitcher and game attendance.
The results of Table 4 may offer initial evidence that fans are unresponsive to the hype associated with a pitcher’s prospect ranking, however this analysis has examined the attendance effect of this ranking on all of a pitcher’s rookie-season starts. If an attendance effect of “hype” exists, it should theoretically be most prevalent in a prospect’s Major League debut, or the point at which a player’s performance is most uncertain—and thus susceptible to hyperbole—to a team’s general fan base. As the player demonstrates his level of ability in an MLB uniform, that uncertainty dissipates and fan responsiveness may be limited to the performance-based effects presented in Table 3.
To address this question, the effects of amateur draft status and prospect ranking on game attendance during a rookie’s Major League debut are presented in Table 5.
- Download the PDF: Click here to download Table 5: The Effect of Starting Pitchers MLB Debut on Game Attendance, 1969–2013
The results of Model 1 indicate that the debut of a former No. 1 overall draft pick is expected to increase attendance by 47.8 percent (β=0.3910), however this effect falls outside a 90-percent two-sided statistical significance test. Further, the estimated effect is particularly sensitive to each particular debut given that only six No. 1 draft picks made their debut as starting pitchers in their home park; of particular importance, removing the debut of David Clyde in 1973 reduces the estimated coefficient by more than two-thirds. This sensitivity is even more prevalent when looking at the attendance effects of No. 1 draft picks on the road. While the results suggest a negative and statistically significant effect, there was only one former No. 1 pick who debuted in a road start (Mike Moore) during the second game of a doubleheader in Oakland on April 11, 1982. While game attendance was quite small for a Sunday doubleheader, it is likely that this was attributable to omitted variable bias—it was Easter Sunday—rather than fan avoidance of the debut of a former No. 1 draft pick.
While there are not enough observations to draw significant conclusions in Model 1, this is not as much of a concern in Model 2 as there were 40-plus debuts by a team’s top prospect both at home and on the road between 1983–2013. The results suggest that the debut of a home team’s top prospect as a starting pitcher increases game attendance by 7.2 percent (β=0.694), however this effect falls outside the bounds of a 90-percent, two-sided statistical significance test. Unsurprisingly, the debut of a team’s top prospect on the road had no effect on game attendance.
As discussed earlier, the lack of a statistically significant effect in Model 2 may be due to the variable caliber of teams’ top prospect. Using Baseball America’s top 100 prospect lists to isolate the sport’s most highly-regarded prospects between 1990–2013, the results of Model 3 demonstrate that the Major League debut of a top 10 starting pitching prospect is expected to increase attendance by 13.8 percent (β=0.1289), an effect that is statistically significant at a 90 percent confidence level. While this result—found across 17 pitchers—suggests that fans are responsive, on some level, to the hype of baseball’s most exceptional prospects, these results fail to indicate that this responsiveness extends beyond the sport’s top 10 prospects or to debuts made by a visiting team’s top prospect.
Discussion
Despite volumes of academic research on the determinants of sports attendance, research on fan responsiveness to the promise offered by emerging young players has been conspicuously incomplete. This paper has attempted to address this question by examining within-season fluctuations in game attendance in Major League Baseball from 1969–2013 attributable to rookie starting pitchers. The results demonstrate some fan responsiveness to rookie hurlers, however such effects are limited to exceptional cases, namely the era’s most elite rookie performers and the Major League debuts of the sport’s top 10 prospects. Other rookie pitchers—regardless of caliber—exert little influence on game attendance.
While the results of this paper may be initially underwhelming, the analyses offer potentially powerful insight into the psyche of professional sports fans. As demonstrated in this paper—and discussed more thoroughly in Ormiston (2014b)—the current performance and star power of the home team’s starting pitcher can have a substantial effect on game attendance. In comparison, fan responsiveness to the future promise offered by most highly-regarded prospects and rookie pitchers is minimal. While this result may be partially attributable to fan inattentiveness to the home team’s farm system, the difference in magnitude between these effects provides a clear—if unsurprising—demonstration of fans’ time preferences when deciding to attend a game, a topic that has yet to be broached in the academic literature. Future research is encouraged to build upon this work, potentially examining whether roster composition among losing clubs—the choice of employing past-their-prime veterans or unproven young players—affects seasonal attendance.
As a second insight to be gleaned from this paper, the results consistently demonstrate that fan responsiveness to celebrated rookies and the debuts of top prospects was considerably stronger when such players pitched for the home team. Up until this point, research on attendance patterns in the National Basket-ball Association (Berri and Schmidt, 2006) and Major League Baseball (Ormiston, 2014b) have noted that the attendance impact of star players appeared to be more significant on the road. While this latter outcome may be surprising on the surface, consider that a home team’s fans in MLB can reasonably count on 15–20 home starts per season by their club’s favorite pitcher, making each individual game less of an event. In contrast, if a star—or well-hyped rookie prospect—takes the hill for the visiting team, it may represent the only opportunity for the home city’s fans to see that player in action all season. The results of this paper run counter to the findings of these two prior studies, further supporting the hypothesis that the advanced home team premium for celebrated rookies and prospects can be attributable to the hype and hope generated by these players. Future research is encouraged to examine how emerging, young offensive talent (or players in other sports) affects game attendance given potential differences between the effects of starting pitchers and everyday players.
Before concluding, it is necessary to identify a number of concerns with the analyses of the current paper. First, as alluded to in the study, many of the rookie and prospect categories exhibiting statistically significant attendance effects include a limited number of pitchers. This leaves the results especially sensitive to outliers; as such, future researchers are cautioned about the robustness of these effects moving forward. Further, many of the hurlers with the most substantial effects on team attendance pitched decades ago and it is unclear whether these exceptional outcomes would occur today, as evidenced by the lack of any effect attributable to Jose Fernandez with the 2013 Miami Marlins and the decline in fan responsiveness to game characteristics noted in Beckman, et al. (2011) and Ormiston (2014a).
Finally, there are concerns that the rookie effects identified in this paper are somewhat biased due to measurement error in the star power variable. As discussed in Ormiston (2014b), the age-adjusted star power variable only recognizes “star power” when a pitcher achieves a tangible accomplishment (e.g., All-Star Game, no-hitter). While this is not an issue for most rookie pitchers—whose lack of star power would be adequately estimated—it is likely that this measure would underestimate the star power of an elite rookie pitcher, especially in his first few starts. While the magnitude of this potential bias is unclear, concerns are somewhat attenuated due to the use of the current-season wins above replacement value (to fully capture the effects of a dominant performer) and the fact that fan responsiveness to visiting team rookie pitchers is near zero given that Ormiston (2014b) demonstrated the positive and considerable relationship between game attendance and the star power of the visiting starting pitcher. Future research is strongly encouraged to devise alternative measures of star power given that readily available measures—such as fan voting for the All-Star Game—are unavailable for pitchers.
RUSSELL ORMISTON is an assistant professor of economics at Allegheny College in Meadville, Pennsylvania. He studies sports economics, labor economics and human resource management and can be contacted at rormisto@allegheny.edu.
References
Beckman, E.M., Cai, W., Esrock, R.M., & Lemke, R.J. (2011). “Explaining Game-to-Game Ticket Sales for Major League Baseball Games Over Time,” Journal of Sports Economics, online only.
Berri, D.J., & Schmidt, M.B. (2006). “On the Road With the National Basketball Association’s Superstar Externality,” Journal of Sports Economics, 7, 347–58.
Bruggink, T.H., & Eaton, J.W. (1996). “Rebuilding Attendance in Major League Baseball: The Demand for Individual Games” in L. Hadley & E. Gustafson (Eds.), Baseball Economics: Current Research. Praeger Press.
Butler, M.R. (2002). “Interleague Play and Baseball Attendance,” Journal of Sports Economics, 3, 320–34.
Gittar, S.R., & Rhoads, T.A. (2011). “Top Prospects and Minor League Baseball Attendance,” Journal of Sports Economics, 12, 341–51.
Hill, J.R., Madura, J., & Zuber, R.A. (1982). “The Short-Run Demand for Major League Baseball,” Atlantic Economic Journal, 10, 31–35.
Lemke, R.J., Leonard, M., & Tlhokwane, K. (2010). “Estimating Attendance at Major League Baseball Games for the 2007 Season,” Journal of Sports Economics, 11, 316–48.
McDonald, M., & Rascher, D. (2000). “Does Bat Day Make Cents? The Effect of Promotions on the Demand for Major League Baseball,” Journal of Sport Management, 14, 8–27.
Meehan, Jr., J.W., Nelson, R.A., & Richardson, T.V. (2007). “Competitive Balance and Game Attendance in Major League Baseball,” Journal of Sports Economics, 8, 563–80.
Ormiston, R. (2014a). “Do Fans Prefer Homegrown Players? An Analysis of MLB Attendance, 1976-2012,” Baseball Research Journal, Volume 43, Issue 1, 108–17.
Ormiston, R. (2014b). “Attendance Effects of Star Pitchers in Major League Baseball,” Journal of Sports Economics, 15, 338–64.
Rascher, D.A. (1999). “A Test of the Optimal Positive Production Network Externality in Major League Baseball” in J. Fizel, E. Gustafson, & L. Hadley (Eds.), Sports Economics: Current Research (27–45). Westport, CT: Praeger.
Notes
1. This attendance effect may be offset at the minor-league level if a prospect is only expected to play for a particular minor-league team for a limited duration, thereby drawing crowds hopeful to see the player before he is promoted to another team.
2. The Retrosheet game-by-game database can be found at www.retrosheet.org/gamelogs/index.html.
3. These special cases involve games moved to neutral sites due to inclement weather, temporary stadium construction, or other reasons (e.g., games played outside the US and Canada). This also excludes the “home games” played by the Montreal Expos in San Juan, Puerto Rico.
4. Analyses examining the attendance effects of each game’s starting pitchers are generally unencumbered by endogeneity concerns given that the names of the starting hurlers are announced to the public, often a few days ahead of time, such that fans can ascertain ahead of time whether a particular pitcher will—or will not—be playing in a given game.
5. Team-based variable pricing initiatives are not included due to a lack of data availability.
6. Consistent with the standards employed by Baseball America, this paper defines a rookie pitcher as a hurler with no more than 50 career innings pitched or 30 career games played prior to the season in question.
7. The overall top 100 prospect lists can be found at www.baseballamerica. com/ today/prospects/rankings/top-100-prospects/all-time. The top 10 prospect lists by organization were gathered from www.baseballamerica. com/majors/top-10-prospect-rankings-archives (1983-2000) and from the annual publication Baseball America Prospect Handbook (2001-2013).
8. The 13 pitchers who were number one overall picks and started at least one game in the majors are David Clyde, Floyd Bannister, Mike Moore, Tim Belcher, Andy Benes, Ben McDonald, Paul Wilson, Kris Benson, Bryan Bullington, Luke Hochevar, David Price, Stephen Strasburg and Gerrit Cole. Another pitcher, Matt Anderson, was the number one pick in the 1997 draft, but made all 257 of his MLB appearances in relief. Two other number one overall picks—Brien Taylor (1991) and Mark Appel (2013)—had not appeared in an MLB game during the time period studied.
9. In more detail, the numerator of the star power variable equals the linear sum of the number of times a pitcher has been named to the All-Star Game, the number of Cy Young awards won, the number of Most Value Player awards won, the number of no-hitters started, the number of All-Star Game MVP awards, the number of post-season MVP awards, whether the pitcher won the Rookie of the Year and whether the pitcher had won 300 games. The denominator equals a pitcher’s age (as of July 1st of the given year) minus 17.
10. To compute the star and wins above replacement data, information on award winners and WAR were drawn from Baseball-Reference.com. Data on no-hitters were located on Retrosheet.org. All-Star Game information was drawn from MLB.com.
11. As an example of how this estimate meets expectations, note that this system rates Dwight Gooden, Fernando Valenzuela, and Tom Seaver as reaching the highest level of star power between 1969-2013, a reasonable outcome.
12. As an example, the average game-time winning percentage of a team starting a rookie hurler (.480) is significantly lower than that of a team starting a non-rookie pitcher (.503).
13. Demonstrating the sensitivity of the results to individual players, removing Mark Fidrych’s rookie-season starts from the model reduces the home team coefficient on these celebrated hurlers from 0.2910 to 0.1550, representing a 47 percent decline; the visiting team coefficient falls from 0.1827 to 0.1261, a 31-percent decline. Both effects, however, remain statistically significant at a 95 percent confidence level.