Is Ozzie Smith Worth $2,000,000 a Season?
This article was written by David S. Neft
This article was published in 1986 Baseball Research Journal
In April 1985, Ozzie Smith signed a contract which called for a base salary of $2,200,000 a year in 1988 and 1989. This probably caused more derisive comment from both press and fans than any other baseball contract. The focus of all this derision was Smith’s batting statistics – the fact that his lifetime batting average was only .238 at the end of the 1984 season and that he had hit only seven home runs. But clearly Ozzie Smith’s contract was based much more on his fielding talent than on his batting record. So, the scorn that greeted Smith’s contract is really a testament to our inability to measure statistically the value of a major league shortstop when a large component of that value is fielding.
This article proposes a way to measure this value. This measure is certainly not perfect (no sport measurement is), but it is useful for comparing lifetime achievements. The overall rating starts with a Batting Factor, to which a Running Factor and a Fielding Factor are added, with adjustments for conditions in various years. Then the overall rating was calculated for all players with at least five years’ experience as a regular major league shortstop and who had a majority of their good years since 1900. Cal Ripken was included in this list even though he had played only four years as a regular shortstop through 1985.
Batting Factor
John Thom and Pete Palmer in their outstanding book, The Hidden Game of Baseball, use “On Base Plus Slugging” (OPS) as a measure of batting achievement. This is the best simple, overall statistic for batting in a given year. It is defined as the On Base Average (OBA) plus the Slugging Average (SA). Here, a true “average” is needed, so the Batting Factor (BF) is defined as OPS divided by 2 or
OBA + SA
2
Of course, SA=TB/AB where TB = Total Bases and AB = At Bats. Ideally, OBA should be
H + BB + HPB + RBE
AB + BB + HPB + SF
where H = Hits, BB = Bases on Balls, HPB = Hit by Pitched Balls, RBE = Reached Base on Error and SF = Sacrifice Flies in those years when they have not been charged as a time at bat. However, RBE is not available in standard baseball statistics so the common version is OBA =
H + BB + HPB
AB + BB + HPB + SF
For some years, HPB was not included in the official statistics, so for those years OBA =
H + BB
AB + BB + SF
Using these definitions, a player’s batting factor for a particular year is defined as BFiy =
OBAiy + SAiy
2
where “i” stands for a particular individual and “y” is a particular year.
In order to compare players from different periods, an adjustment must be made for the year in which the player performed. Obviously, it was easier to achieve a high BFiy in 1930 than in 1968. The adjustment is based on relating BFiy to the comparable data for all of the league’s batters that year. Thus, BFLy =
OBALy + SALy
2
where “L” stands for the league and the data includes all non-pitchers. This takes into account the change due to the introduction of the Designated Hitter in the American League in 1973. An arbitrary norm of BFL = .375 has been used. The specific number is arbitrary, but that doesn’t matter because the final results are relative comparisons and not absolute numbers. For these years where HPB is not in the official statistics, this decreases BFLy by an average of .003, so for these years BFL = .372. Therefore, the final
where BFL is either .375 or .372 depending upon whether HPB is included in or excluded from the official statistics.
Running Factor
Speed is a plus factor in many ways in baseball. Unfortunately, the only available statistics are Stolen Bases (SB) and Caught Stealing (CS), and for many years Caught Stealing was not included in the official statistics.
So, one must start with what is available. A stolen base is a way of extending a hit. With no one on base, there is no difference between a batter stretching a single into a double and someone hitting a single and stealing second base. However, the former gets two TB in computing SA and the latter gets only one. So net stolen bases (SB – CS) can be viewed as an addition to TB in calculating SA. Since SA = TB/AB, the base stealing adjustment would be SB – CS / AB.
But SA is one of two components of the Batting Factor. The other, OBA, is not affected by base stealing. Because the player’s Running Factor (RF) is an increment to the Batting Factor, it should be
However, this running factor has two limitations. The first is that a stolen base affects only the one runner, whereas an extra-base hit can advance other runners. On this basis, the running factor gives too much credit to the player. On the other hand, there is more to running than stealing bases. This formula does not credit a player’s speed for:
- taking an extra base on someone else’s hit or out;
- putting pressure on the defense, resulting in additional RBE’s and errors on stolen base attempts;
- putting pressure on the opposing pitchers by threatening to steal, sometimes disturbing the pitcher’s concentration, and often giving the next batter confidence that he can expect more fast balls;
- avoiding grounding into double plays.
Since these factors are hard to quantify, it is assumed here that they justify the extra credit that the running factor gives a base-stealer. If the necessary data could be produced they would probably show that the upward adjustment factors are somewhat greater than the reverse, and that this formula for RF slightly penalizes the great running shortstops.
RFiy could also have been adjusted by the average amount of base stealing in a league year the same way that BFiy was adjusted. However, RFiy is a very small component of the player’s total rating, and the adjustment factor would have been tiny (less than one percent of the final rating in every case) so, for convenience and ease of computation, it was not included.
One adjustment was necessary. The years where CS data were not available had to be included. In these cases an average base stealing rate of 75% was assumed, which is a reasonable historical figure for players who do a lot of running. It overstates the success rate for players who rarely attempt to steal, but in those cases the effect of the overstatement on the running factor is quite small. A 75% rate means CS = SB/3 and thus, RFiy =
for years when CS data are not available.
Fielding Factor
Since the start of major league baseball more than 100 years ago, Fielding Average (FA) has been the usual statistical measure of fielding performance. Unfortunately, FA isn’t a good indicator of fielding ability. The positive elements of FA – putouts (PO) and assists (A) – are satisfactory, but the negative element – errors (E) – is only one of two actual negative fielding elements.
The second is that a poorer fielder doesn’t reach a ball that a better fielder would have reached or doesn’t make a throw quickly enough or doesn’t field a bad hop that someone with quicker hands might have fielded. These missed opportunities occur far more frequently than do actual errors and, therefore, are more important in evaluating fielding performances. Unfortunately, there is no direct measure of these missed opportunities.
In an attempt to measure this indirectly, baseball people for many years have used some form of range factor, usually defined as
PO + A
G
where G is games played, or Total Chances Per Game:
PO + A + E
G
This concept was introduced by Al Wright in 1875. It was revived by Irwin M. Howe, the statistician for the American League, who ranked A.L. fielders this way in 1914. Subsequently, Branch Rickey and many other baseball executives used these measures to evaluate players. This author used the concept in 1969 in The Baseball Encyclopedia and Bill James has used it in his Baseball Abstracts.
There are two problems with this way of measuring fielding. The first is that its usefulness varies greatly by position. The principle works quite well for shortstops and third basemen. It is not as good for second basemen because they are more dependent on other players than are shortstops or third basemen. For example, the second baseman more often covers second base on steal attempts and most often is the middleman on double play attempts.
For outfielders, this approach is not very good. Putouts by outfielders are significantly affected by the stadium dimensions and by the fact that two outfielders can often reach the same ball so that an outfielder playing alongside a slower teammate will tend to have more putouts than one playing next to a speedy ball hawk. Assists by outfielders are even more unreliable because runners will often not try to advance on the great throwing arms.
For first basemen, this way of looking at fielding is a poor measure. The assists-per-game system is interesting, but it varies with the style of the first baseman. Some first basemen prefer to throw to the pitcher covering the bag on nearly every grounder they field, while others prefer to run to the base and these players do not get an assist. Moreover, much of a first baseman’s defensive skill is in handling poor throws from the other infielders, and total putouts provide no indication of this skill.
For catchers, these measures are useless. Range is simply not a factor. The catcher’s percentage of throwing out opposing base-stealers provides some indication of his throwing arm, but even this is often more a reflection of the pitcher than the catcher. Most importantly, the catcher’s primary defensive skill is handling pitchers, and no one has yet devised a statistical measure for this.
The second problem with these measures is that they are based on the implicit assumption that all fielders at one position get the same number of opportunities to make a putout or assist per game played. This, of course, isn’t true. Even for shortstops and third basemen, the nature of the pitching staff and chance factors will produce some variation in number of opportunities. As a result, these range factors can vary significantly from year to year. However, with the addition of a few modifications discussed later, the range factor does provide a valid measure of a shortstop’s lifetime fielding performance.
The Fielding Factor (FFiy) calculation starts with the Fielding Range (FRiy), defined as FRiy =
POiy + Aiy
Giy
Of course, all data are for games played at shortstop only. To make this as valid as possible Giy should be complete game equivalents, or defensive innings played at shortstop divided by 9. This distinction is inconsequential for Joe Tinker or any of the early twentieth-century players. It is, however, very important for a player like Mark Belanger, who was often pinch-hit for and who sometimes entered the game only as a late-inning defensive replacement.
The proper way to calculate Giy would have been to look at every boxscore where more than one shortstop played for a team and estimate the number of innings played by each. This was done for 1984 and 1985, but it was too monumental a task for the entire project, so for all other years Giy was figured by analyzing the final season fielding data for everyone who played shortstop for the team and year in question and estimating the number of complete game equivalents for each.
One effect of the pitching staff on a shortstop’s opportunities can be measured and dealt with. If the pitchers strike out a large number of opposing batters, all the fielders will have somewhat fewer opportunities. For this paper, an adjustment was made if the Pitchers’ Strikeouts (PSO) for the team (T) in question exceeded the average for the other teams in the league that year by 0.5 per game or more. It was then assumed that one-sixth of the reduced opportunities would have gone to the shortstop. Thus, where this adjustment was necessary, FRiy =
where Nly is the number of teams in the league that year.
The next step was to convert the absolute measure, FRiy, into a Relative Fielding Range (RFR) by comparing the individual data to the league average. Thus, RFRiy =
This also includes the necessary adjustment for conditions in different years. RFRiy is a measure of the number of PO + A per game that this shortstop was able to get compared to the average of his peers in his league for the year in question. This was related to the Batting Factor by simply assuming that each extra putout or assist prevented an opponent’s single and, therefore, is the equivalent of a batter’s single. Thus, the increment to the player’s SA is
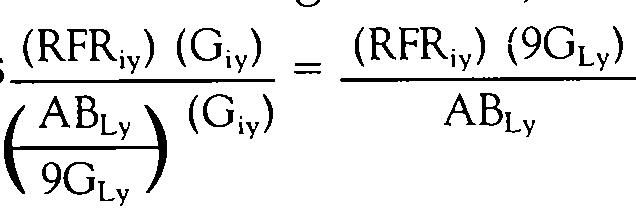
where ABLY is the total number of At-Bats for the league that year, including pitchers, and the “9” is the number of positions in the batting order. Similarly, the effect on OBA is the same except that Plate Appearances is substituted for At-Bats. Therefore, the Fielding Factor is
Longevity Factor and Lifetime Rating
In trying to calculate a shortstop’s lifetime rating, an important question was – which years should be included? The first and easiest decision was to include only years where the player was the regular shortstop.
However, if that had been the only decision, those players who had many years as a regular shortstop and who continued to play regular shortstop even when their performance declined late in their careers would be penalized while those whose performance tailed off even more and who were switched to third base or first base or who lost their regular jobs completely would not be penalized.
This problem was addressed in two ways. First, if a player’s yearly rating (BFiy + RFiy + FFiy) declined significantly after reaching the age of 35 or after completing ten years or more as a major league regular shortstop, those final declining years of his career were not included. Second, an arbitrary Longevity Factor (LFi) was awarded based on the number of years actually included in the Lifetime Rating. For each year more than ten, the player was awarded .005 and for each year less than ten .005 was subtracted. Thus, the Lifetime Rating, LRi =
where Y is the number of years included and Σy means the sum of each year’s factors.
Results
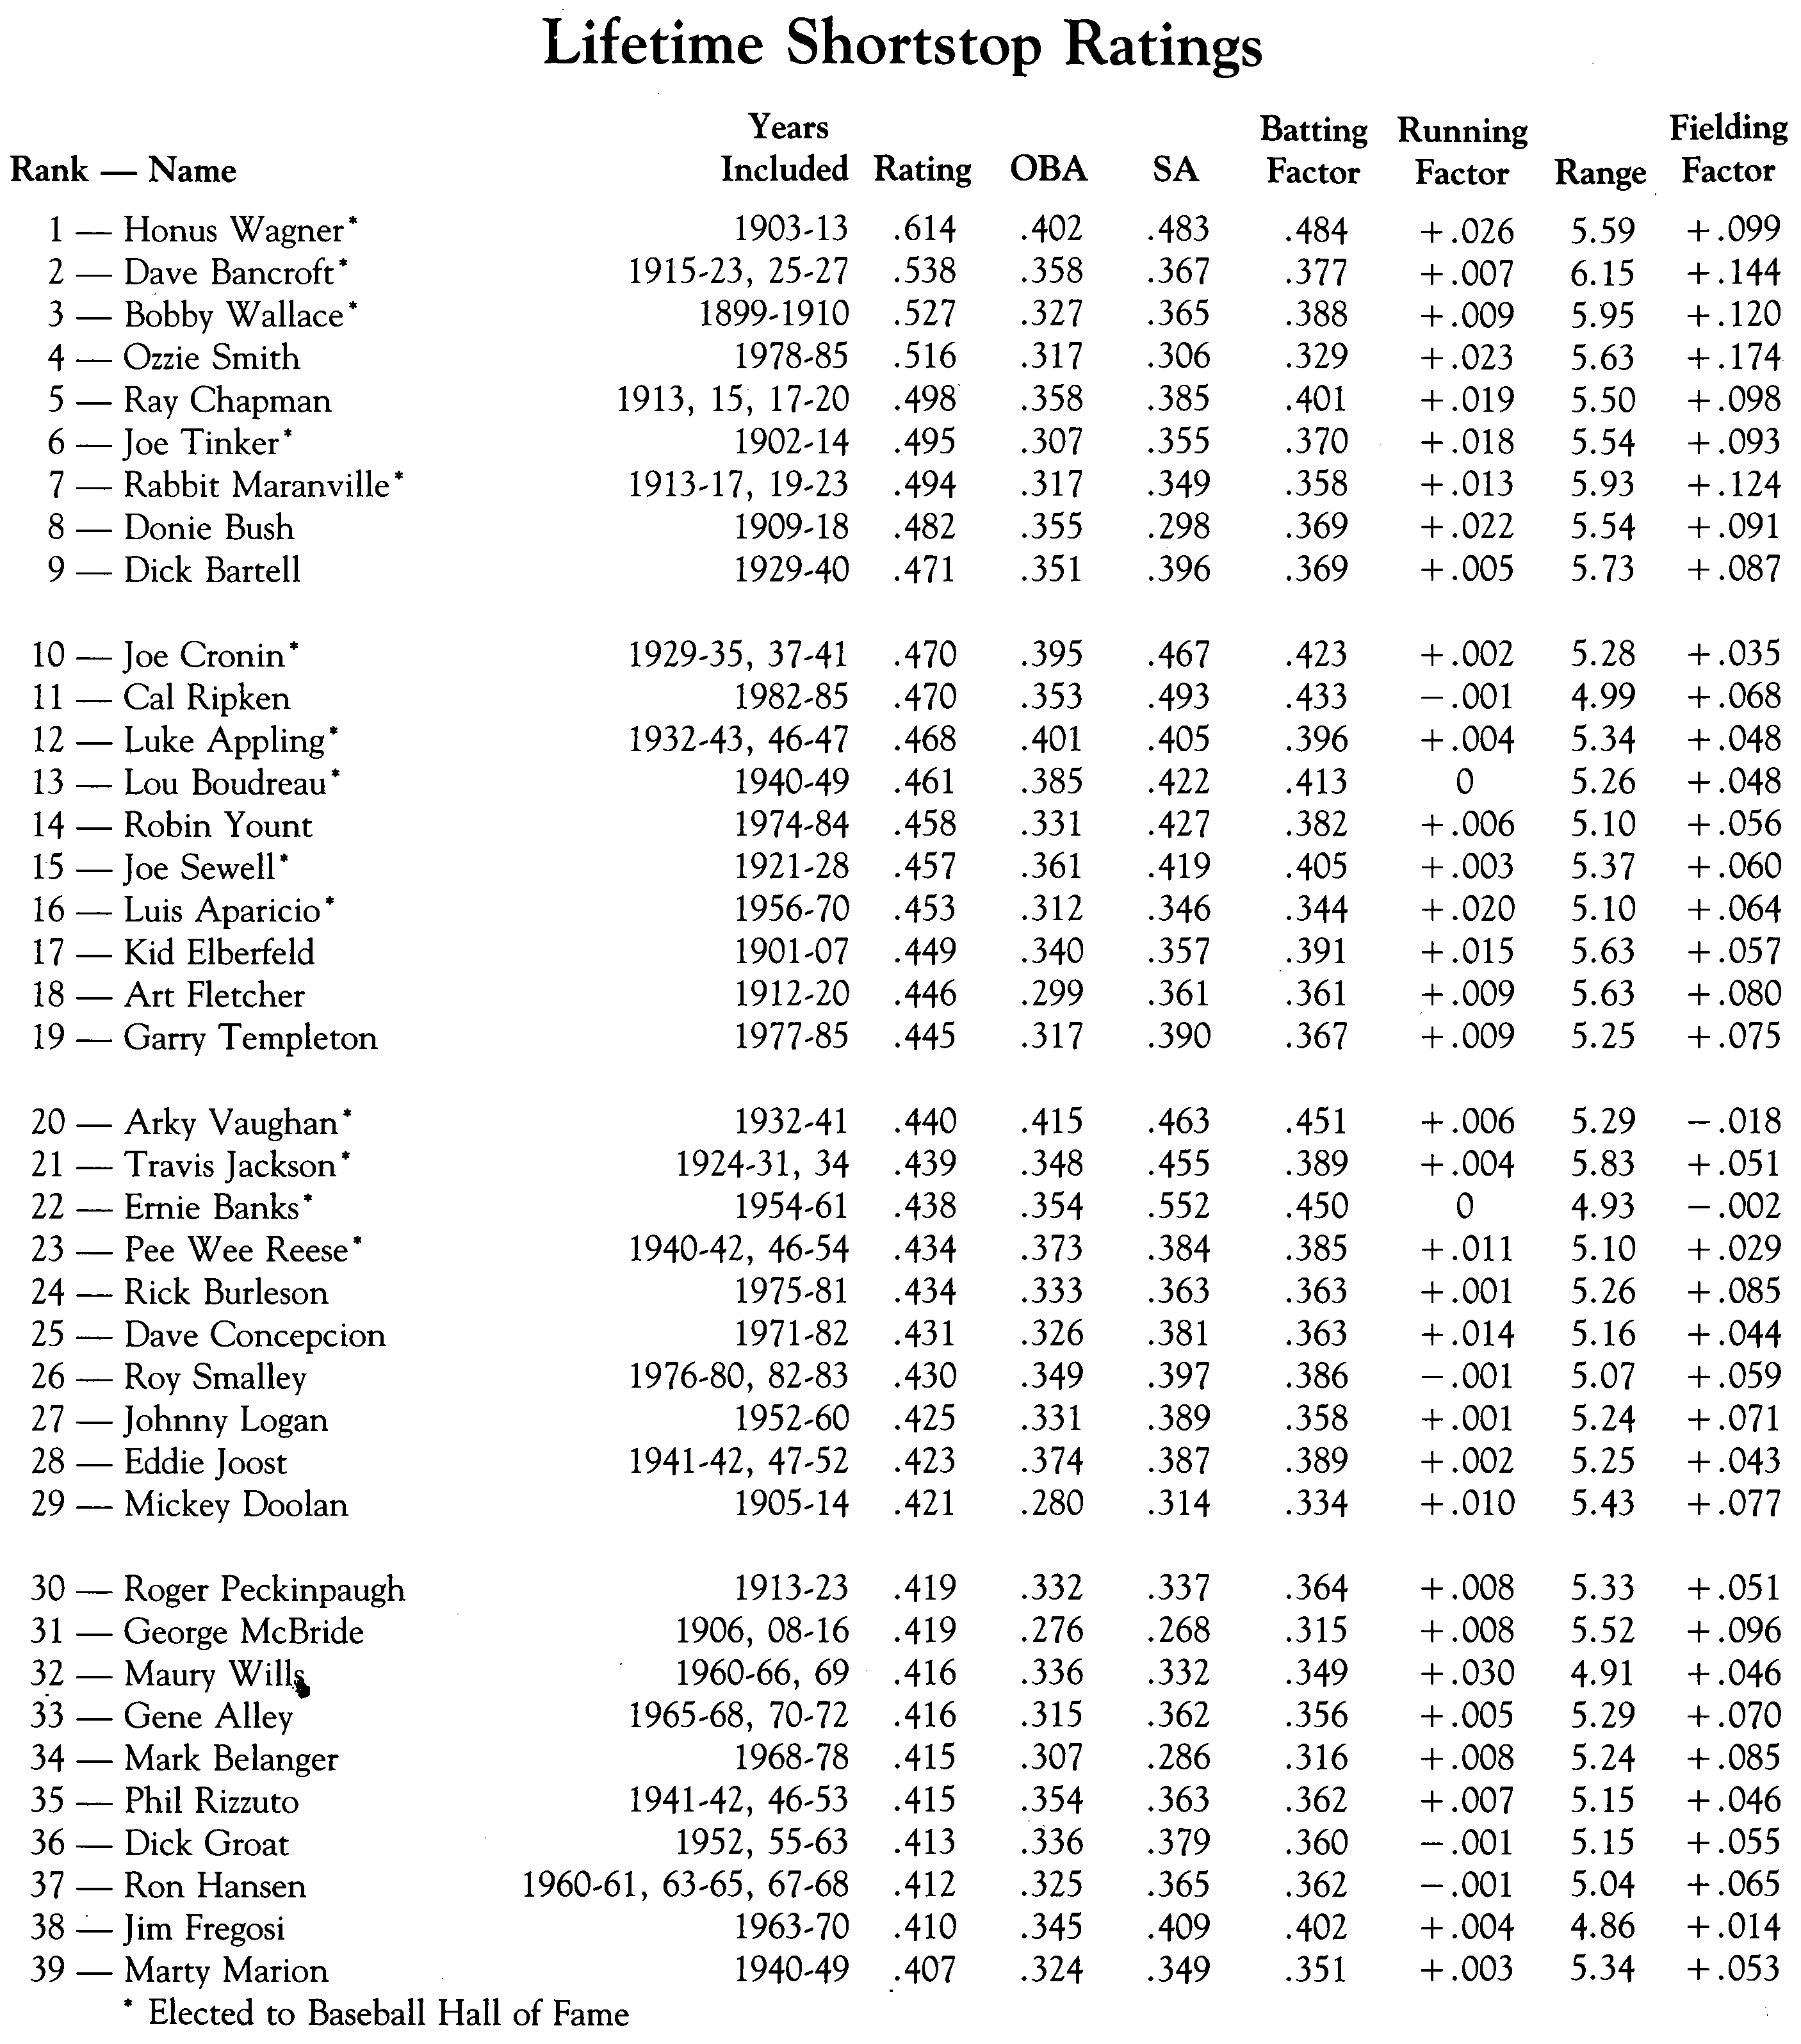
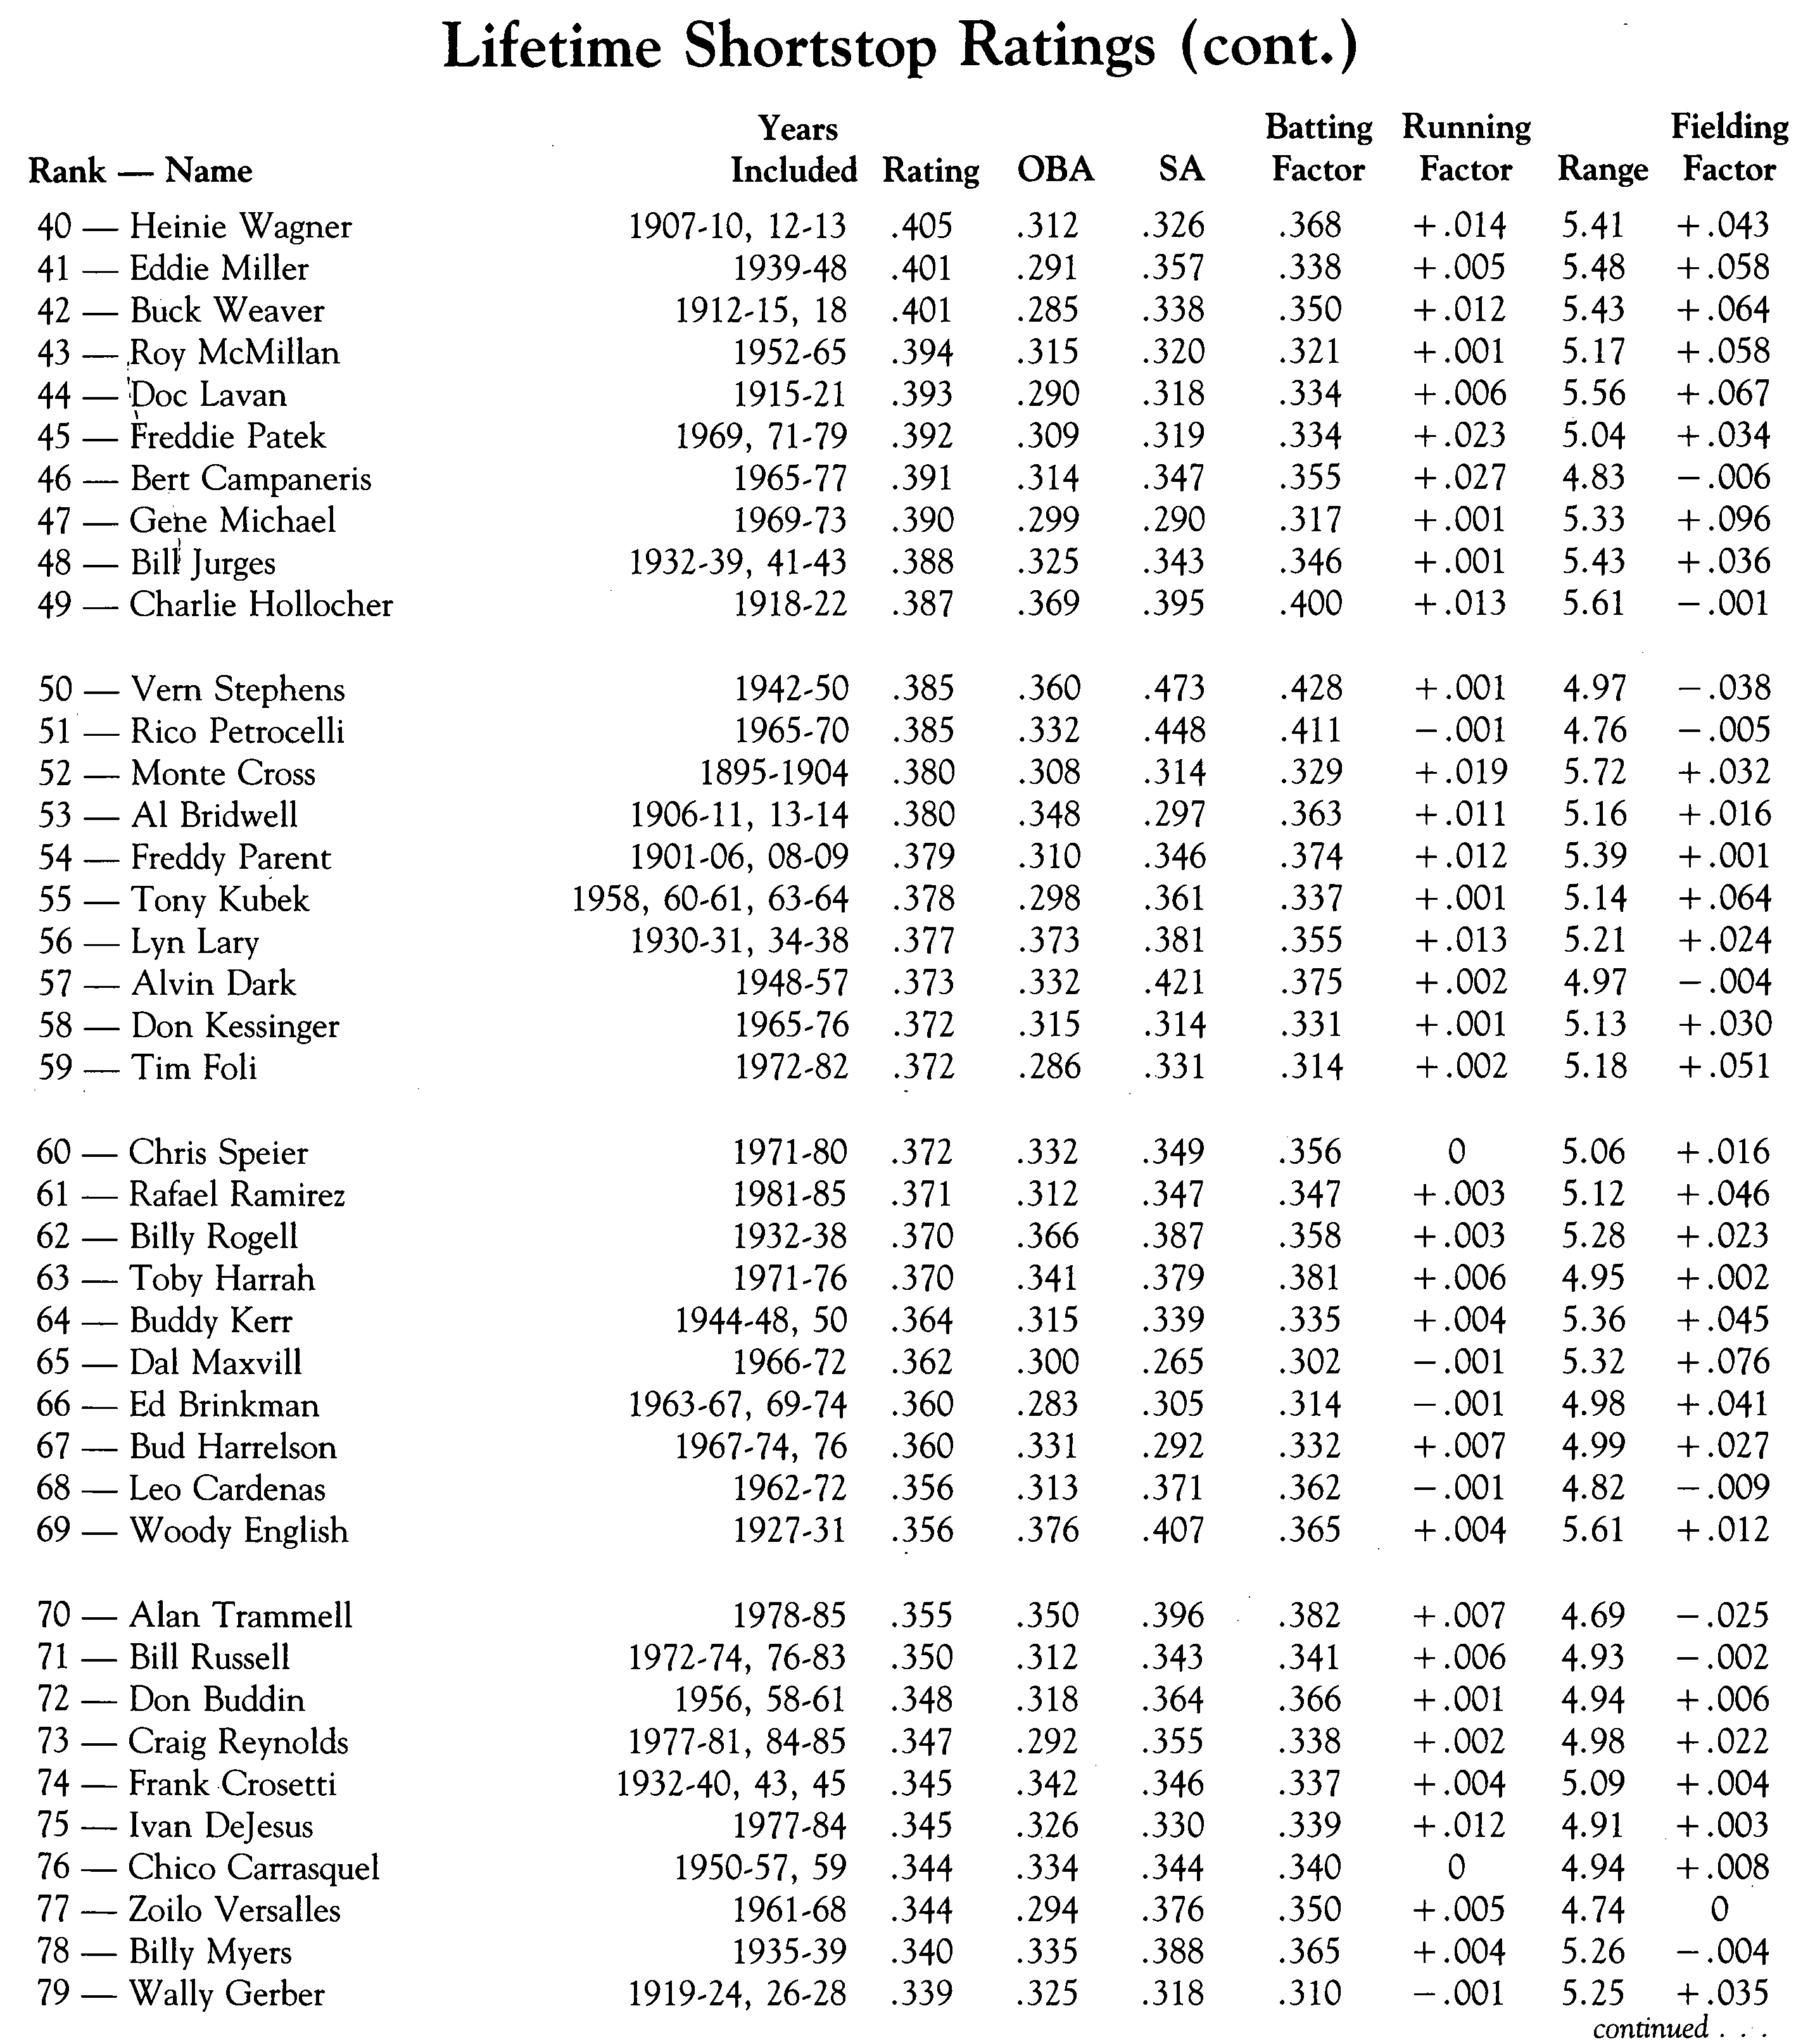
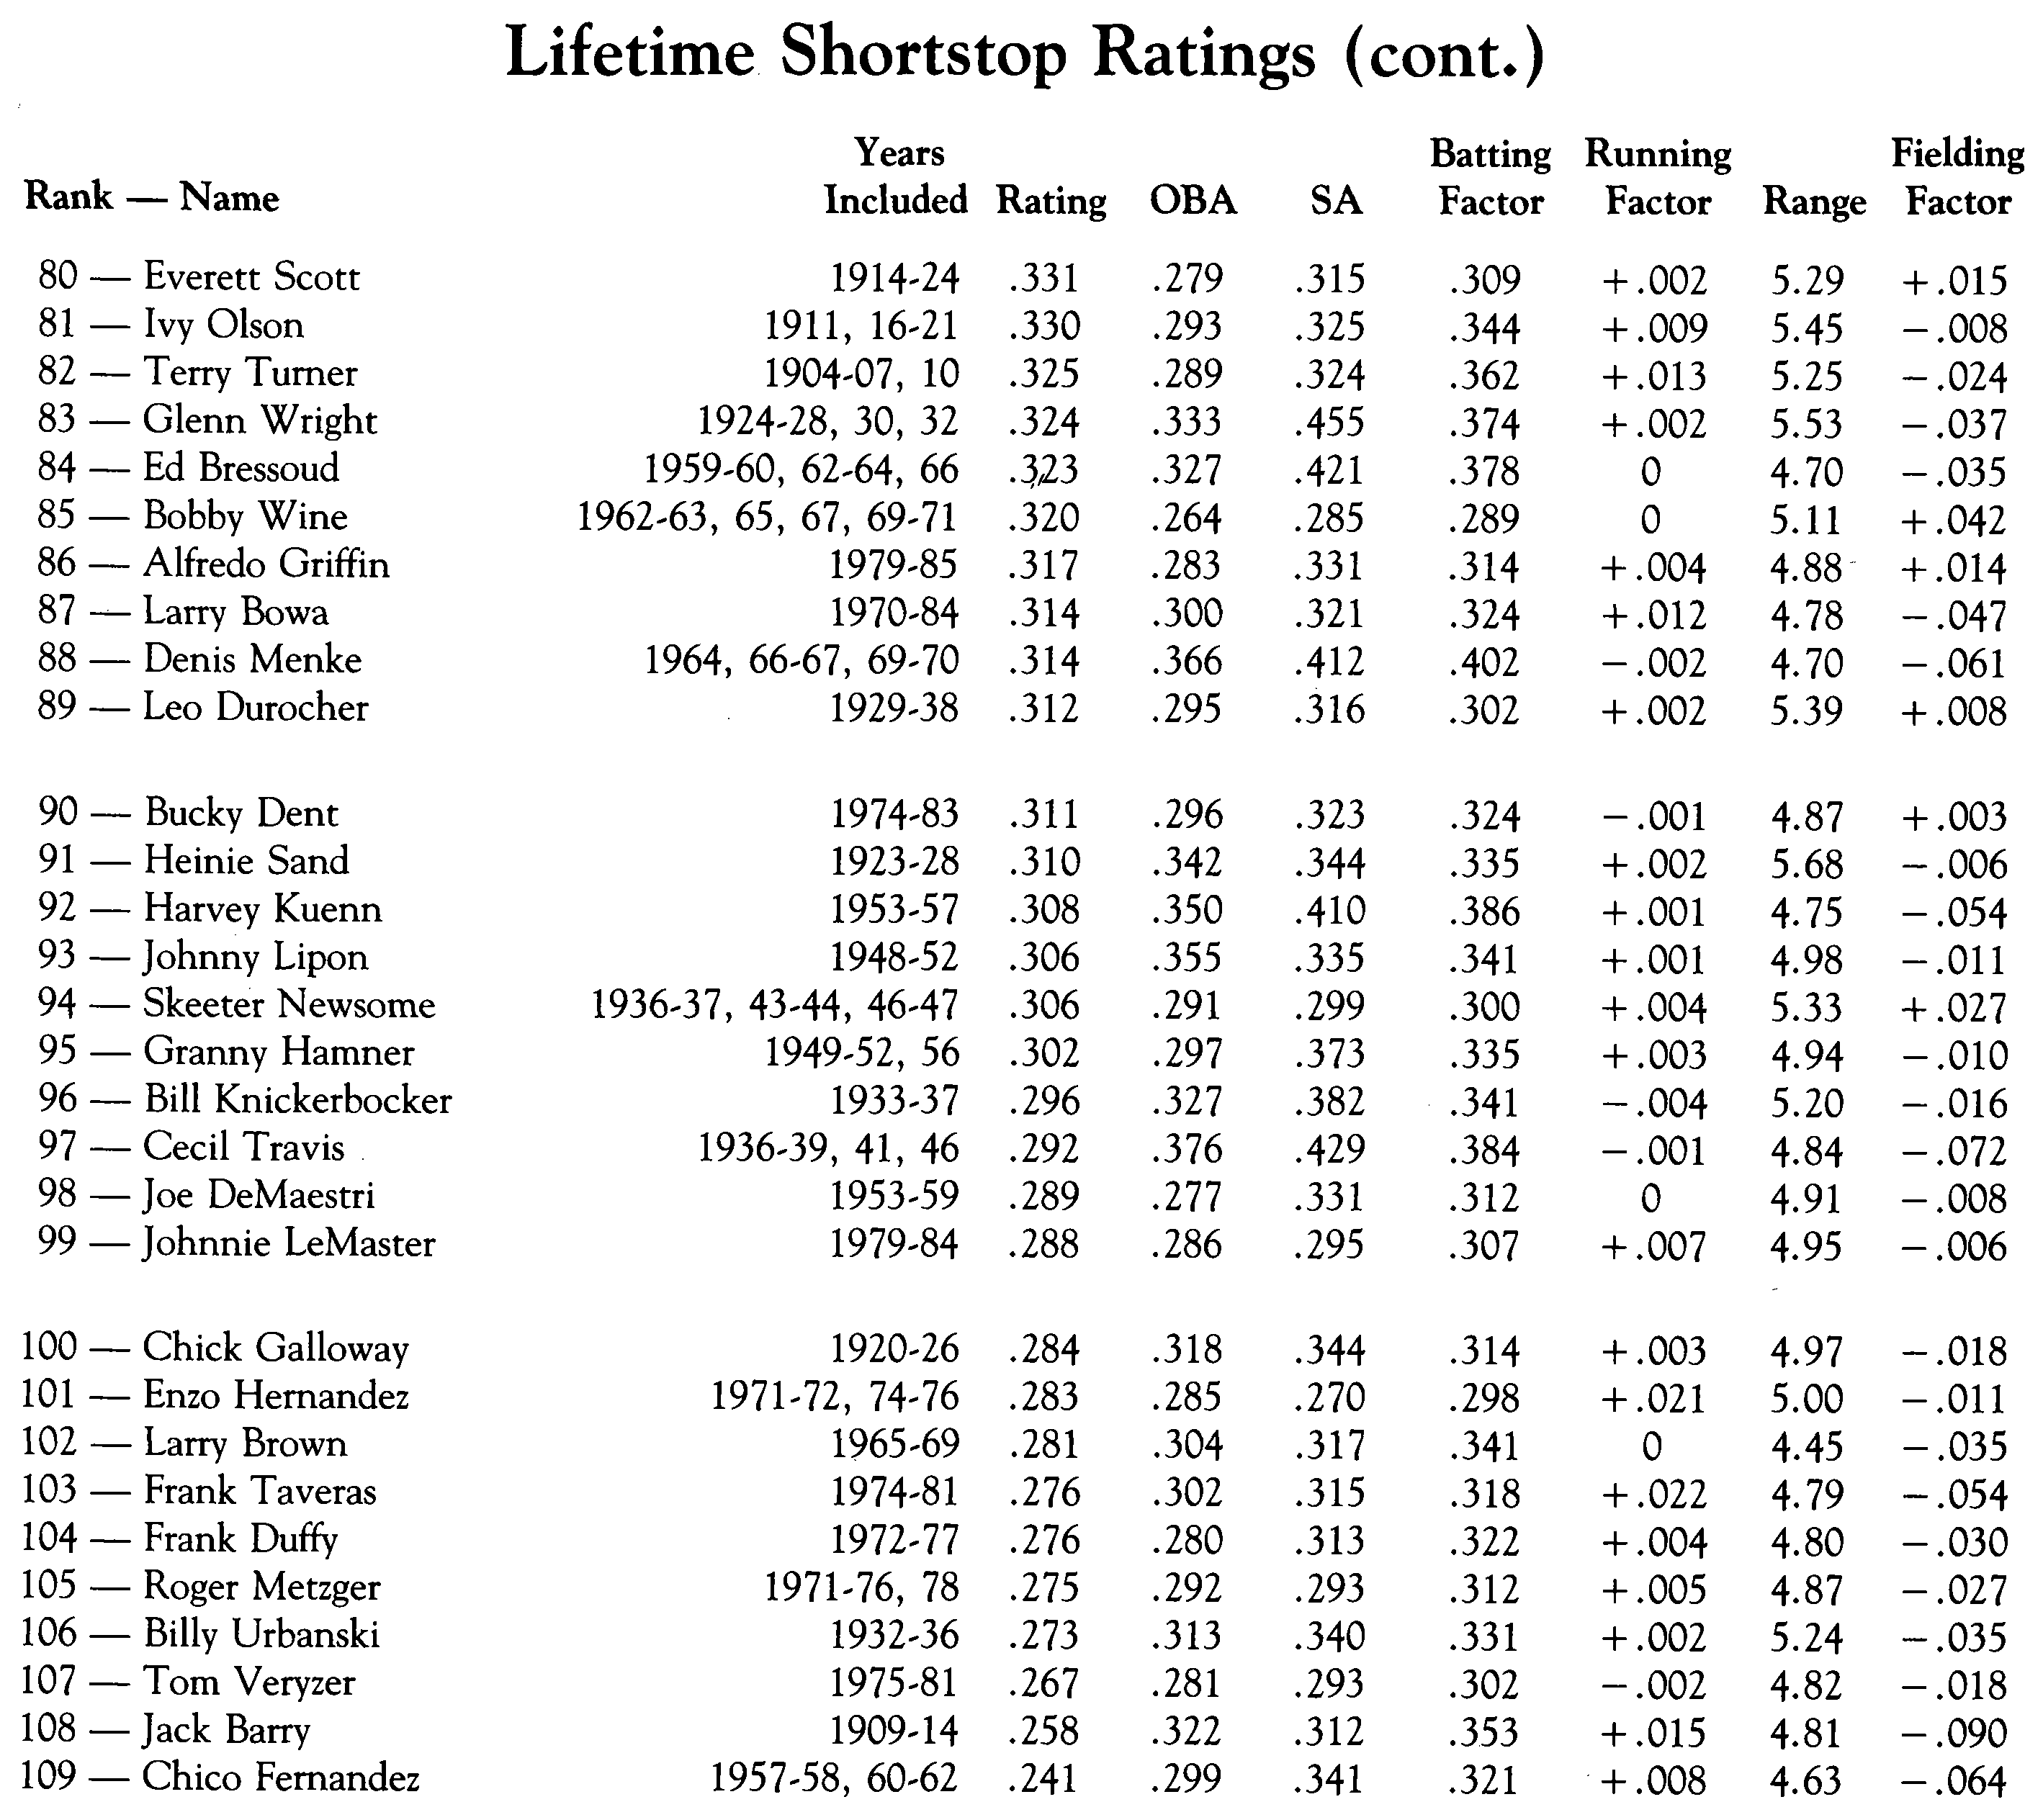
The Lifetime Ratings and the main components, of those ratings are shown in the accompanying table. The results are evident from looking at the table, but a few observations are in order. The first is that anyone who can play five years as a regular major league shortstop is an excellent baseball player, regardless of his ranking on this list. Another thing to note is that several of these players, including Ernie Banks, Harvey Kuenn, Buck Weaver and Toby Harrah, spent much of their careers at other positions. The data shown in the table reflect only their years at shortstop.
The most obvious feature of the results is that they support the reputation of Honus Wagner as the greatest shortstop of all time – and by a wide margin. In fact, Wagner is first in Batting Factor, second in Running Factor and fifth in Fielding Factor – a remarkable all-around player. Behind Wagner are two other Hall of Famers from the game’s earlier years, Dave Bancroft and Bobby Wallace. Looking further down the list, an obvious conclusion is that the Hall of Fame electors have not been as stupid as some of their critics have charged. The 14 shortstops enshrined in Cooperstown are all in the top 19 eligibles on the list. The people who complained about shortstops such as Wallace, Tinker or Maranville being enshrined were, once again, relying on batting statistics only. Moreover, these data suggest that Ray Chapman, Donie Bush and Dick Bartell should join them in Cooperstown.
Finally, we return to Ozzie Smith and his contract. Maybe the Cardinals, like the Hall of Fame electors, aren’t so dumb after all. How many other active players would rank in the top five on an all-time list at their position? The only other player who would probably make such a list is Mike Schmidt, and he is in the same salary range as Ozzie Smith, even though Schmidt, at age 36, may be in the twilight of his career.
DAVID S. NEFT is co-author of The Sports Encyclopedia – Baseball and The World Series.
(Click images to enlarge)


