

The 100 Top-Fielding MLB Pitchers, circa 1900–2008
This article was written by John Knox
This article was published in Summer 2009 Baseball Research Journal
How important is the subject of pitchers’ fielding? Just ask Jim Leyland, manager of the 2006 Detroit Tigers, who lost the World Series.
Five errors—four of them throwing errors—committed by four different pitchers, one in every one of the five games of the series, led to seven unearned runs for the opposing St. Louis Cardinals. In the close-fought Games 4 and 5, these unearned runs provided the ultimate difference between victory and defeat. The pitchers’ errors delivered the Cardinals a key assist to the world championship, totaling Detroit’s chances and leaving Leyland and Tigers fans understandably put out.
On the premise that any facet of the game crucial enough to lose a World Series is worth closer scrutiny, I embarked on a study of fielding by pitchers. This subject is apparently something of a terra incognita even in sabermetric circles. At Baseball-Almanac.com, comprehensive fielding records provide all-time leaders in fielding percentage for every position—except pitcher. The SABR archives list only one article on the subject, Jim Kaplan’s “The Pitcher as Fielder” (1987). This valuable discussion is narrative, however, rather than analytic and is now more than two decades old. The Fielding Bible (Dewan 2006) omits discussion of pitchers as fielders; an online follow-up by Dewan analyzes fielding data for pitchers only for the period 2003–5.1 In a detailed discussion (written in 2002) of the best all-time fielders at each position, ESPN’s Rob Neyer omits pitchers except to briefly “hazard a wild guess.”2 Such wild guesses presumably entered into Rawlings’s “Summer of Glove” in 2007, during which the best fielders at each position in the half-century-long Gold Glove era were selected.
Why is there a paucity of research on fielding by pitchers? Dewan says he omitted pitchers from The Fielding Bible because he “ran out of time,” not because of a belief that fielding by pitchers was irrelevant or could not be quantified.
A reviewer of this article suggests that pitchers’ fielding excellence may be difficult or unrealistic to contemplate because pitchers are generally encouraged to leave the fielding to other players. This has not always been the case in baseball, however, and in recent times pitchers such as Greg Maddux have clearly not gotten the memo about standing aside when the ball is in play. An analogy with stolen bases may be in order: Just because slow-of-foot players are discouraged from stealing, this doesn’t mean that the excellence of the fleet-of-foot cannot be discussed, quantified, and ranked. Similarly, I will assume in this paper that the best-fielding pitchers are not significantly thwarted in their ability to field, any more than fast runners are chronically dissuaded from stealing. Over the course of a long career, a talent that benefits the team will usually be expressed, and it can then be analyzed.
Moreover, as noted in the opening vignette regarding the Tigers, a pitcher’s ability to field cannot be an insignificant talent if poor fielding by pitchers can lose a World Series. Is it a coincidence that longtime Braves manager Bobby Cox regularly acquires good-fielding pitchers such as Maddux, Tom Glavine, Mike Hampton, Tim Hudson, Derek Lowe, and Javier Vazquez but does not acquire equally stellar pitchers who are not good fielders (e.g., Randy Johnson)? This is implicit evidence that fielding by pitchers is valued to an extent by at least some managers.
Sabermetrics can shed light on this little-explored corner of baseball and afford us something better than a wild guess at the best-fielding MLB pitchers of all time. In this article, I make a first attempt to satisfy this need, using statistics to devise ranked lists of the top 100 best fielders on the mound since 1900. I hope that this work, though admittedly less sophisticated than the work of experienced sabermetricians, will provide a stepping stone for more-sophisticated analyses on the subject.
My results contain a considerable surprise: They identify a virtuoso pitcher-fielder whose career efforts in a combination of categories rise well above those of all others. Yet this pitcher, though eligible, never won a Gold Glove and is rarely mentioned in discussions of the best-fielding pitchers. Before I reveal his identity and that of the other pitchers on the lists, however, I will discuss the data-analysis methods used in this study.
DATA AND METHODS
In this study I confronted three key data-analysis questions: which data to use, which variables to use to measure fielding prowess, and which pitchers to analyze.
Data
I obtained all fielding data on MLB pitchers from Baseball-Reference.com. To avoid confusion, where possible I use the same acronyms for statistics that are used on the site. While Baseball-Reference.com is fairly comprehensive, at the time of writing the database was lacking in some respects relevant to this study, particularly with regard to career nine-inning range factor (RF9) and career league-average nine- inning range factor (lgRF9) at the pitcher position. I explain below how I circumvented these omissions.
Measures of fielding
Given the paucity of research on pitchers’ fielding, there is not much work available on creative sabermetric approaches to the topic, such as there is for the study of, say, catchers or first basemen (James 2001, 355–57). Dewan applied his plus/minus system (Dewan 2006) to pitchers for 2003–5, but his approach seems impossible to implement currently with pitchers from earlier eras.3
There are two schools of thought regarding fielding. Adapting a famous line from Robert Browning’s poem “Andrea del Sarto,” one of them might be summarized as “the fielder’s reach should exceed his grasp”—that is, range is considered primary. The other school of thought looks for “the faultless fielder”—that is, sure-handedness is emphasized. Most traditional discussions of fielding focus on one or the other of these two attributes. Gold Glove awards, in particular, seem to be biased toward range. It seems reasonable to assume, however, that a combination of range and sure-handedness is optimal. In this study, I opted for a combination of four slightly innovative statistical measures of pitchers’ fielding, each normalized to a 0–100 scale.
Rezeroed normalized relative clean-fielding rate (RCFR). Following James’s mention of “relative error rate” (James 2001, 878), I obtained a pitcher’s career-averaged fielding percentage (FP) and then divided it by the league-averaged fielding percentage (lgFP) averaged over his career. This “relative clean-fielding rate” was then normalized to 100 percent.
However, fielding percentages among competently fielding pitchers are clustered together, even across different eras. To obtain a less skewed spread, I then subtracted the minimum value obtained for all pitchers in the study and then renormalized that result. This was done to facilitate combination of different statistics into a rating scheme. Note that all of these machinations do not change the order of ranking compared to what would be obtained via a measure as simple as career FP − lgFP; only the values are changed.
This statistic has somewhat more year-to-year volatility for active pitchers than is optimal, a function of the relatively small number of total fielding chances per year for today’s pitchers.
Relative nine-inning range-factor rate (RRF9R). As with RCFR, I obtained a pitcher’s career-averaged nine-inning range factor, divided it by the league-averaged nine- inning range factor averaged over his career, and then normalized the result.
Unfortunately, Baseball-Reference.com does not provide career RF9 and lgRF9 for about 20 percent of all pitchers eventually included in the analysis, representing every decade of the sport and several of the best-fielding pitchers of all time. Using range factor without the nine-inning adjustment was not an option; relief pitchers in particular would have been significantly slighted.
As an imperfect alternative, season RF9 and lgRF9 (which are available for all pitchers) were summed over each pitcher’s career and then averaged. Since this is not equivalent to a career statistic based on total number of chances, a correction was made by omitting from the averages any years in which the pitcher handled fewer than ten chances.
This “fix” was beta-tested on the RF9 of 232 pitchers in the study for whom career RF9 are available. (I did not test it on lgRF9 because of a lack of data availability.) The season-averaged RF9 had an average percent error versus the career RF9 equal to a minuscule 0.045 percent. The largest errors were 5.44 percent and 5.32 percent (Hoyt Wilhelm and Greg Maddux), but they are anomalies; the fix resulted in only 8.6 percent of all pitchers tested having an absolute discrepancy greater than 1 percent versus the career RF9. These estimation errors are presumably not much greater than the inescapable error due to missing data. I therefore concluded that using averages of season RF9 and lgRF9 would be an acceptable substitute for all values of career RF9 and lgRF9.
The greatest error with this fix is a probable slight overestimate of RRF9R for pitchers with long careers spanning periods of rapidly changing lgRF9, which I dub the “Nick Altrock effect.” Since other factors (see below) tend to penalize the earliest pitchers, however, this exaggeration serves as a crude corrective.
Double play–error ratio (DP/E). James (2001, 876–77) observes that the ratio between double plays and errors is a “peripheral quality index” of baseball. Although James is comparing different leagues and age levels, it seems reasonable that comparisons of individuals at the same position in MLB would reveal that high- quality fielders maximize this ratio as well. This metric will mimic fielding percentage to an extent, as we will see, but it also rewards those pitchers who have an additional knack for turning double plays.
A second reason for including DP/E, one that flies in the face of Jamesian argumentation, is that is’s a measure of “clutchness.” As we have seen with the Tigers in October 2006, pitchers’ errors—especially throwing errors—often give the opposing team two extra bases and unearned runs. Conversely, a pitcher- related double play leads to two outs and is, at least in an anecdotal sense, a “rally killer.” According to James (2001, 637), the most commonly occurring pitcher- related DP is the 1–6–3 twin killing, followed far behind by 3–6–1 and 1–4–3: two throwing situations and one catching situation in which the risk of a ball going into the dugout is not negligible. The pitcher who can turn the DP in such make-or-break situations gets a huge boost; the pitcher who cannot and who, worse yet, commits an error on such plays loses all the benefits, and he furthermore gives his opponents an extra out plus one or two extra bases. Such large differences in outcomes can separate successful MLB pitchers from those on the waiver wire (see, for example, Kaplan 1987 for a story about Ed Halicki). This differential effect is captured at least to a small extent in DP/E and seems to be worthy of inclusion as a measure of pitchers’ fielding abilities.
Double plays turned per nine innings (DPd9). In this measure of fielding, the number of double plays turned by a pitcher is divided by the total number of innings pitched and then multiplied by 9. In practice, DPd9 is a kind of mirror image of DP/E. It leans toward the range side of the ledger by rewarding pitchers who turn double plays even when they pitch relatively few innings (e.g., relief pitchers and starters who rarely pitch into the late innings). I have not seen this metric used or discussed in any studies.
By using metrics such as range factor and double plays, this analysis is likely biased toward ground-ball pitchers. No attempt has been made to correct for ground-ball versus fly-ball pitchers; I did not have access to historical statistics that would permit the development of a correction factor. But I also chose not to pursue a correction, since the best-fielding pitchers should rightly be those who have the most opportunities—or intentionally create the most opportunities—to demonstrate their abilities by inducing ground balls. A fly-ball pitcher with great fielding skills who rarely makes fielding plays has chosen to emphasize one talent (getting outs with fly balls) over another (getting ground-ball outs, some of them through his own fielding) and will deservedly get short shrift in this analysis. His rewards lie elsewhere.
To a lesser extent, strikeout pitchers may also be penalized by this analysis; as with fly-ball pitchers, they make the choice to retire batters without their glove. This is briefly explored statistically in the next section.
Taken together, these four measures of fielding prowess should afford a comprehensive, if fairly traditional, view of pitchers’ fielding. In the results section, I justify the use of all four measures and employ different linear combinations of them to create three different rankings of the best-fielding pitchers.
Initial choice of pitchers
Ideally, I would have analyzed the fielding statistics of all pitchers in the history of Major League Baseball. Unfortunately, time constraints prevented such a comprehensive study. Instead, I limited this study to a list of 287 pitchers who satisfied a combination of the criteria outlined below. To be included, pitchers had to have met the following two criteria:
- at least 1,500 innings pitched
- at least 50 percent of all innings pitched from the year 1900 onward
They also had to have satisfied one or more of the following four criteria:
- career FP of at least .960 and at least 10 points higher than career lgFP
- career FP of at least .960 and 7–9 points higher than career lgFP, and RF9R significantly above 1
- Gold Glove recipient
- top 45 in most career assists, top 44 in most career putouts, or top 48 in most career double plays, as listed in The SABR Baseball List and Record Book (SABR 2007, 302–4).
The first criterion is the accepted minimum threshold for pitcher fielding records. Criterion 2 was imposed to focus on the directly comparable modern era of fielding. As noted by James, the number of errors plummeted during the first decade of the twentieth century “as gloves grew in size and padding” (James 2001, 72). League fielding percentages at the pitcher position soared from the low .900s throughout the 1890s to the .940s by 1903–4, and with few exceptions the career lgFP of veteran pitchers has remained between .940 and .960 ever since (as will be seen in figure 1). As a result, the modern age of fielding at the pitcher position dawned very shortly after 1900. Instead of imposing a rigid cutoff date for consideration, I opted to draw the line after players who did more than half their pitching during the nineteenth century. Criteria 3 and 4 give priority to pitchers who were significantly better fielders than their peers and who also posted a FP of at least .960. This minimum FP threshold was chosen because it is near the historical high for career-averaged lgFP (see below). This rewards pitchers who rose above their poorer-fielding eras if they cleared the .960 threshold. Criteria 5 and 6 dispense with the FP threshold and differential, including instead those pitchers with a reputation or long record of fielding achievement.
Admittedly, this approach eliminates from consideration a few relatively excellent fielders of the 1880s and 1890s: for example, Kid Nichols (.952 FP in a .917 era) and Dave Foutz (.925 FP in a .881 era). In the end, I decided that it was a little too much of a stretch to include nineteenth-century pitchers.
While not completely comprehensive, the multiple qualifying criteria of this approach cast a wide net and presumably omit very few fine fielders from the subsequent analysis. This is, at least, a more systematic approach than the “wild guess” or conventional wisdom of Neyer, Kaplan, or the Rawlings finalist-selection committee.
RESULTS
The career statistics for the 287 MLB pitchers selected via the criteria outlined above were analyzed using the four measures of fielding described above (pages 50–52). First I discuss aggregate statistics and trends for the whole group, and then I turn to individual rankings of the 100 top-fielding pitchers.
Aggregate trends over time
Out of the 287 pitchers considered, 203 (71 percent) were right-handers and 84 (29 percent) were left-handers. This suggests a somewhat higher proportion of southpaws in the study than in the general population or in the rank-and-file MLB pitching population.
The decade of first appearance on the mound for each pitcher is chronicled in table 1. All decades of the twentieth century are represented substantially, with the greatest concentration from the 1950s onward.
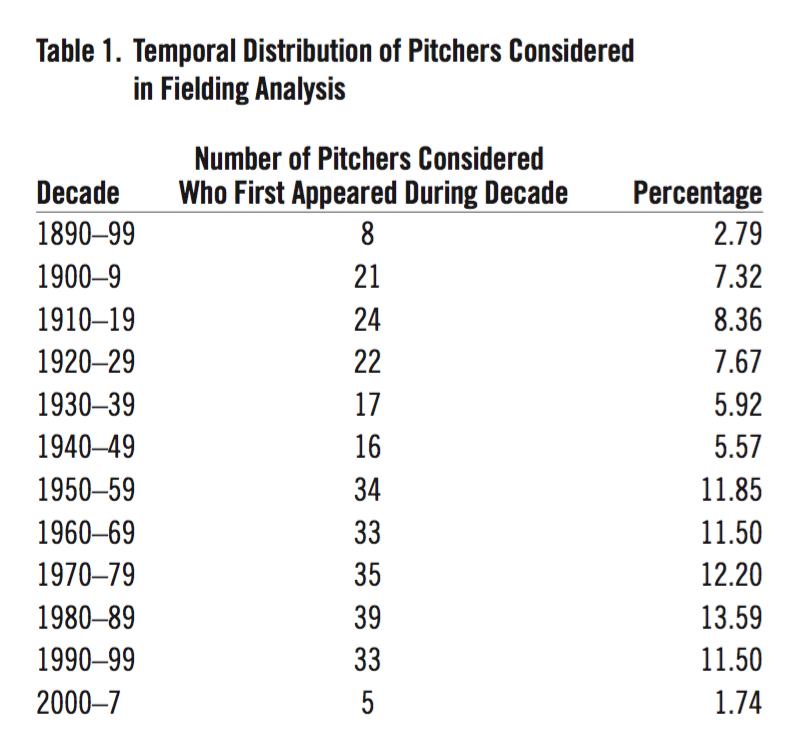
Figure 1 illustrates the evolution of fielding by pitchers over time, by plotting career-averaged lgFP as a function of the midpoint of each pitcher’s career.
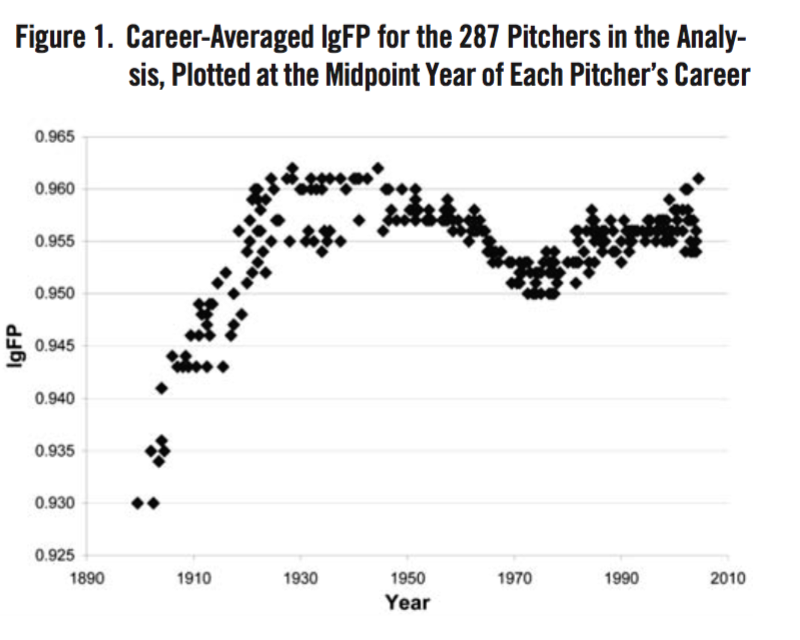
A peak, along with a clear differential between the better-performing National League pitchers and less-successful American League pitchers, is evident in the years bracketing the 1930s. A noticeable dip in career-averaged lgFP occurred in the 1960s and 1970s. This fielding slump may have been a consequence of the introduction of artificial turf, or—recalling James’s observation that various measures of quality-of-play decrease after expansion (James 2001, 878)—it may have been due to the leagues’ formation of new teams; or it could have resulted from both of these factors. From the 1980s to the present, fielding percentages have generally risen slowly back toward the 1930s peak.
The evolution of range factor is less complicated. The trend of career-averaged lgRF9 among the pitchers analyzed is nearly monotonically downward (figure 2), peaking near 3.25 in the early 1900s and descending thereafter to below 1.70 today.
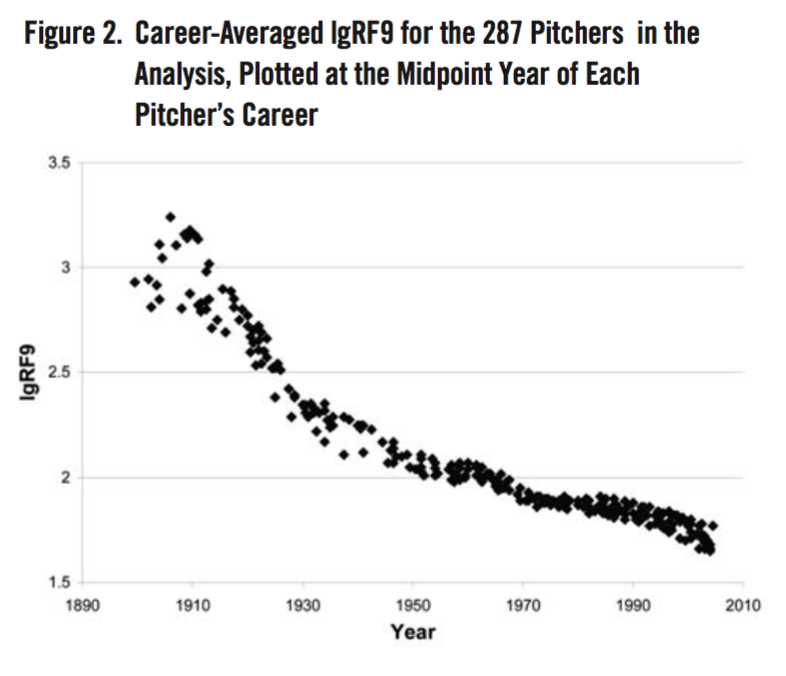
As noted by James (2001, 877), the number of fielding plays by pitchers decreases consistently as one moves upward from Little League to the major leagues. Figure 2 shows this has also been the case as one moves forward in time in MLB from the early 1900s to the early 2000s. Interestingly, the NL–AL differential in career-averaged lgRF9 during the early to mid twentieth century seems less obvious than in career-averaged lgFP.
Statistics of fielding measures
Before normalizing the results and compiling scores, it is instructive to look at the range of raw values for career-averaged FP, RF9 (approximated for all pitchers, as described above, pages 50–52), DP/E, and DPd9 for the pitchers examined. Table 2 lists some relevant details.
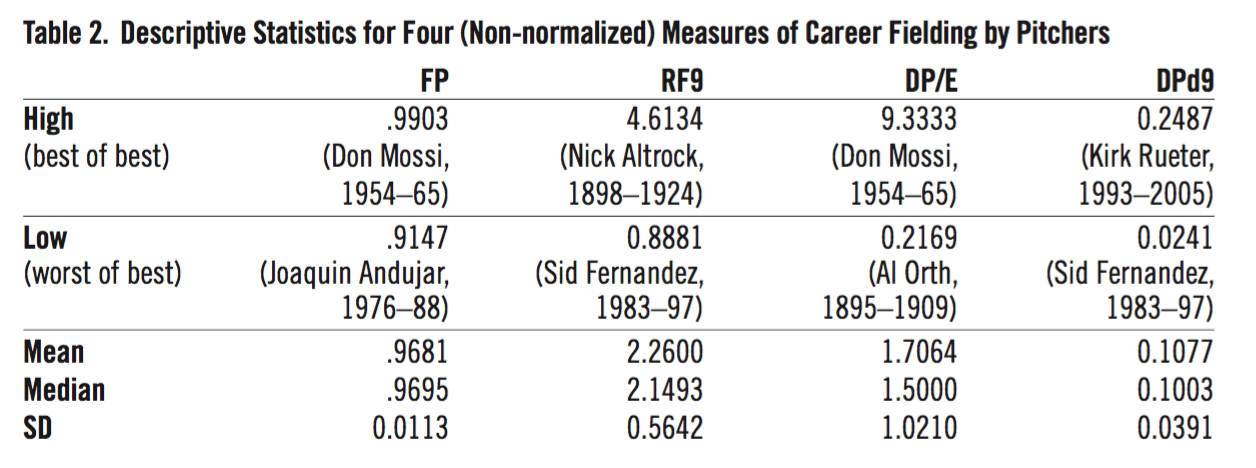
Rawlings finalists and perennial Gold Glove winners Jim Kaat and Bob Gibson do not show up among the leaders in any of the categories—a hint of some surprises to come.
One question that arose during this study was: Are different measures of fielding independent of each other, or are they duplicative, measuring the same attributes? As a simple test of independence, I calculated correlations between the normalized RCFR, RRF9R, DP/E, and DPd9. The results are presented in table 3.
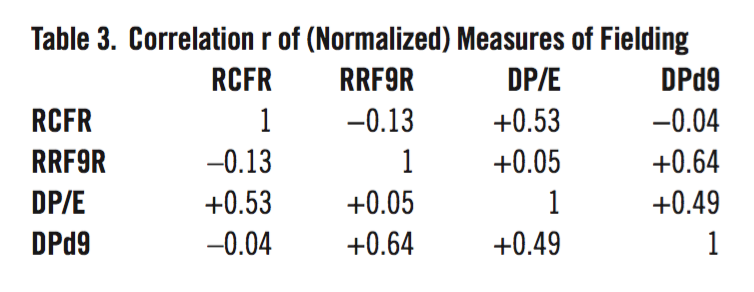
These correlations range from negligible (for RRF9R- DP/E and RCFR-DPd9) to moderately high (for DPd9 − RRF9R, RCFR − DP/E, and DP/E − DPd9). Even so, no one factor explains more than 41 percent of the variance of another factor. (Very high correlations are obtainable with this data set; for example, the correlation between year and lgRF9 is a robust r = −0.94.)
Perhaps most importantly, the intuitive notion that sure-handedness (proxied by RCFR) and range (proxied by RRF9R) are largely independent, complementary measures of fielding is supported by this statistical analysis. The two variables are weakly negatively cor- related (r = −0.13), confirming that, in fact, when a pitcher’s reach exceeds his grasp, he makes a few more errors as a result.
These correlations also confirm that DP/E reinforces the measure of sure-handedness, but it is not a carbon copy of RCFR and exhibits virtually no relationship with range. Conversely, DPd9 reinforces the measure of range, but does not duplicate RRF9R and bears almost no relationship to sure-handedness. Also, despite both being based on double-play statistics, DP/E and DPd9 do not overlap overmuch.
In summary, this statistical analysis provides some encouragement for including all four measures in the calculations and rankings that follow, giving priority to RCFR and RRF9R as the dominant measures of fielding.
Individual rankings
What is the best way to bring together different measures of ability into one overall rating? My approach in this paper was to normalize each fielding measure on a 100-point scale and then combine them into a point maximum score, weighting each of the four fielding measures independently.
To accommodate both schools of thought regarding fielding, I made several different calculations to derive the scores and ranks that appear on my list of the 100 top-fielding pitchers. Following are the three separate equations used:
- Range-Biased Score = 60% RCFR + 30% RRF9R + 5% DP/E + 5% DPd9
- Sure-Handedness (SH)-Biased Score = 60% RRF9R + 30% RCFR + 5% DP/E + 5% DPd9,
- No-Bias Score = 45% RCFR + 45% RRF9R + 5% DP/E + 5% DPd9
The weighting percentages used in the two biased scores are admittedly arbitrary. The 60-30-10 breakdown emphasizes one facet of performance without overwhelming the other. The choice of small percentages for DP/E and DPd9 arose from analysis of the correlations and the strikingly non-normal distribution of the two statistics (see table 2).
Overweighting DP/E and DPd9 would arguably exaggerate the importance of a very few plays each season. (The statistical analysis also afforded the opportunity to test indirectly the hypothesis that strikeout pitchers are penalized by the scoring process. The correlation between the number of strikeouts per nine innings and the no-bias score is 0.22, indicating that strikeout pitchers score somewhat lower than pitchers who obtain few strikeouts. The correlation is not especially strong, however, implying that the analysis is not overly slanted against strikeout pitchers.)
The no-bias score is the one that I will focus upon the most. In table 4, I rank the top 100 pitchers using the no-bias calculation, giving the score for each pitcher and also providing the rank for each pitcher based on my sure-handedness–biased and range-biased calculations.
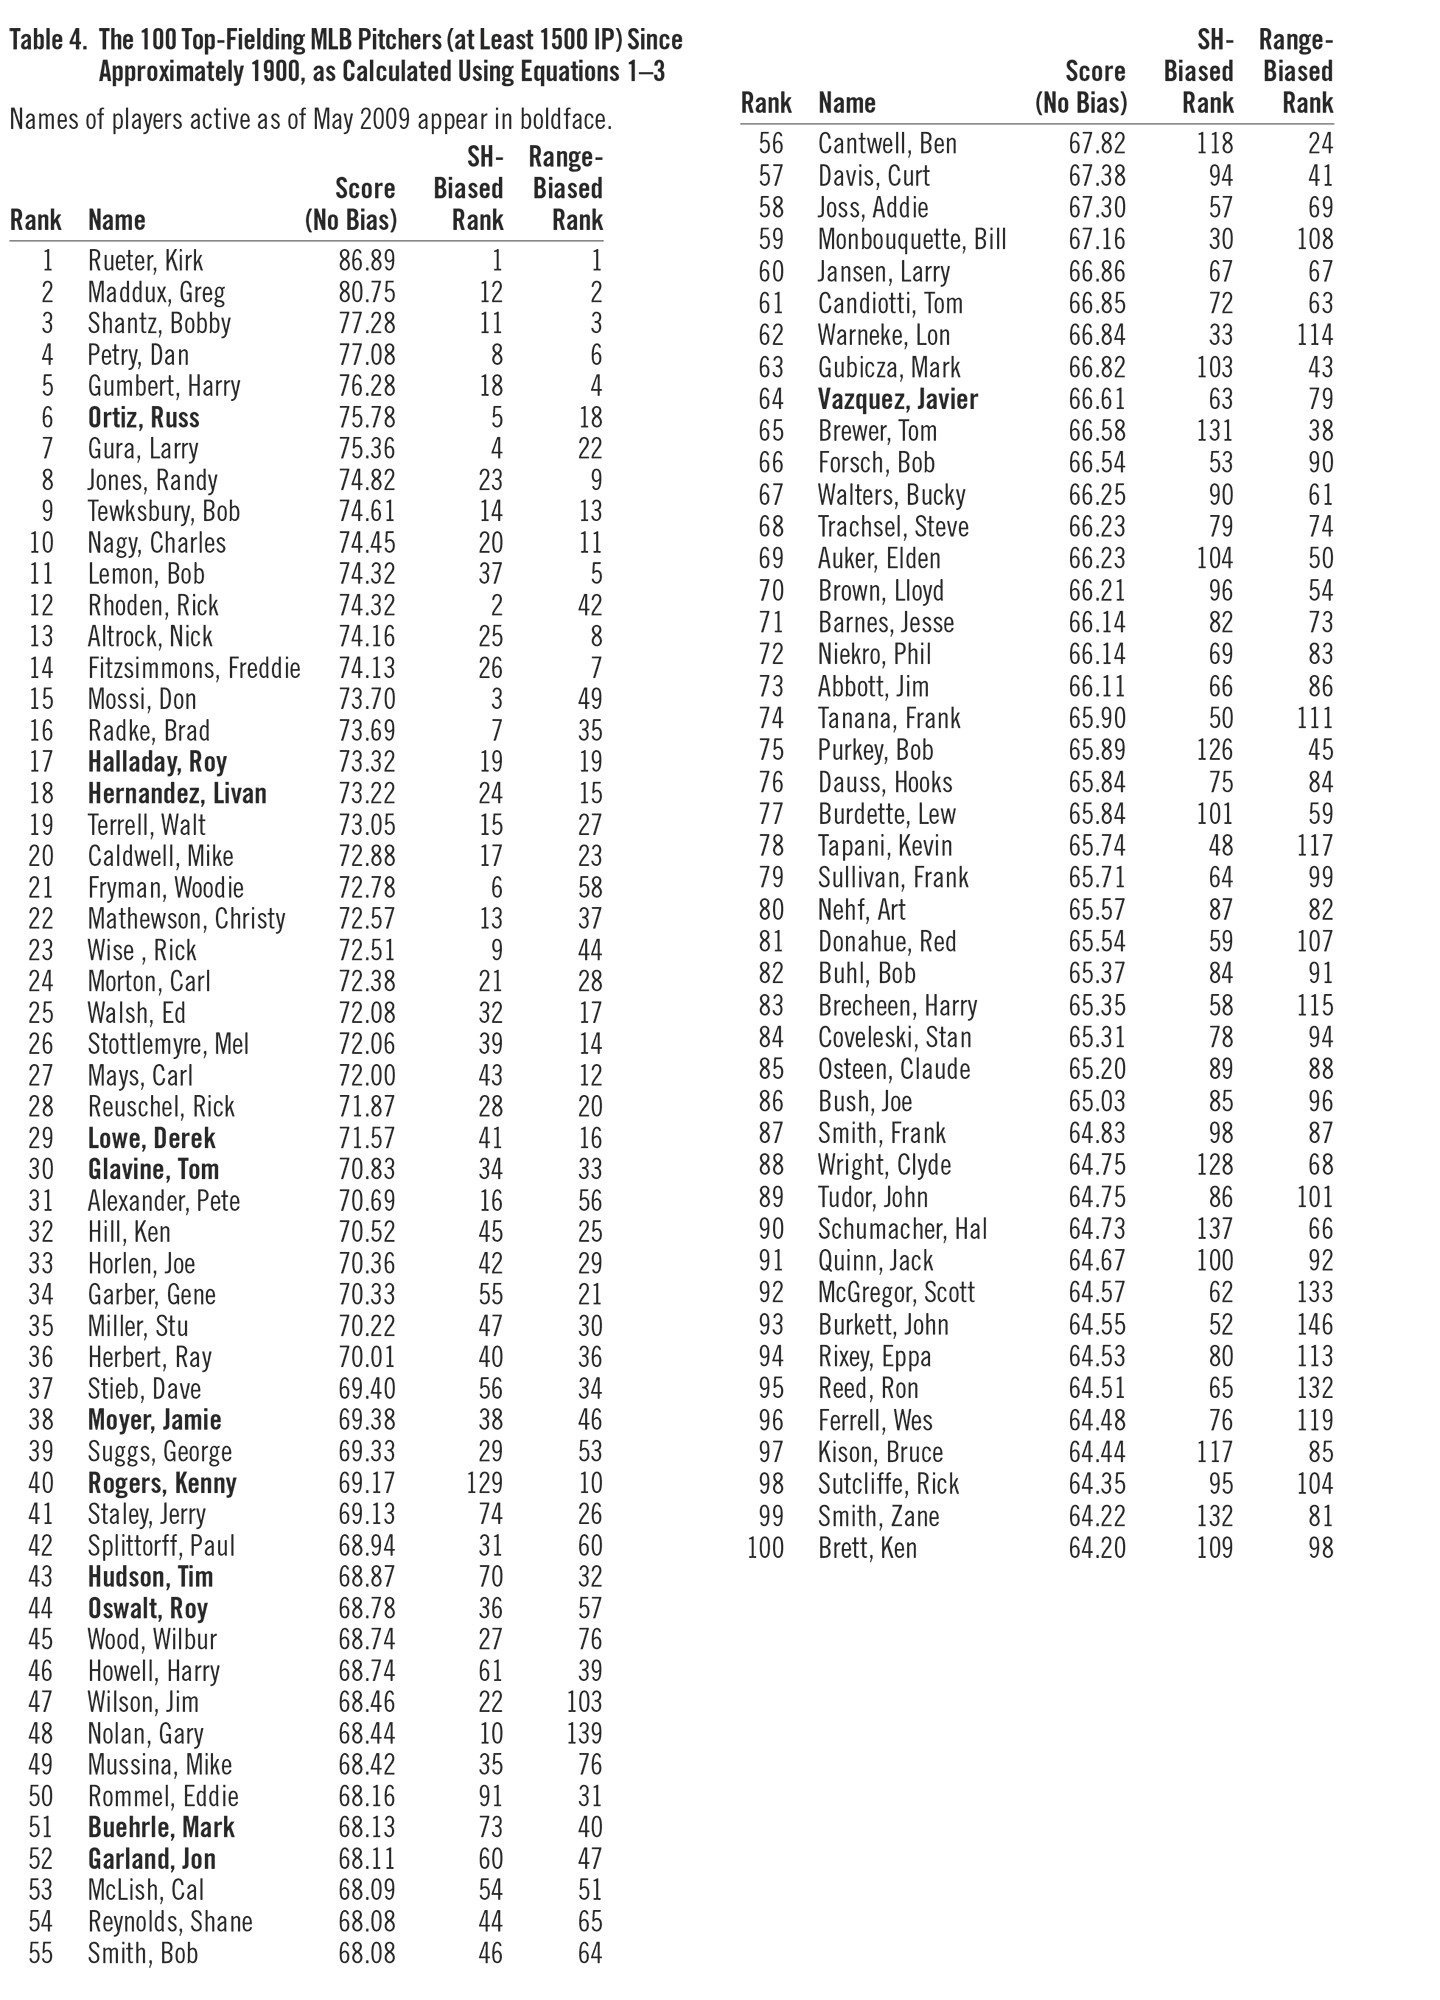
(Click image to enlarge)
DISCUSSION AND CONCLUSIONS
The most shocking and compelling conclusion drawn from the foregoing analysis is that Kirk Rueter was the Mozart of fielding pitchers; in the “no bias” rating, his numerical lead over second-ranked pitcher Greg Maddux is as large as the gap between numbers 2 and 9! (And this analysis is actually biased toward Maddux, because of the overestimate in Maddux’s RRF9R noted earlier; without that bias, Rueter’s lead over Maddux would be 1.72 points larger.) Yet Rueter never won a Gold Glove and is mentioned infrequently as one of the better fielding pitchers of his time. Below, to dispel any notion that this result is a statistical fluke, I examine the case for Rueter’s fielding brilliance, as well as the surprising absence or presence of some names on the top-100 list.
The case for Rueter
Kirk Rueter excelled at every phase of fielding. His career FP of .988 ranks as sixth-best all-time.4 Rueter’s RF9 of 2.70 is third among all those in this study who pitched during the past three decades. Even better, Rueter’s DP/E ratio of 53/7 = 7.57 is second only to Don Mossi’s 9.33; after Russ Ortiz (7.00), no other pitcher’s DP/E is within half of Mossi’s record. But Rueter shines brightest in the overlooked statistic of DPd9, in which he ranks first all-time, outpacing the renowned fielders Bob Lemon and Bobby Shantz. No other pitcher among the 287 examined excelled in each of the four fielding measures, not even Greg Maddux (whose career FP of .970 is solid, but hardly record-setting).
Even when biasing the results toward sure-handedness or range, Rueter remains on top. Out of all the pitchers in the study, only Rueter and Dan Petry place in the top 10 in all three calculations, and Rueter is first in all three. To displace Rueter from the top position, one must either focus almost solely on FP or on RF9 and ignore double plays. The bottom line is that for a wide range of reasonable interpretations of all-around fielding prowess by pitchers, Kirk Rueter is king.
Why was Rueter’s virtuoso performance overlooked during his career? First, he had the bad luck to coincide with the second-best-ever fielding pitcher, Greg Maddux, who exhibits the best relative range among all pitchers in this study. Rueter’s exceptional year of 2001, in which he fielded 1.000, had an RF9 of 2.81, and turned 1 DPs (the most by an MLB pitcher in a quarter-century), captured little attention when compared to Maddux’s Gold Glove performance of .986 FP, 2.82 RF9, and 3 DPs.
Furthermore, “style points” seem to matter in impressions of pitchers’ fielding. The “Mad Dog” attacked grounders like a rabid canine. In contrast, on the mound Rueter, listed at 6-foot-3 and 195 pounds but seemingly closer to a Rick Reuschel weight of 235 pounds, was never confused with a Baryshnikov or a Bob Gibson. He simply got the job done in the field better than anyone else, usually in short outings (Rueter averaged about 5.7 innings per start for his entire career), which prevented him from setting single-game fielding records. All of these factors combined may have led to the egregious omission of Kirk Rueter from the pantheon of the very best fielders in the history of Major League Baseball. The primary result of this paper, aside from quantifying fielding by pitchers, should be the establishment of Rueter’s claim to the throne.
The case for Maddux and Shantz, and a curious phenomenon
The case for Maddux and Shantz, and a curious phenomenon Kirk Rueter’s exceptional brilliance as a fielder should not detract from the praise correctly lavished on Greg Maddux (18 Gold Gloves) and Bobby Shantz (8 Gold Gloves). Conventional wisdom and this statistical analysis agree that Maddux and Shantz are among the best-ever fielding pitchers. (This, in turn, lends more credence to the conclusions drawn regarding Rueter.) Both Maddux and Shantz exemplify extraordinary range, but they committed more errors than the sure-handed Rueter.
Although this study has not addressed the fine-grained detail of season fielding performances, one fascinating nugget unearthed from a comparison of these three pitchers deserves discussion. Shantz, Maddux, and Rueter did something extremely unusual at the very ends of their careers: their RF9 values shot through the roof at ages when nearly all other fielders at all positions are losing range.
In Bobby Shantz’s last three years in MLB, in 1962, ’63, and ’64, or from age 36 to 38, his RF9 values were 4.02, 3.52, and an incredible 5.02. These values should be compared to an estimated career RF9 for Shantz of “only” 3.00, and his previous high of 3.69 at age 31. Shantz’s 5.02 may be the highest pitcher RF9 since the early 1900s, even without adjustment for lgRF9. Even more spectacularly, 5.02 is just 0.01 shy of Ozzie Smith’s career-average RF (but not RF9) at shortstop! Shantz deservedly won the Gold Glove in these three years; the pitching Gold Glove probably should have been permanently named after him for his miracle fielding season of 1964.
Somewhat similarly, in his last two years Maddux returned to mid-career form in terms of RF9: 3.18 in 2007 and 3.43 in 2008 at age 42, the latter his highest RF9 since 3.57 in 1999. These values exceed his phenomenal career RF9 of 3.13. In his last seven games in the majors, Maddux stepped up his fielding performance even more, gobbling up grounders to the tune of a 3.54 RF9.
Kirk Rueter posted career-best RF9 in each of his last two years in the big leagues in 2004 and 2005, at ages 33 and 34. Compared to a career RF9 of 2.70, Rueter’s RF9 suddenly soared from 2.34 in 2001 and 2.63 in 2002, to 3.26 in 2004 and 3.86 in 2005.
What is responsible for this counter-intuitive trend in range factor? Rueter was losing effectiveness as a pitcher, with climbing ratios of walks-plus-hits per inning pitched (WHIPs) of 1.529 and 1.658 in 2004–5. According to the ESPN website, Rueter’s ground- ball/fly-ball ratio skyrocketed from 1.02 in 2001 to 1.60 in 2004, but came back down to 1.15 in 2005. Therefore, more and more balls were jumping off the bats, back to the mound, and into Rueter’s glove. A similar phenomenon could have been at work at the end of Maddux’s career, to an extent, although his ground- ball/fly-ball ratio actually decreased to just above 1.00 in 2007–8. No such explanation suffices for Shantz, whose ERAs and WHIPs stayed well below career and league averages in 1962–64. One alternative explanation is that these masters of fielding were intentionally using their gifts with the glove to prolong their tenures as major-league pitchers.
The case against Kaat and Gibson
Where are Jim Kaat and Bob Gibson on the top-100 list? Along with Maddux, they were the finalists for the Rawlings “Summer of Glove” award for best-fielding pitcher, the recipients of 25 Gold Gloves between them (16 to Kaat, 9 to Gibson).
So it is shocking that of the 287 pitchers analyzed in this study, Kaat comes in at a miserable number 272, Gibson even worse at number 277. Why are both Kaat and Gibson in the lowest 16 of nearly 300 good-fielding pitchers in this study? Neither pitcher posted a career FP equal to the lgFP over their eras. Their range factors were near league norms. They turned a fair number of double plays, but at less than half the per-inning rate of Kirk Rueter. Whatever it was that inspired the voters to give 25 Gold Gloves to Kaat and Gibson does not turn up in this analysis, but it is blindingly obvious in the case of Maddux and Shantz and their 26 Gold Gloves.
My best explanation is that “flashbulb memories” of spectacular plays in crucial games cemented Gibson’s reputation. Kaat’s acumen for the finer aspects of fielding (see Kaplan 1987) overshadowed his actual day-in-day-out performance on the field. The ritual awarding of Gold Gloves regardless of statistical performance (e.g., Kaat’s eighth Gold Glove year of 1969: .826 FP, 1.41 RF9) also probably played a role in solidifying conventional wisdom, regardless of performance. This statistical analysis, however, makes a strong case against Jim Kaat and Bob Gibson being two of the best-fielding pitchers of all time.
Other surprising omissions
In any list of the best in baseball, there is always one player who just misses the cut. In major league baseball, that man is always Tommy John. As fate would have it, Tommy John placed number 105 in the no-bias score calculation, just 0.27 points behind Ken Brett. Consistently on the cusp via his consistency, and now having missed the biggest cut of all (his last non– Veterans Committee chance to be voted into the Hall of Fame), John deserves an Irving R. Thalberg Award for lifetime almost-great achievement under trying circumstances in all baseball endeavors, including fielding.5
Among relatively recent pitchers with exceptional range, Fernando Valenzuela (number 1 6; .963 FP, 2.42 RF9), Mike Hampton (number 121; .960 FP, 2.48 RF9) and Kevin Brownvi (number 176; .951 FP, 2.63 RF9) are often mentioned. Neither Hampton nor Brown, however, posted FP values significantly better than league averages. These three pitchers place number 78, number 52, and number 71, respectively, in the range-biased score calculation, about 20 points behind the leaders.
One surprising inclusion
Among the best-fielding pitchers is the only career-long pure reliever on the list: Gene Garber (number 34, .967 FP, 2.62 RF9). Garber’s appearance is surprising for at least two reasons: (1) unless RF9 is used, relievers’ range factors are misleadingly low, and they are probably overlooked as a result; and (2) Garber’s unorthodox 180-degree pivoting delivery and sidearm throwing style sent chills up the spines of 1980s-era Braves fans whenever he had to field a batted ball. Yet the statistics indicate that “Geno” was the all-around best-fielding pure reliever of his time, at least among those with at least 1,500 innings under their belts. (Mike Marshall, Clay Carroll, and Kent Tekulve all posted similarly impressive fielding statistics, but failed to pitch enough innings to qualify.) Stu Miller (number 35) is the other reliever on the list.
Current pitchers on the list
Twelve of the 100 top best-fielding pitchers are currently active. Of particular note are the following:
- Roy Halladay (number 17), second-best among actives, whose consistency has never garnered a Gold Glove but is a plausible factor in his four top-five finishes in the Cy Young.
- Livan Hernandez (number 18), who rates at the top in Dewan’s plus/minus scheme, although his performance sagged in 2008.
- Kenny Rogers (number 40), a member of the 2006 World Series–losing Tigers, whose exceptional range (number 10 in range-biased score; 2.73 RF9) has likely been instrumental in his snagging of five Gold Gloves. His season fielding percentages, how- ever, have often been in the low-to-mid .900s—for example, .912 in his Gold Glove year of 2006. Ironically, Rogers’s 2008 performance (.987 FP, 3.94 RF9, 1 DPs) at age 43 arguably ranks among the best fielding seasons in all of MLB pitching history, but it did not rate a Gold Glove; Mike Mussina’s efforts (.976 FP; 1.84 RF9; 4 DPs) did.
Summary and future work
A four-variable ranking scheme has been applied to the fielding statistics of 287 MLB pitchers spanning the last eleven decades of Major League Baseball. This scheme is based on functions of fielding percentage differential versus league averages; nine-inning range factor versus league averages; the ratio of double plays to errors; and the number of double plays turned per nine innings. The results reveal longtime San Francisco Giants pitcher Kirk Rueter to be the most accomplished all-around fielding pitcher in the modern history of baseball, by a considerable margin. Perennial Gold Glove recipients Greg Maddux and Bobby Shantz follow Rueter, lending confidence to the ranking scheme. The results lead to a variety of conclusions and speculations about the fielding abilities of individual pitchers, many of them counter to prevailing wisdom. Along with the Rueter revelation, another surprising conclusion is that the accolades heaped on Jim Kaat and Bob Gibson for their fielding prowess are not even remotely justifiable via this analysis.
This work is admittedly more of a pilot study than a definitive work on the subject. Future work should examine all pitchers instead of a subset, since a few high-RF9/mediocre-FP pitchers may have been missed in this analysis who would rate in the top 100 of a range-biased ranking. A further improvement would be to apply more sophisticated approaches to the field- ing of pitchers, perhaps Dewan’s plus/minus scheme or a variant of the Win Shares method of James. An application of eigenvector analysis might also be able to identify truly independent variables for measuring fielding. I hope that any future efforts will be compared and contrasted to the methods and results of this paper.
Acknowledgments
I thank Charlie Pavitt, Barry Flanagan, Stephen Jascourt, Pam Knox, David Knox, and Satya Patel for their assistance and comments.
Other Sources
Dewan, John. The Fielding Bible. New York: ACTA, 2006.
James, Bill. The New Bill James Historical Baseball Abstract. New York: Free Press, 2001.
Kaplan, Jim. “The Pitcher as Fielder.” In The National Pastime, ed.
John Thorn. New York: Warner Books, 1987.
SABR. The SABR Baseball List and Record Book. Edited by Lyle Spatz.
New York: Scribner, 2007.
Notes
- Baseball Examiner (http://www.baseballexaminer.com/statoftheweek/5-12-06.htm). In volume 2 of The Fielding Bible (Skokie, Ill.: ACTA, 2009), Dewan does discuss pitcher fielding, but this source was published too late for me to incorporate his discussion into this present article.
- Rob Neyer, ESPN (http://sports.espn.go.com/espn/print?id=141037 3&type=columnist).
- Baseball Examiner (baseballexaminer.com/statoftheweek/5-12-06.htm).
- The SABR Baseball List and Record Book (SABR 2007) incorrectly ranks Rueter as seventh by placing Jim Wilson above Rueter. The statistics found at Baseball-Reference.com indicate that Rueter leads Wilson by a microscopic .00000515.
- As James (2001, 885) observes, Tommy John was a mathematics major in college—and so is possibly the only pitcher mentioned in this article who is also qualified to peer-review it.
- Kevin Brown is the only pitcher examined who did not qualify by fulfilling at least one of my criteria 3 through His name arose instead during initial discussions with Jim Charlton about this manuscript, and I was loath to leave him out.